

Tumor heterogeneity and tumor-microglia interactions in primary and recurrent IDH1-mutant gliomas
- PMID: 37883975
- PMCID: PMC10694621
- DOI: 10.1016/j.xcrm.2023.101249
Tumor heterogeneity and tumor-microglia interactions in primary and recurrent IDH1-mutant gliomas
Abstract
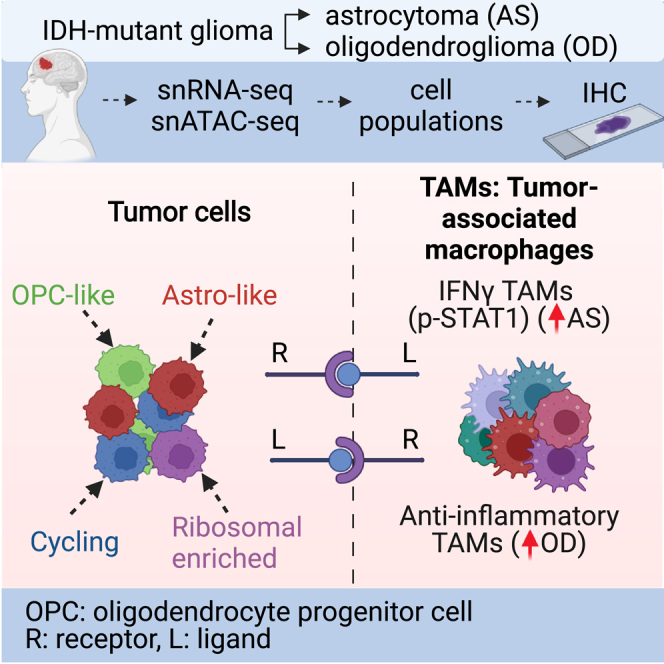
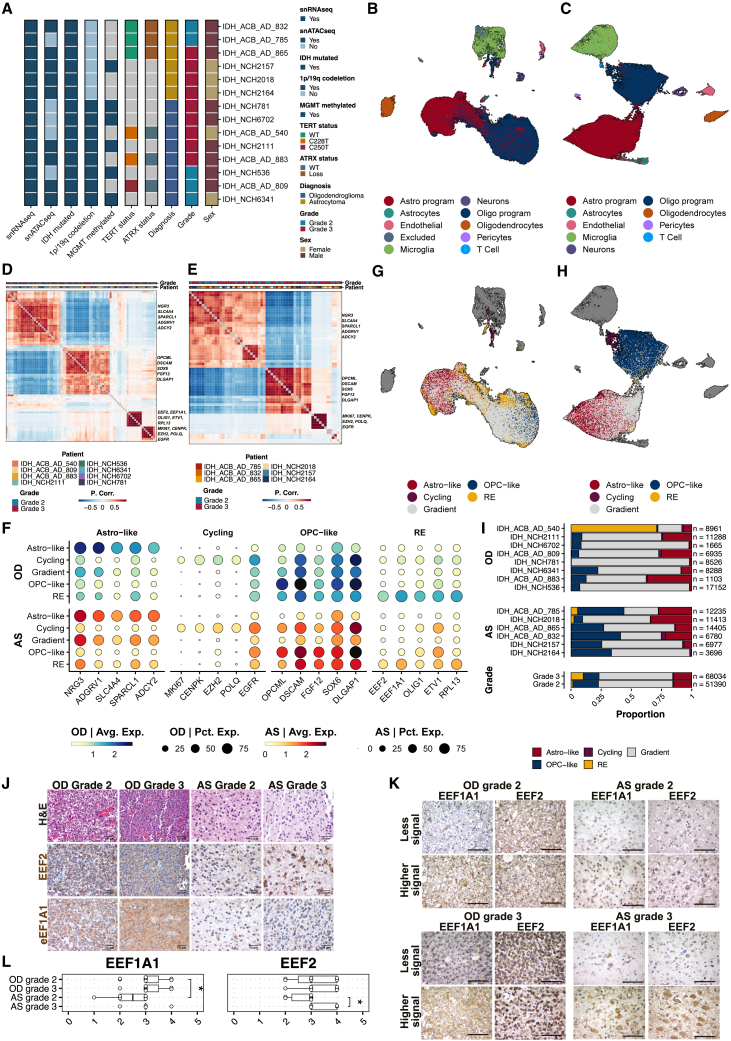
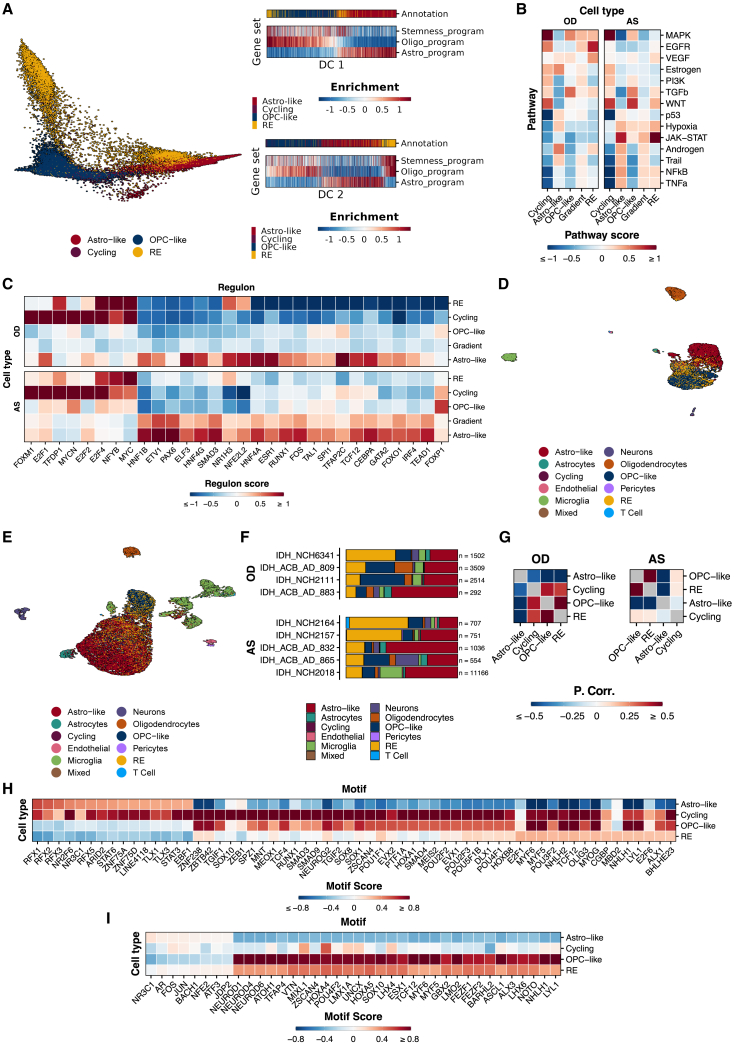
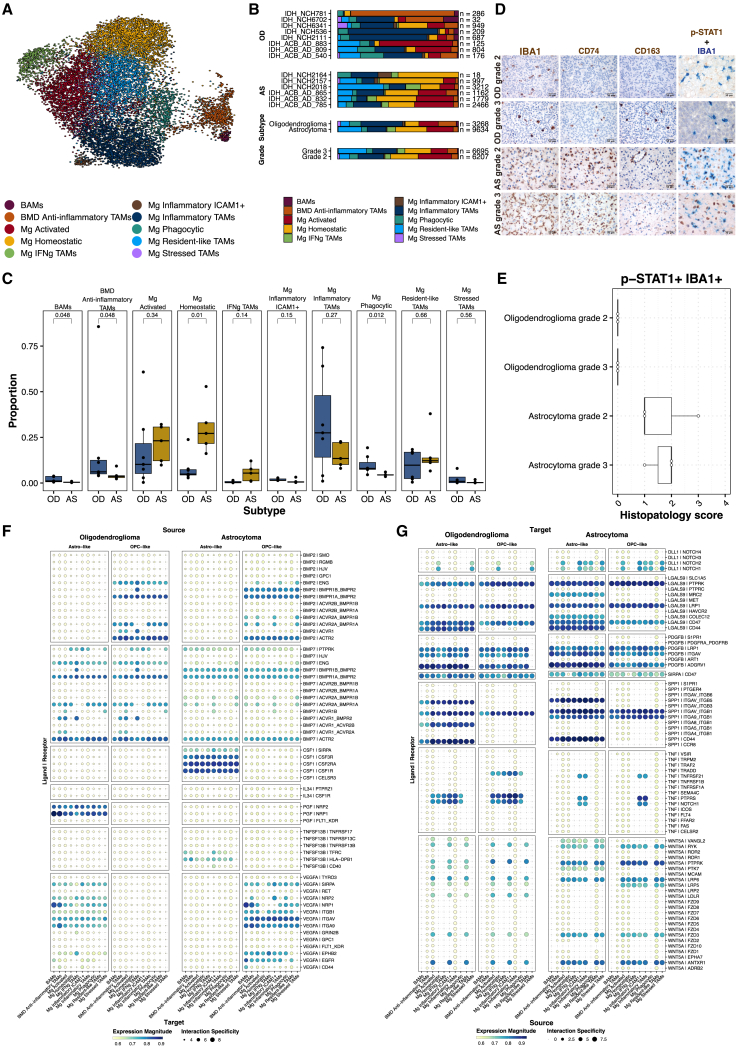
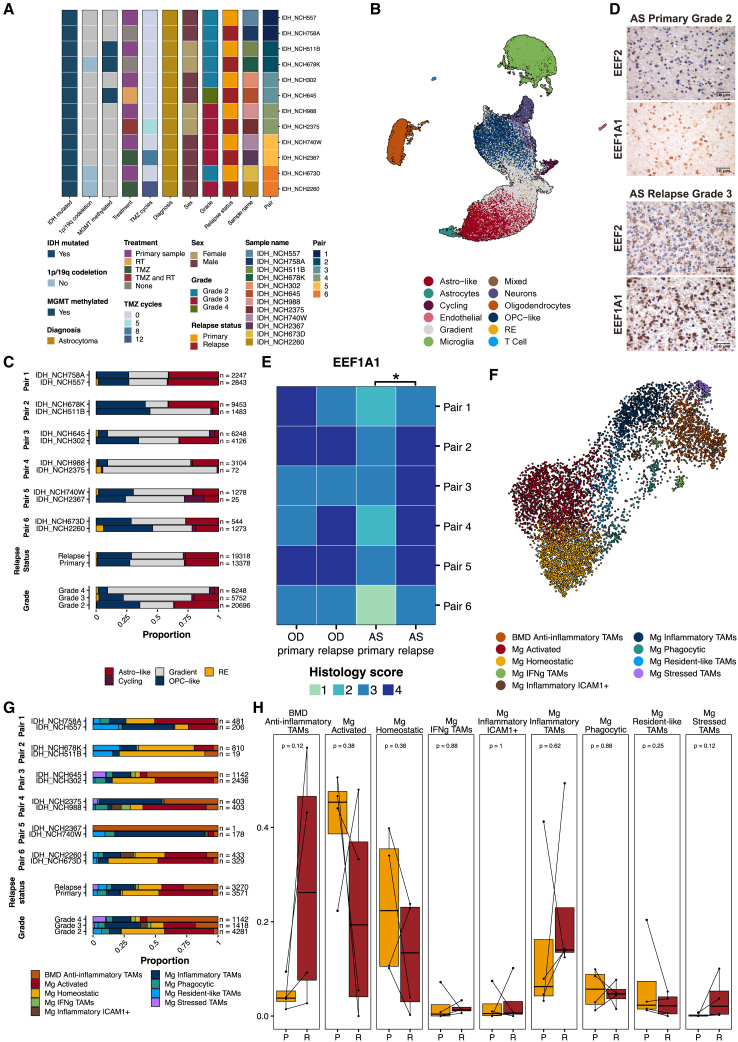
The isocitrate dehydrogenase (IDH) gene is recurrently mutated in adult diffuse gliomas. IDH-mutant gliomas are categorized into oligodendrogliomas and astrocytomas, each with unique pathological features. Here, we use single-nucleus RNA and ATAC sequencing to compare the molecular heterogeneity of these glioma subtypes. In addition to astrocyte-like, oligodendrocyte progenitor-like, and cycling tumor subpopulations, a tumor population enriched for ribosomal genes and translation elongation factors is primarily present in oligodendrogliomas. Longitudinal analysis of astrocytomas indicates that the proportion of tumor subpopulations remains stable in recurrent tumors. Analysis of tumor-associated microglia/macrophages (TAMs) reveals significant differences between oligodendrogliomas, with astrocytomas harboring inflammatory TAMs expressing phosphorylated STAT1, as confirmed by immunohistochemistry. Furthermore, inferred receptor-ligand interactions between tumor subpopulations and TAMs may contribute to TAM state diversity. Overall, our study sheds light on distinct tumor populations, TAM heterogeneity, TAM-tumor interactions in IDH-mutant glioma subtypes, and the relative stability of tumor subpopulations in recurrent astrocytomas.
Keywords: IDH mutation; astrocytoma; bone-marrow-derived macrophages; glioma; microglia; oligodendroglioma; recurrent glioma; snATAC-seq; snRNA-seq; tumor microenvironment.
Copyright © 2023 The Author(s). Published by Elsevier Inc. All rights reserved.
Conflict of interest statement
Declaration of interests The authors declare no competing interests.
Figures
Similar articles
-
IDH-mutant diffuse gliomas: tips and tricks in the era of genomic tumor classification.Histol Histopathol. 2023 Jul;38(7):739-753. doi: 10.14670/HH-18-582. Epub 2023 Jan 9. Histol Histopathol. 2023. PMID: 36651583 Review.
-
[Mutation of isocitrate dehydrogenase gene in Chinese patients with glioma].Zhonghua Bing Li Xue Za Zhi. 2013 May;42(5):292-8. doi: 10.3760/cma.j.issn.0529-5807.2013.05.002. Zhonghua Bing Li Xue Za Zhi. 2013. PMID: 24004584 Chinese.
-
Single-Cell Profiling and Proteomics-Based Insights Into mTORC1-Mediated Angio+TAMs Polarization in Recurrent IDH-Mutant Gliomas.CNS Neurosci Ther. 2025 Apr;31(4):e70371. doi: 10.1111/cns.70371. CNS Neurosci Ther. 2025. PMID: 40202138 Free PMC article.
-
Diagnostic algorithm for pathological evaluation of gliomas in a resource-constrained setting.J Cancer Res Ther. 2023 Apr-Jun;19(3):562-566. doi: 10.4103/jcrt.jcrt_102_21. J Cancer Res Ther. 2023. PMID: 37470575
-
Impending Impact of Molecular Pathology on Classifying Adult Diffuse Gliomas.Cancer Control. 2015 Apr;22(2):200-5. doi: 10.1177/107327481502200211. Cancer Control. 2015. PMID: 26068765 Review.
Cited by
-
Epigenetic Regulation of Stromal and Immune Cells and Therapeutic Targets in the Tumor Microenvironment.Biomolecules. 2025 Jan 6;15(1):71. doi: 10.3390/biom15010071. Biomolecules. 2025. PMID: 39858465 Free PMC article. Review.
-
Evolving cell states and oncogenic drivers during the progression of IDH-mutant gliomas.Nat Cancer. 2025 Jan;6(1):145-157. doi: 10.1038/s43018-024-00865-3. Epub 2024 Nov 21. Nat Cancer. 2025. PMID: 39572850
-
Co-expression of immune checkpoints in glioblastoma revealed by single-nucleus RNA sequencing and spatial transcriptomics.Comput Struct Biotechnol J. 2024 Apr 10;23:1534-1546. doi: 10.1016/j.csbj.2024.04.014. eCollection 2024 Dec. Comput Struct Biotechnol J. 2024. PMID: 38633388 Free PMC article.
-
Targeting gut microbiota: a potential therapeutic approach for tumor microenvironment in glioma.Front Neurol. 2025 Mar 21;16:1549465. doi: 10.3389/fneur.2025.1549465. eCollection 2025. Front Neurol. 2025. PMID: 40183013 Free PMC article. Review.
-
Oncogene aberrations drive medulloblastoma progression, not initiation.Nature. 2025 Jun;642(8069):1062-1072. doi: 10.1038/s41586-025-08973-5. Epub 2025 May 7. Nature. 2025. PMID: 40335697 Free PMC article.
References
-
- Louis D.N., Perry A., Wesseling P., Brat D.J., Cree I.A., Figarella-Branger D., Hawkins C., Ng H.K., Pfister S.M., Reifenberger G., et al. The 2021 WHO Classification of Tumors of the Central Nervous System: a summary. Neuro Oncol. 2021;23:1231–1251. doi: 10.1093/neuonc/noab106. - DOI - PMC - PubMed
-
- Klemm F., Maas R.R., Bowman R.L., Kornete M., Soukup K., Nassiri S., Brouland J.P., Iacobuzio-Donahue C.A., Brennan C., Tabar V., et al. Interrogation of the Microenvironmental Landscape in Brain Tumors Reveals Disease-Specific Alterations of Immune Cells. Cell. 2020;181:1643–1660.e17. doi: 10.1016/j.cell.2020.05.007. - DOI - PMC - PubMed
Publication types
MeSH terms
Substances
Supplementary concepts
LinkOut - more resources
Full Text Sources
Medical
Molecular Biology Databases
Research Materials
Miscellaneous
