Meta-Analysis
. 2023 Nov 8;31(11):1804-1819.e9.
doi: 10.1016/j.chom.2023.09.013. Epub 2023 Oct 25.

Extension of the Segatella copri complex to 13 species with distinct large extrachromosomal elements and associations with host conditions

Affiliations
Meta-Analysis

Extension of the Segatella copri complex to 13 species with distinct large extrachromosomal elements and associations with host conditions

Aitor Blanco-Míguez et al. Cell Host Microbe. .

Abstract

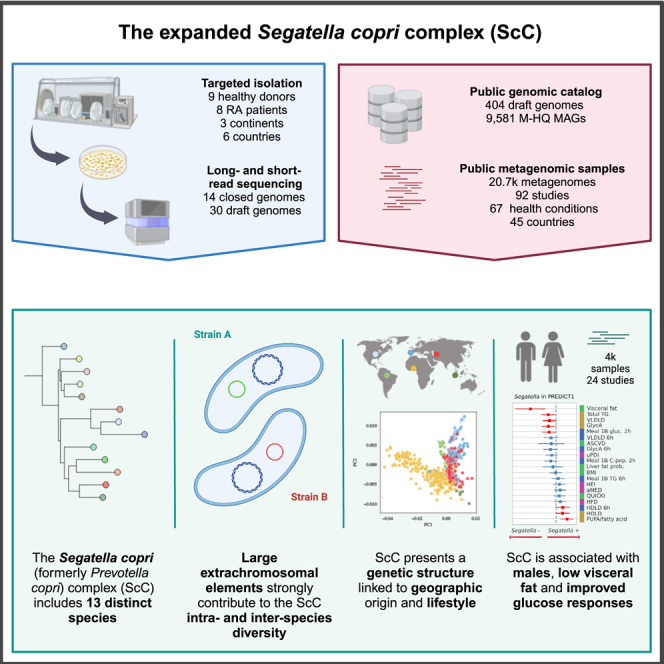
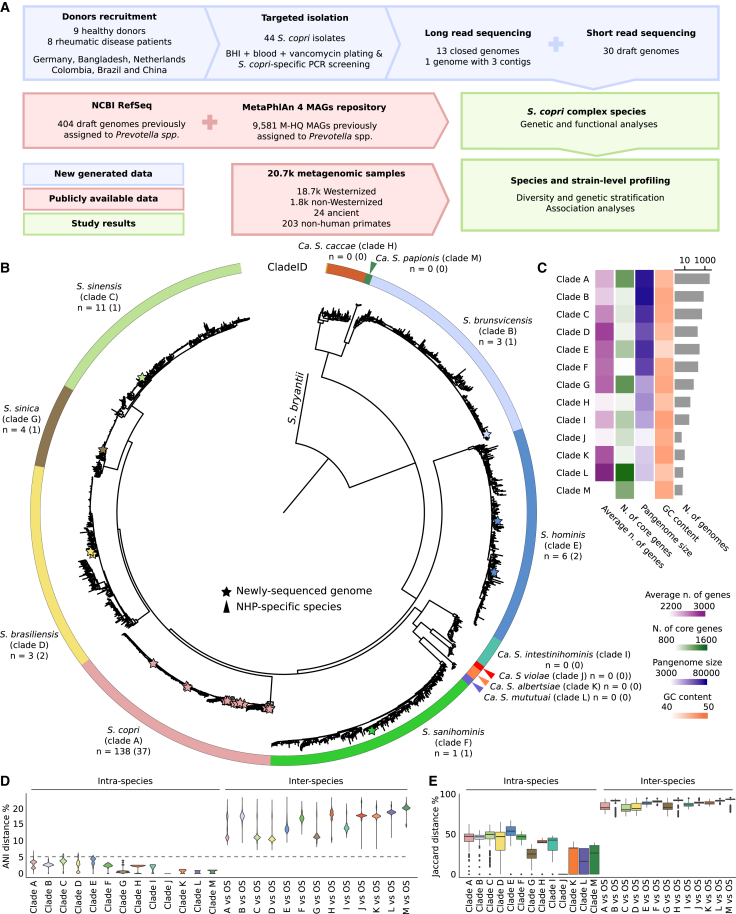
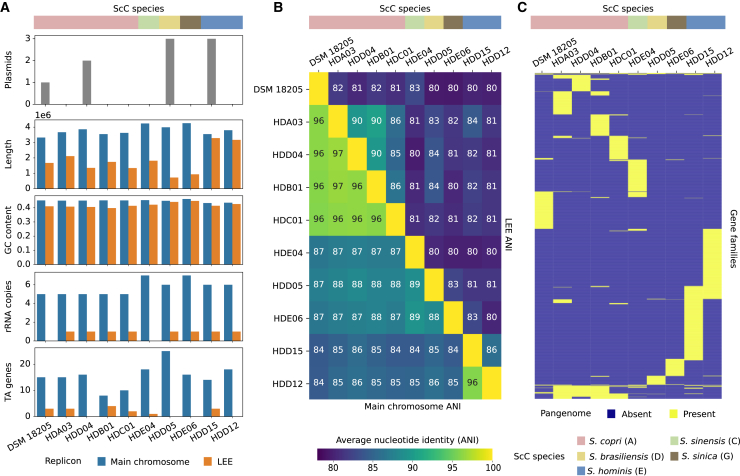
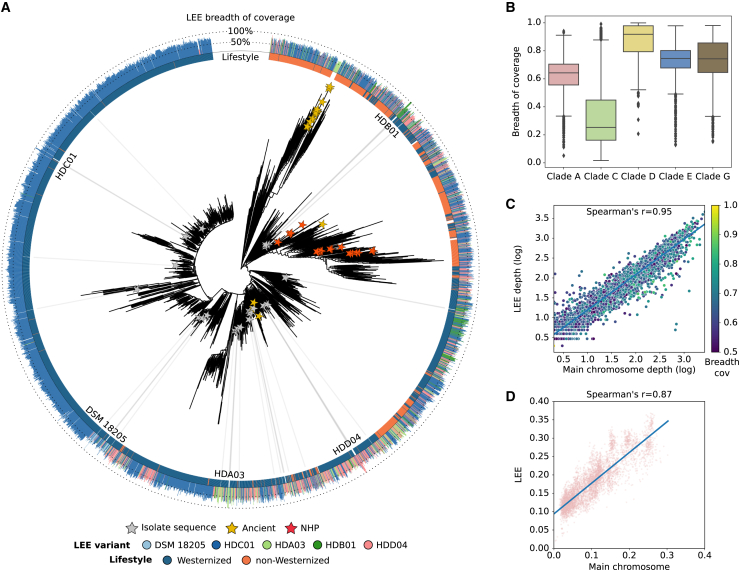
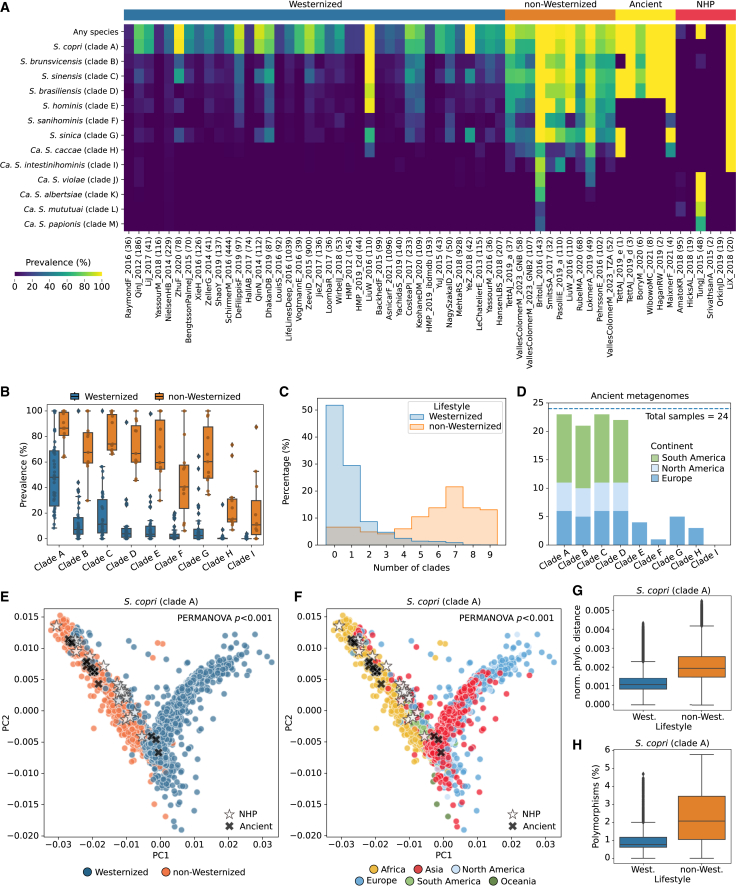
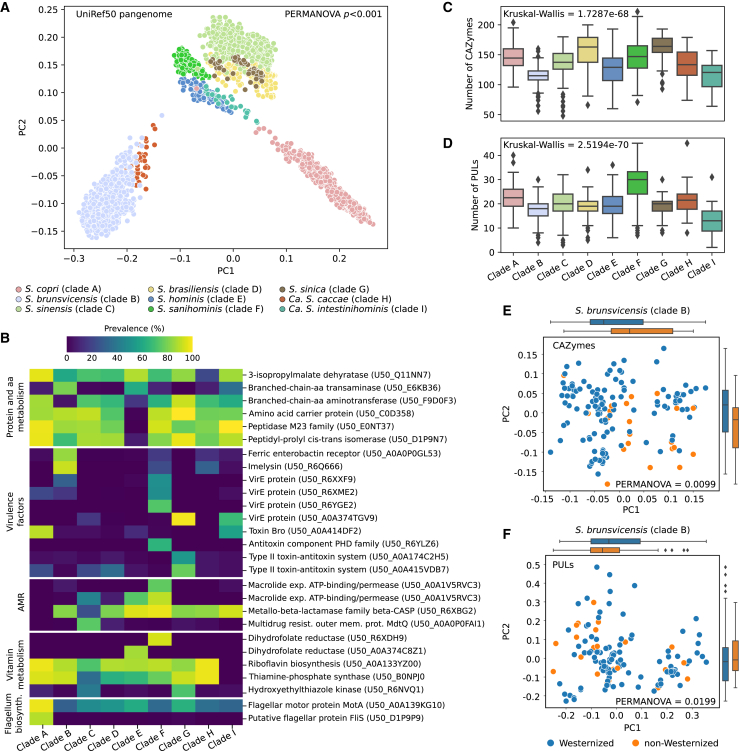
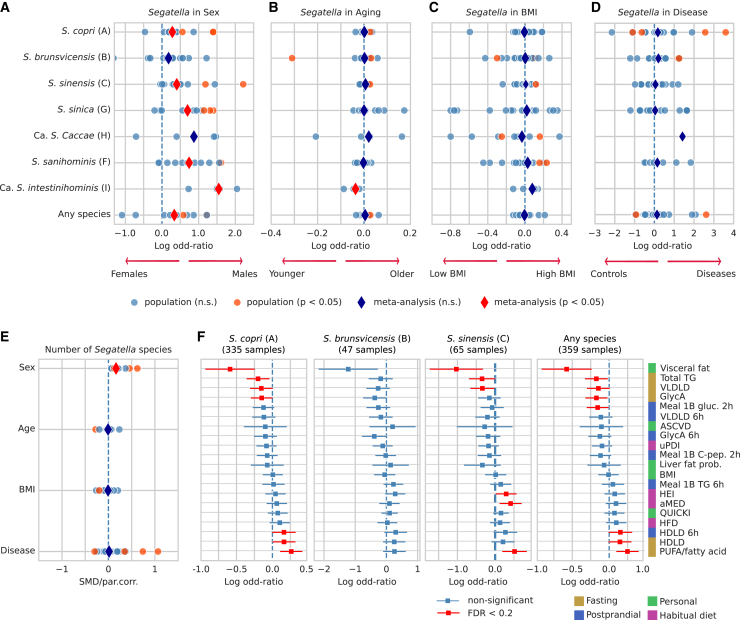
The Segatella copri (formerly Prevotella copri) complex (ScC) comprises taxa that are key members of the human gut microbiome. It was previously described to contain four distinct phylogenetic clades. Combining targeted isolation with large-scale metagenomic analysis, we defined 13 distinct Segatella copri-related species, expanding the ScC complex beyond four clades. Complete genome reconstruction of thirteen strains from seven species unveiled the presence of genetically diverse large circular extrachromosomal elements. These elements are consistently present in most ScC species, contributing to intra- and inter-species diversities. The nine species-level clades present in humans display striking differences in prevalence and intra-species genetic makeup across human populations. Based on a meta-analysis, we found reproducible associations between members of ScC and the male sex and positive correlations with lower visceral fat and favorable markers of cardiometabolic health. Our work uncovers genomic diversity within ScC, facilitating a better characterization of the human microbiome.

Keywords: Prevotella copri; ScC; Segatella copri; bacterial isolation; cardiometabolic health; extrachromosomal element; human microbiome; metagenomics.


Conflict of interest statement

Declaration of interests T.D.S. and J.W. are co-founders of ZOE Ltd. (ZOE). S.E.B. and T.D.S. receive payments as consultants to ZOE. R.D. is employed by ZOE. J.W., R.D., S.E.B., and T.D.S. receive options in ZOE.

Figures

None
Graphical abstract
Figure 1
Figure 1
The Segatella copri complex is composed of 13 different species (A) Overall description of the data and analyses of this work. (B) Phylogenetic tree spanning the 13 ScC species. Isolate genomes were integrated with MAGs. For each species, a maximum of 200 randomly selected genomes are shown. The tree highlights the well-defined taxonomic species based on inter-species vs. intra-species diversity. The n indicates the number of isolate genomes; the number of genomes sequenced in this work is reported in parenthesis. NHP, non-human primate. (C) Genome characteristics for the ScC species by integrating available isolate genomes with reconstructed MAGs. (D) Genetic distances within (intra-species) and between (inter-species) the ScC species, shown as pairwise average nucleotide identity distances (ANI distances). (E) Jaccard distance based on pairwise gene content (UniRef90 families) within (intra-species) and between (inter-species) the ScC species. OS, other species. Boxplots in (E) show the median (center), 25th/75th percentile (lower/upper hinges), 1.5× interquartile range (whiskers), and outliers (points). See also Figure S1 and Table S1.
Figure 2
Figure 2
Most ScC species harbor a large extrachromosomal element (A) Number of plasmids and variability of the main chromosome and LEE genomic characteristics between the different isolates. Main chromosome lengths are represented in terms of million (1e6) pair-bases, whereas LEE lengths are in terms of hundred thousand (1e5) pair-bases. TA, toxin-antitoxin system. (B) Average nucleotide identity (ANI) between the main chromosome (top-right triangle) and LEE (bottom-left triangle). (C) Pangenome presence/absence matrix of the different LEE from the 10 ScC genomes shows a highly diverse gene content between variants. Gene families are defined at 80% genomic identity. See also Table S1.
Figure 3
Figure 3
LEEs are highly prevalent and diversifies with the main chromosome (A) Phylogenetic reconstruction of S. copri (clade A). The length of the external bar plots represents the breadth of coverage of LEE in the sample. NHP, non-human primate. (B) Breadth of coverage of LEE when the depth of coverage of the main chromosome is above 1×. (C) Spearman correlation between the depth of coverage of the main chromosome (x axis) and LEE (y axis) of S. copri (clade A), when the depth of coverage of the main chromosome is above 2× and the breadth of coverage of LEE is above 50% (Spearman’s r = 0.95). The color gradient represents the breadth of coverage of LEE. (D) Spearman correlation of the single-nucleotide polymorphisms (SNPs) rates between the main chromosome (x axis) and LEE (y axis) of S. copri (clade A), when the breadth of coverage of LEE is above 80% (Spearman’s r = 0.87). SNP rates of the main chromosome were calculated using the multiple-sequence alignment (MSA) of the StrainPhlAn marker genes and those from LEE using the MSA of the full LEE alignment. Boxplots in (B) show the median (center), 25th/75th percentile (lower/upper hinges), 1.5× interquartile range (whiskers), and outliers (points). See also Figures S2–S5.
Figure 4
Figure 4
Diversity and genetic stratification of the ScC species (A) Prevalence of the ScC species across Westernized and non-Westernized populations, ancient samples, and non-human primates (NHPs). Number of samples per dataset are reported between parentheses. (B) Percentage of Westernized and non-Westernized samples containing multiple ScC species. (C) The prevalence of the ScC species differs between Westernized and non-Westernized populations. Only stool samples from studies with at least 30 samples were assessed. (D) Per sample prevalence of the ScC species in ancient metagenomes. The horizontal dashed line represents the total number of samples assessed. (E and F) Multidimensional scaling (MDS) based on the pairwise SNP rates on the StrainPhlAn species-specific marker genes for S. copri (clade A) colored by (E) lifestyle (PERMANOVA p < 0.001) and (F) continent (PERMANOVA p < 0.001). (G) Differences in the intra-lifestyle phylogenetic distances comparison for S. copri (clade A) (Mann-Whitney U test p < 1e−10). Pairwise phylogenetic distances were calculated using the StrainPhlAn tree branch lengths normalized by the total branch length. (H) Differences in the polymorphisms found between Westernized and non-Westernized samples for S. copri (clade A) (Mann-Whitney U test p < 1e−10). Polymorphisms were calculated using the StrainPhlAn consensus marker genes and were defined as positions in the reconstructed markers with a dominant allele frequency below 80%. Boxplots in (B), (G), and (H) show the median (center), 25th/75th percentile (lower/upper hinges), 1.5× interquartile range (whiskers), and outliers (points). See also Figures S3 and S6–S9.
Figure 5
Figure 5
Functional characterization of the human ScC species (A) PCoA based on the Jaccard distances of the UniRef50 families (PERMANOVA p < 0.001). (B) Prevalence (%) of selected UniRef50 families (except carbohydrate-metabolism-related families) depleted and enriched in the ScC species. All UniRef50 families shown were significantly enriched/depleted in one species compared with all other species separately (as defined by coupled Fisher’s exact tests between each pair of species, false discovery rate [FDR] < 0.01). (C) Prediction of total carbohydrate-active enzymes (CAZymes) in the different ScC species. (Kruskal-Wallis p = 1.7287e−68.). (D) Prediction of total PULs in the different ScC species (Kruskal-Wallis p = 2.5194e−70). (E) PCoA based on the Jaccard distances of the predicted CAZymes between S. brunsvicensis (clade B) MAGs reconstructed from Westernized or non-Westernized individuals (PERMANOVA p = 0.0099). (F) PCoA based on the Jaccard distances of the predicted PULs between S. brunsvicensis (clade B) MAGs reconstructed from Westernized or non-Westernized individuals (PERMANOVA p = 0.0199). Boxplots in (C) and (D) show the median (center), 25th/75th percentile (lower/upper hinges), 1.5× interquartile range (whiskers) and outliers (points). See also Figures S10 and S11 and Table S2.
Figure 6
Figure 6
Association analysis of the ScC species with sex, age, BMI, diseases and cardiometabolic health (A–D) Condensed forest plots for the association of S. copri (clade A), S. brunsvicensis (clade B), S. sinensis (clade C), S. sinica (clade G), Ca. S. caccae (clade H), S. sanihominis (clade F), and Ca. S. intestinihominis (clade I) or any of the species with sex, aging, BMI, and health-related conditions, using four sets of 14 studies (2,420 healthy females and 1,675 healthy males), 11 studies (3,190 healthy individuals), 24 studies (4,783 healthy individuals), and 22 studies (12 diseases, 1,635 cases, and 1,854 controls). Blue and red dots represent, respectively, non-significant and significant associations of the variable of interest in each dataset, obtained through a logistic regression model having the presence/absence of ScC species as response variable and sex, age, BMI, and depth as predictors and sex, age, BMI, depth, and health status in the disease one. Dark-blue and red diamonds represent, respectively, non-significant and significant random-effects meta-analysis coefficients used to summarize the single-dataset coefficients. (E) Condensed forest plot showing Spearman’s partial correlation of sex, age, BMI, and health status with the number of ScC species. Each correlation is adjusted by each of the variables plus depth. Dark-blue and red diamonds represent the coefficient of a random-effect meta-analysis of the Fisher Z-transformed correlations (for aging and BMI) or standardized mean differences (for sex and the diseases). (F) Plot showing the associations of S. copri (clade A), S. brunsvicensis (clade B), S. sinensis (clade C), or any of the species, with 19 cardiometabolic health parameters in 1,098 participants from the ZOE PREDICT 1 cohort. Each marker represents the coefficient of a logistic regression predicting ScC species presence/absence using sex, age, BMI, depth, and the corresponding cardiometabolic parameter, with its 95% confidence intervals. Wald-ps are colored according to an FDR correction using 0.2 as significance threshold. See also Table S3.

References

    1. Lozupone C.A., Stombaugh J.I., Gordon J.I., Jansson J.K., Knight R. Diversity, stability and resilience of the human gut microbiota. Nature. 2012;489:220–230. - PMC - PubMed
    1. Yatsunenko T., Rey F.E., Manary M.J., Trehan I., Dominguez-Bello M.G., Contreras M., Magris M., Hidalgo G., Baldassano R.N., Anokhin A.P., et al. Human gut microbiome viewed across age and geography. Nature. 2012;486:222–227. - PMC - PubMed
    1. Blanco-Míguez A., Beghini F., Cumbo F., McIver L.J., Thompson K.N., Zolfo M., Manghi P., Dubois L., Huang K.D., Thomas A.M., et al. Extending and improving metagenomic taxonomic profiling with uncharacterized species using MetaPhlAn 4. Nat. Biotechnol. 2023;4 doi: 10.1038/s41587-023-01688-w. - DOI - PMC - PubMed
    1. Human Microbiome Project Consortium Structure, function and diversity of the healthy human microbiome. Nature. 2012;486:207–214. - PMC - PubMed
    1. Qin J., Li R., Raes J., Arumugam M., Burgdorf K.S., Manichanh C., Nielsen T., Pons N., Levenez F., Yamada T., et al. A human gut microbial gene catalogue established by metagenomic sequencing. Nature. 2010;464:59–65. - PMC - PubMed

Publication types