. 2023 Nov 8;31(11):1898-1909.e3.
doi: 10.1016/j.chom.2023.09.012. Epub 2023 Oct 25.

An atlas of continuous adaptive evolution in endemic human viruses

Affiliations

An atlas of continuous adaptive evolution in endemic human viruses

Kathryn E Kistler et al. Cell Host Microbe. .

Abstract

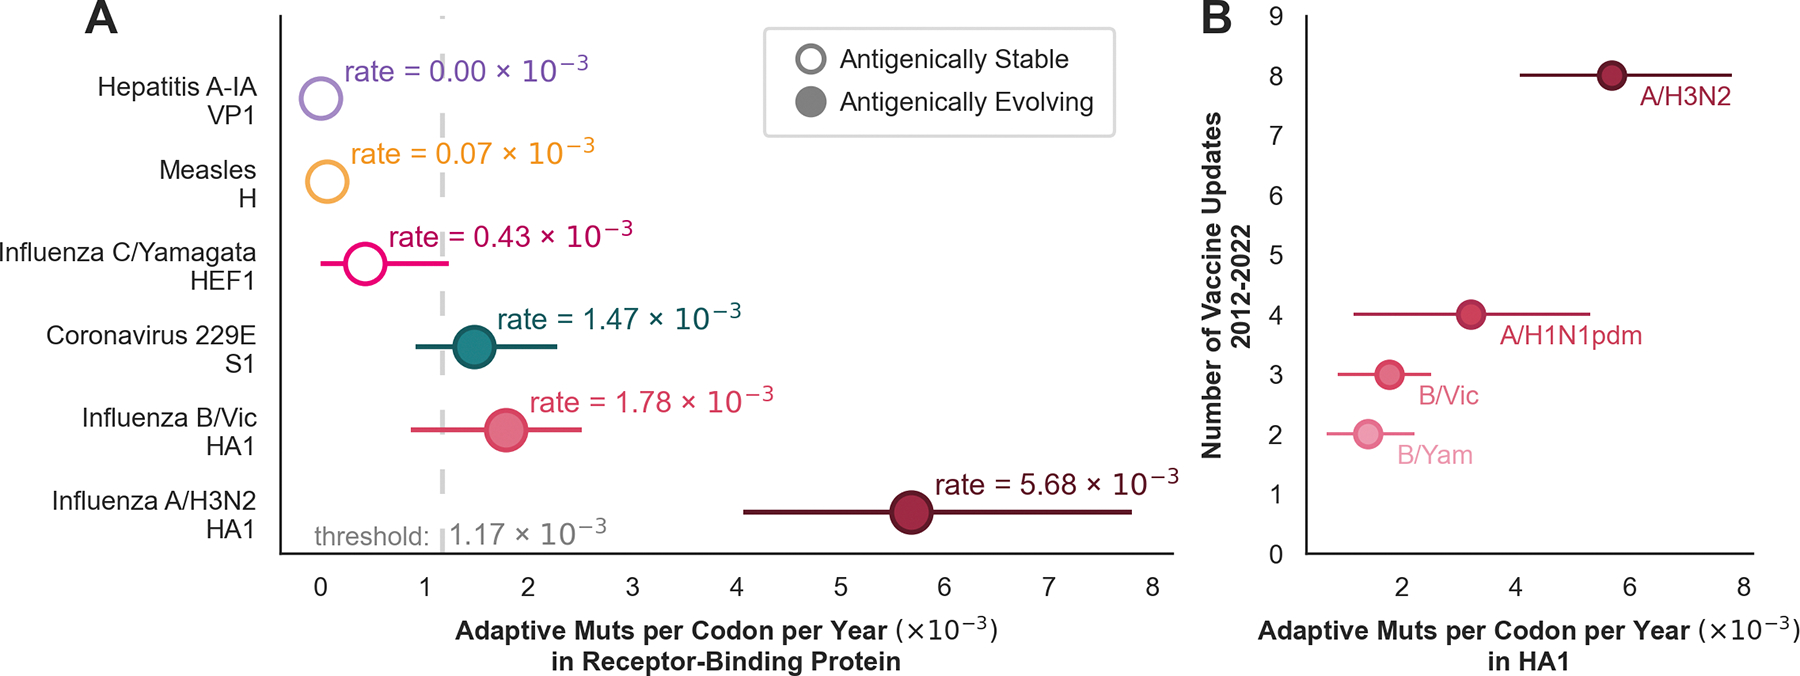
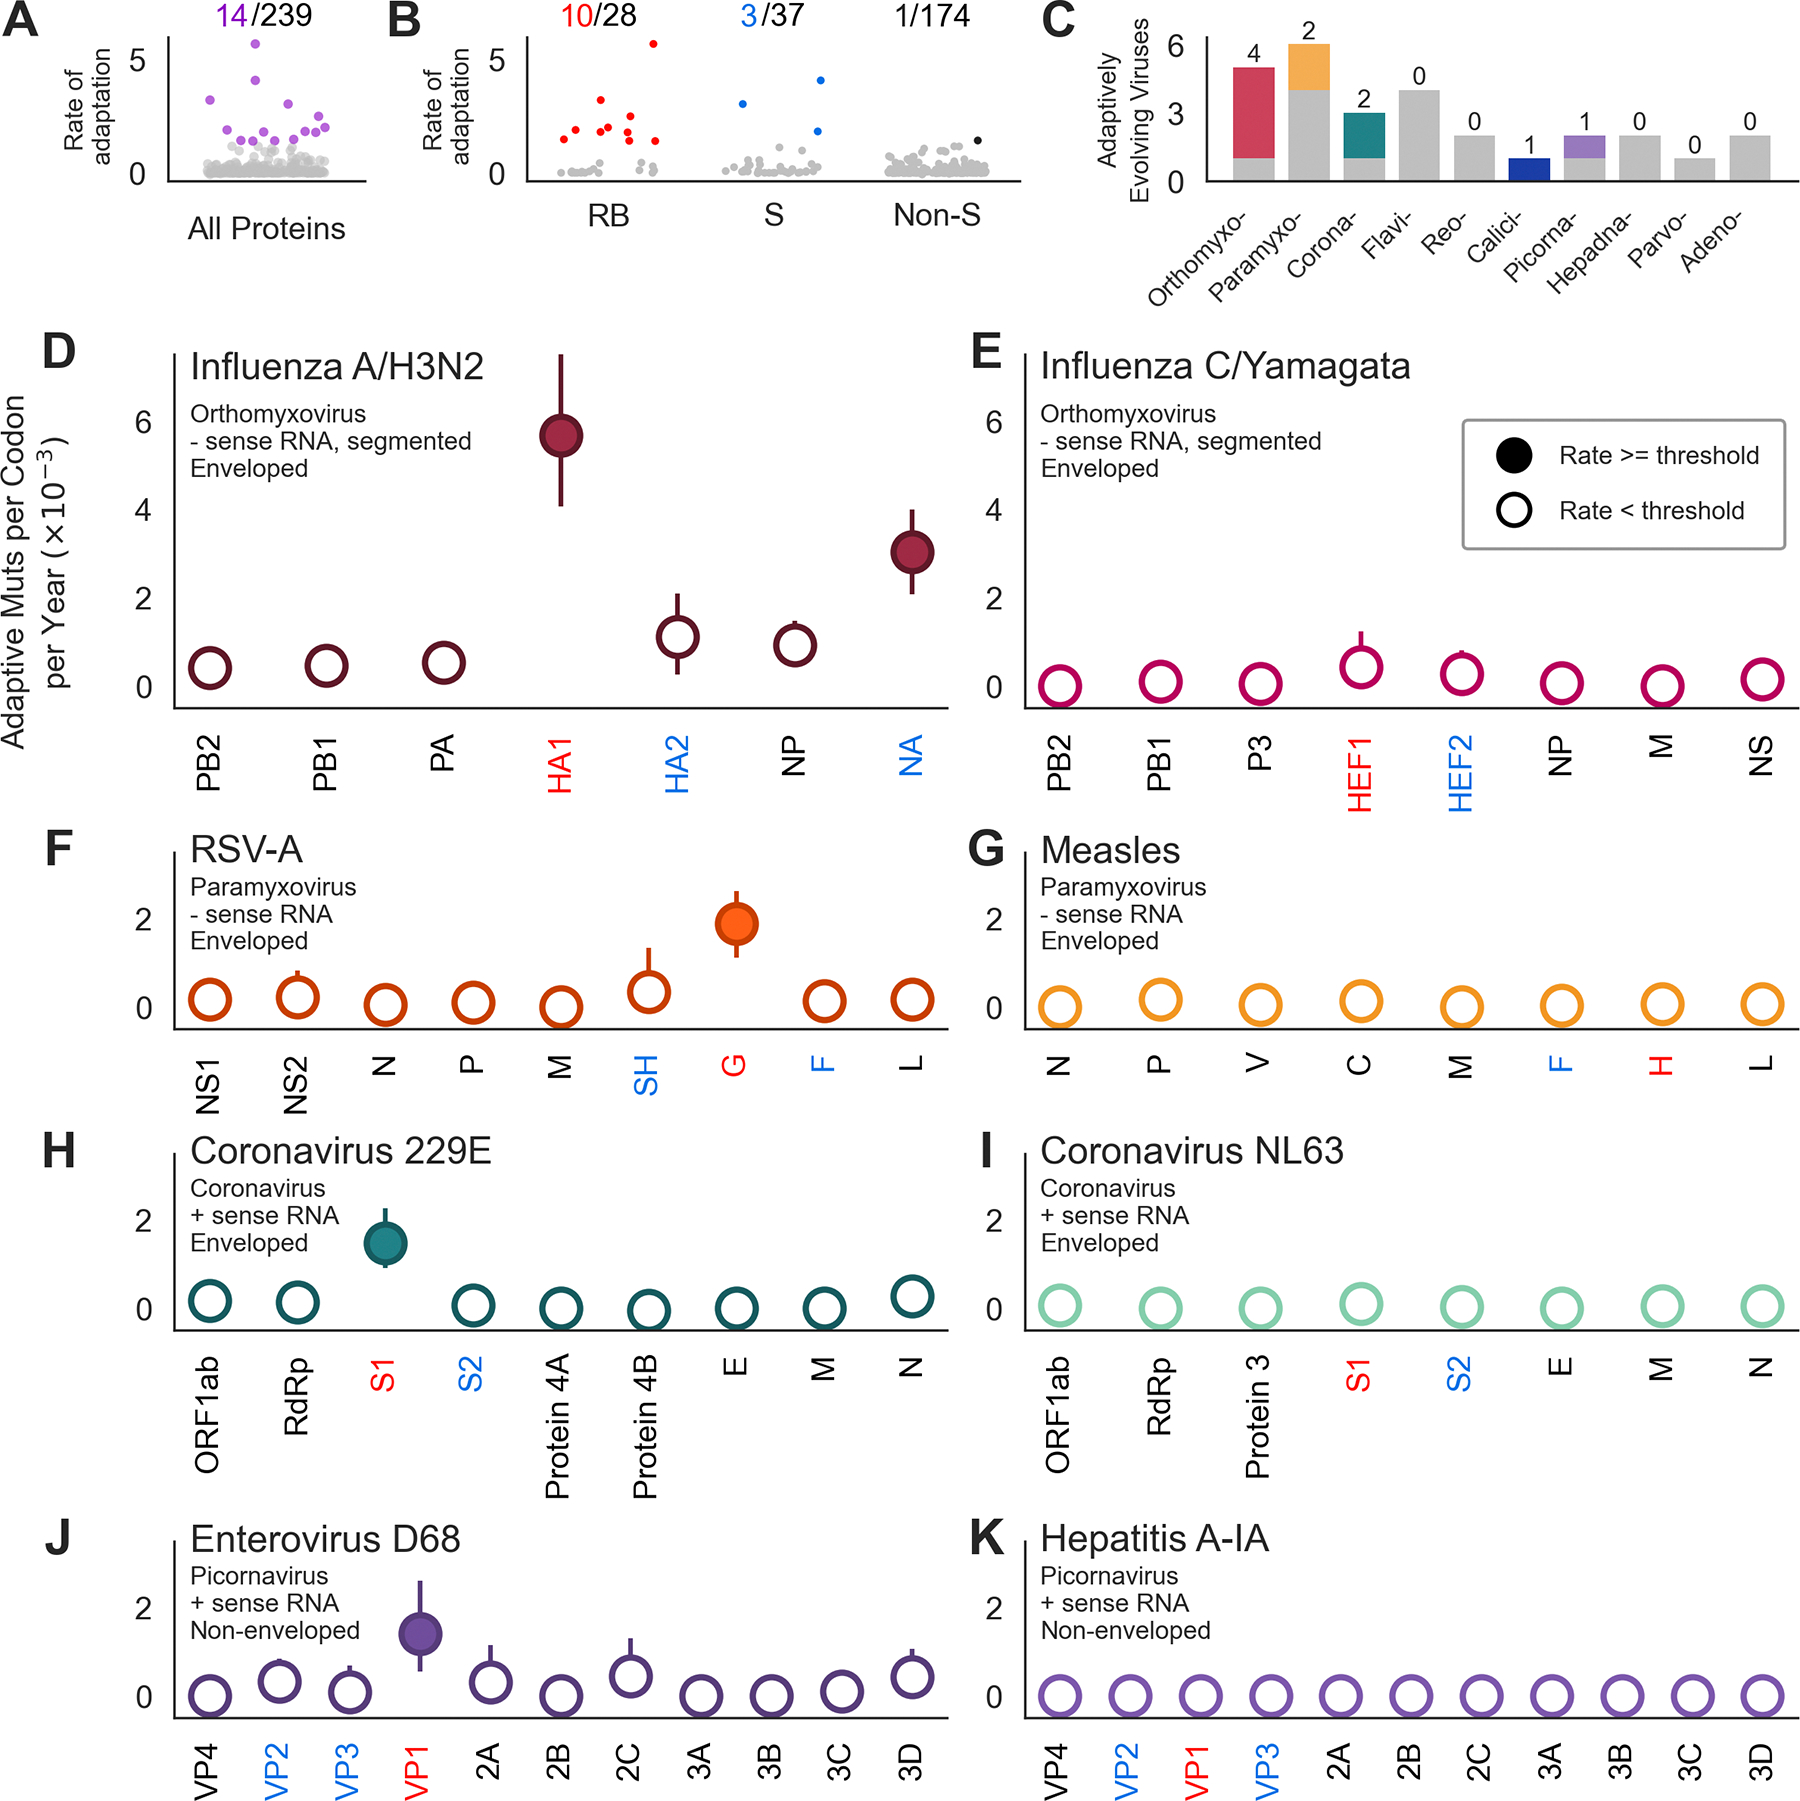
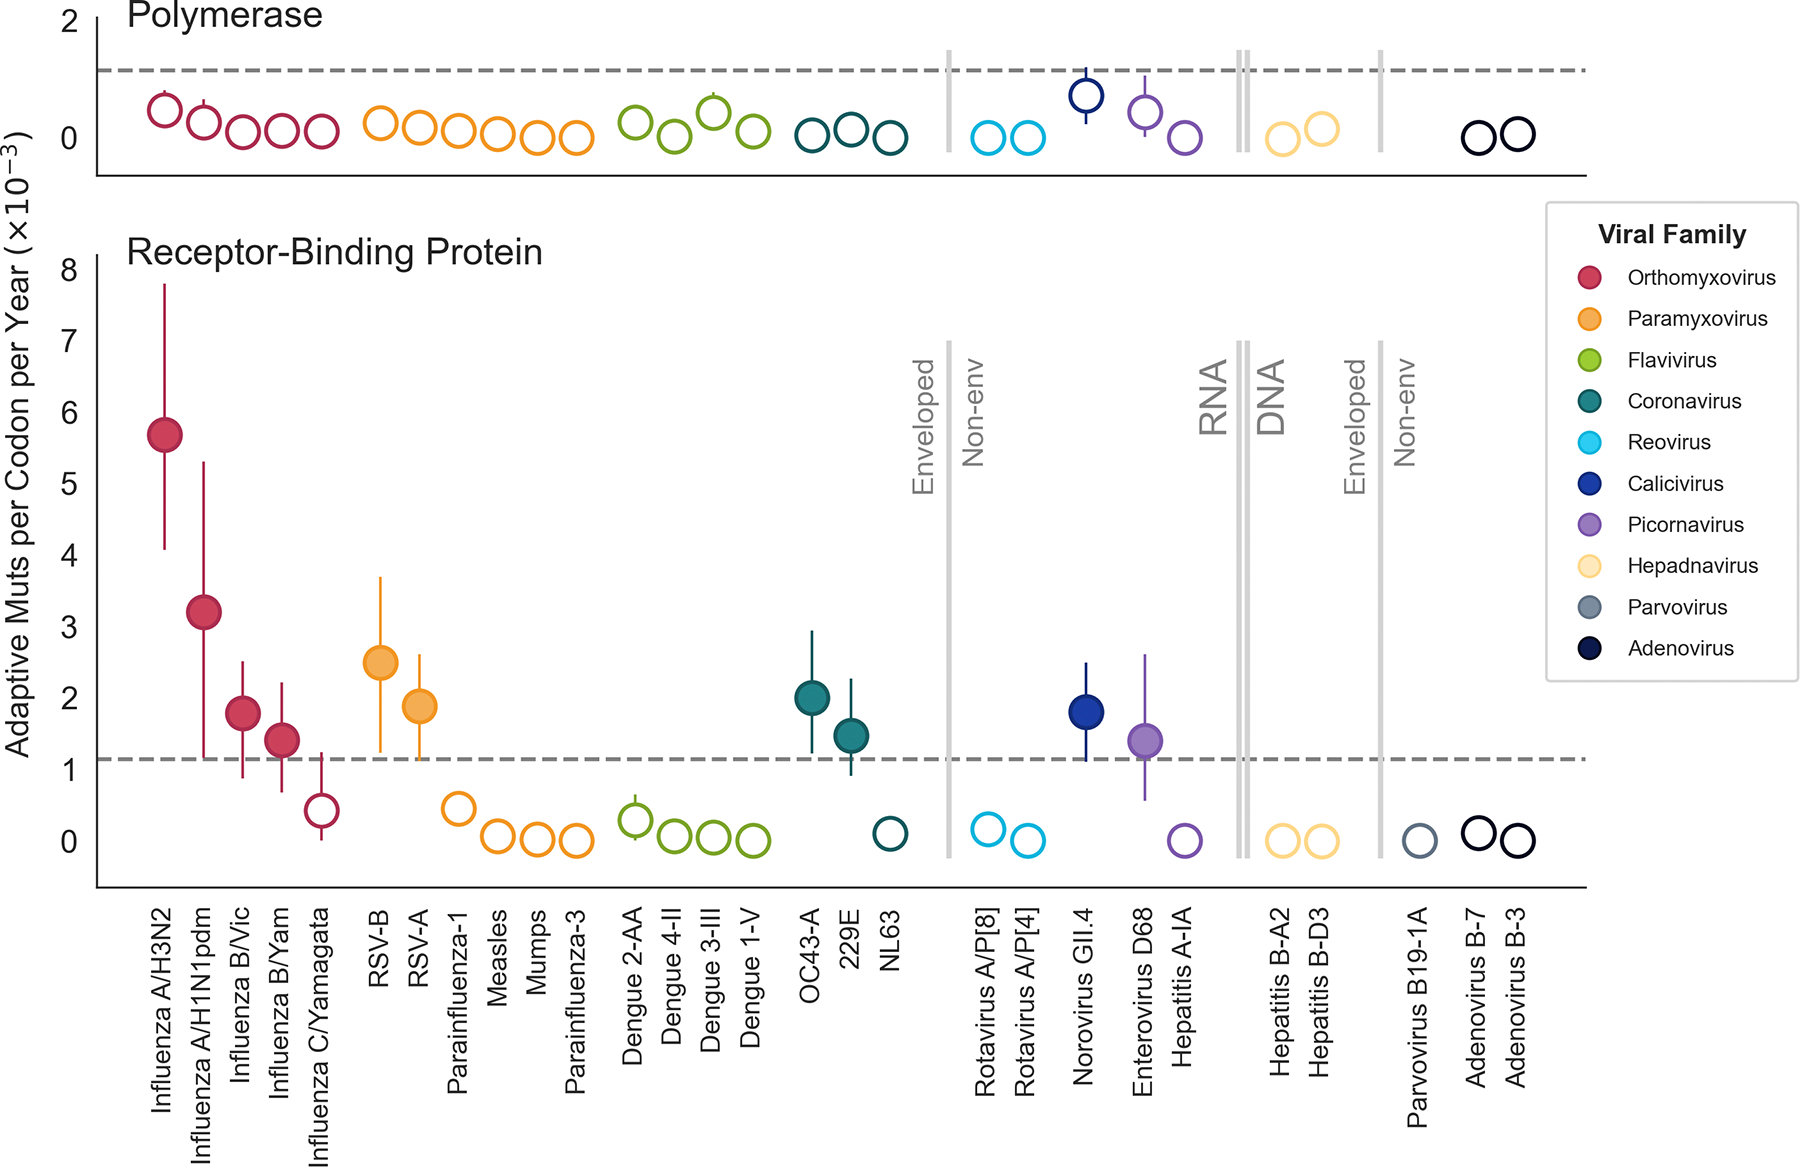
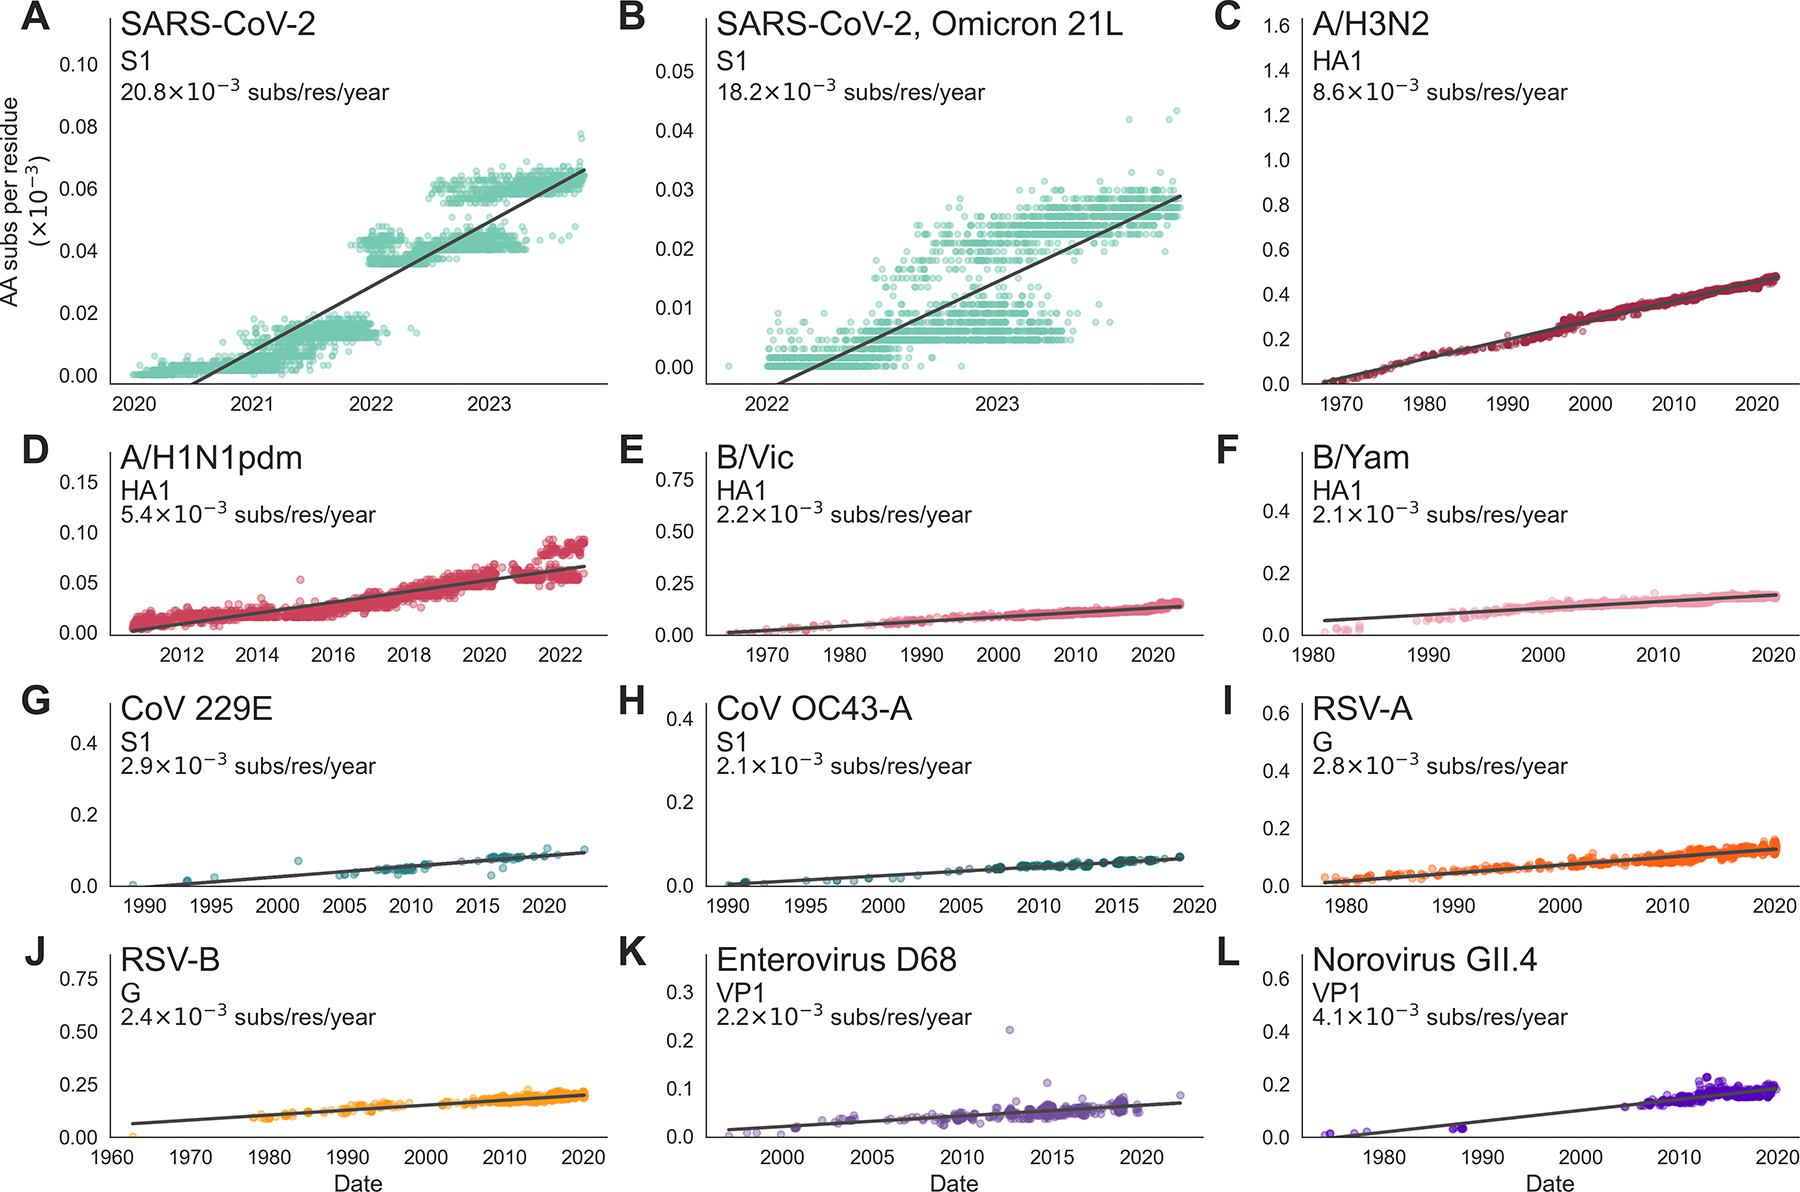
Through antigenic evolution, viruses such as seasonal influenza evade recognition by neutralizing antibodies. This means that a person with antibodies well tuned to an initial infection will not be protected against the same virus years later and that vaccine-mediated protection will decay. To expand our understanding of which endemic human viruses evolve in this fashion, we assess adaptive evolution across the genome of 28 endemic viruses spanning a wide range of viral families and transmission modes. Surface proteins consistently show the highest rates of adaptation, and ten viruses in this panel are estimated to undergo antigenic evolution to selectively fix mutations that enable the escape of prior immunity. Thus, antibody evasion is not an uncommon evolutionary strategy among human viruses, and monitoring this evolution will inform future vaccine efforts. Additionally, by comparing overall amino acid substitution rates, we show that SARS-CoV-2 is accumulating protein-coding changes at substantially faster rates than endemic viruses.

Keywords: adaptive evolution; antigenic evolution; endemic viruses; evolutionary biology; viral evolution.


Conflict of interest statement

Declaration of interests The authors declare no competing interests.

Figures

Figure 1:
Figure 1:. A McDonald-Kreitman-based method to estimate the rate of adaptation in antigenically-evolving viruses.
A) Time-resolved phylogeny of 2104 influenza A/H3N2 HA sequences sampled between 1968 and 2022 and colored by nonsynonymous mutation accumulation from the root, with darker reds symbolizing more mutations in the HA1 subunit. Within these samples, ninety-two nucleotide sites have completely fixed a nonsynonymous mutation, and the pie chart indicates that 12 of these nucleotide sites have fixed multiple nonsynonymous mutations during the past ~50 years. B) Accumulation of adaptive mutations (per codon) in polymerase PB1 as calculated by the McDonald-Kreitman-based method that updates the outgroup sequence at each fixation (dark red), or uses a constant outgroup sequence (gray). The rate of adaptation is the slope of the linear regression fitting these estimates. C) Estimated accumulation of adaptive mutations in HA1. D) Time-resolved phylogeny of 95 coronavirus 229E Spike S1 sequences sampled between 1989 and 2022, colored as in panel A. Pie chart indicates that, within these samples, nine nucleotide sites have completely fixed a nonsynonymous mutation and zero nucleotide sites have fixed multiple nonsynonymous mutations. Accumulation of adaptive mutations, as in panels B and C, within the coronavirus 229E E) polymerase (RdRp) and F) receptor-binding subunit S1.
Figure 2:
Figure 2:. Rates of adaptation in the receptor-binding protein recapitulate known trends of antigenic evolution.
A) The rate of adaptation calculated in the receptor-binding protein is plotted for 3 antigenically-stable viruses (solid circles), and 3 antigenically-evolving viruses (open circles). The threshold of antigenic evolution is estimated by logistic regression. Error bars represent the 95% bootstrap percentiles. B) For each of the 4 influenza viruses that are included in the yearly flu vaccine, the rate of adaptation is compared with the number of times that the vaccine strain was updated between the 2012–2013 and 2022–2023 Northern hemisphere flu seasons.
Figure 3:
Figure 3:. Across 28 viral genomes, the highest rates of adaptation are found in surface-located receptor-binding proteins.
A) The rate of adaptation for all 239 viral genes. Fourteen genes (in purple) have rates of adaptation above our threshold of antigenic evolution. Genes with rates of adaptation below the threshold are in gray. B) The rate of adaptation within all 28 receptor-binding proteins (RB, left), 37 other proteins located on the viral surface (S, center), and 174 non-surface proteins (Non-S, right). Ten receptor-binding proteins (red), 3 other surface-located proteins (blue) and 1 non-surface protein (black) exceed our threshold. Genes with rates below the threshold are in gray. C) Number of viruses per viral family that have at least one gene exceeding the threshold are shown in color. The number of viruses in these families that had no high rates of adaptation throughout their entire genome is in gray. D-K) Rates of adaptation were calculated for each gene, subunit, or coding region indicated along the x-axis, and ordered by genomic position (or segment number, for segmented viruses). Receptor-binding proteins are labeled in red, other surface-exposed proteins are in blue, and non-surface-located proteins are in black. Filled circles indicate genes with rates exceeding the threshold. Each row shows two viruses from the same viral family, one which contains at least one adaptively-evolving gene (left) and one which does not (right). Error bars indicate the 95% bootstrap percentiles from 100 bootstrapped data sets.
Figure 4:
Figure 4:. Comparison of rates of predicted antigenic evolution across a wide diversity of human pathogenic viruses.
Rates of adaptive evolution in the polymerase (top) and receptor-binding protein (bottom) for 28 human pathogenic viruses. The receptor-binding and polymerase genes for each virus are listed in the Methods section. The threshold of antigenic evolution (as determined in Figure 2) is marked by the dotted line; the rates falling above this line are shown by solid markers, and the rates below the threshold are open circles. Viruses are grouped and colored by viral family, and arranged within viral family in descending order of the receptor-binding rate. Viral families are ordered by genome type, with RNA viruses shown in brighter colors and DNA viruses in gray tones. Vertical dividers further delineate enveloped from non-enveloped viruses.
Figure 5:
Figure 5:. Rates of amino acid substitution in the receptor-binding protein of SARS-CoV-2 and 10 antigenically-evolving endemic viruses.
The rate of amino acid substitution in the receptor-binding protein of A) SARS-CoV-2, B) SARS-CoV-2 Omicron clade 21L, C) influenza A/H3N2, D) influenza A/H1N1pdm, E) influenza B/Vic, F) influenza B/Yam, G) coronavirus 229E, H) coronavirus OC43-A, I) RSV-A, J) RSV-B, K) enterovirus D68, L) norovirus GII.4. The receptor-binding protein, or subunit is labeled below the virus name. Rates are computed as the slope of a linear regression fitting a comparison of amino acid substitutions versus time, and are found using a phylogeny. Each tip on the tree is plotted by its sampling date and the number of amino acid substitutions that accumulated between the root and the tip (normalized by the length of the coding region, in residues). Aspect ratios in each panel are fixed so that regression slopes are visually comparable across panels.
Figure 6.
Figure 6.. Comparison of rates of amino acid substitution to rates of adaptation
(A) The rate of amino acid substitution (×10−3) and rate of adaptive evolution (×10−3) is listed for each of the 28 viruses in the panel. (B) Rate of amino acid substitution is plotted against rate of adaptive evolution for each virus, with color corresponding to the panel A. The dashed gray line is drawn at X = Y to indicate the point where all amino acid substitutions are inferred to be adaptive.

Similar articles

Cited by

References

    1. Meyer AG, Spielman SJ, Bedford T, and Wilke CO (2015). Time dependence of evolutionary metrics during the 2009 pandemic influenza virus outbreak. Virus Evol 1. 10.1093/ve/vev006. - DOI - PMC - PubMed
    1. Su YCF, Bahl J, Joseph U, Butt KM, Peck HA, Koay ESC, Oon LLE, Barr IG, Vijaykrishna D, and Smith GJD (2015). Phylodynamics of H1N1/2009 influenza reveals the transition from host adaptation to immune-driven selection. Nat. Commun. 6, 1–13. 10.1038/ncomms8952. - DOI - PMC - PubMed
    1. Kistler KE, Huddleston J, and Bedford T (2022). Rapid and parallel adaptive mutations in spike S1 drive clade success in SARS-CoV-2. Cell Host Microbe 30, 545–555.e4. 10.1016/j.chom.2022.03.018. - DOI - PMC - PubMed
    1. Tao K, Tzou PL, Nouhin J, Gupta RK, de Oliveira T, Kosakovsky Pond SL, Fera D, and Shafer RW (2021). The biological and clinical significance of emerging SARS-CoV-2 variants. Nat. Rev. Genet. 22, 757–773. 10.1038/s41576-021-00408-x. - DOI - PMC - PubMed
    1. Smith DJ, Lapedes AS, de Jong JC, Bestebroer TM, Rimmelzwaan GF, Osterhaus ADME, and Fouchier RAM (2004). Mapping the antigenic and genetic evolution of influenza virus. Science 305, 371–376. 10.1126/science.1097211. - DOI - PubMed

Substances

LinkOut - more resources