. 2023 Nov 9;62(5):2201606.
doi: 10.1183/13993003.01606-2022. Print 2023 Nov.

Fibroblast growth factor 10 reverses cigarette smoke- and elastase-induced emphysema and pulmonary hypertension in mice

Affiliations

Fibroblast growth factor 10 reverses cigarette smoke- and elastase-induced emphysema and pulmonary hypertension in mice

Stefan Hadzic et al. Eur Respir J. .

Abstract

Background: COPD is an incurable disease and a leading cause of death worldwide. In mice, fibroblast growth factor (FGF)10 is essential for lung morphogenesis, and in humans, polymorphisms in the human FGF10 gene correlate with an increased susceptibility to develop COPD.

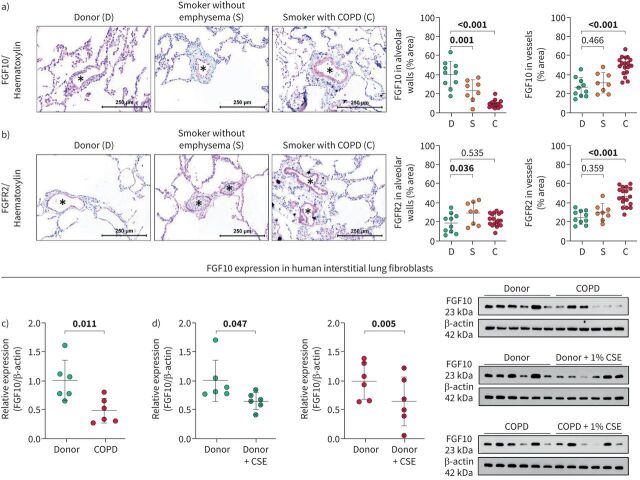
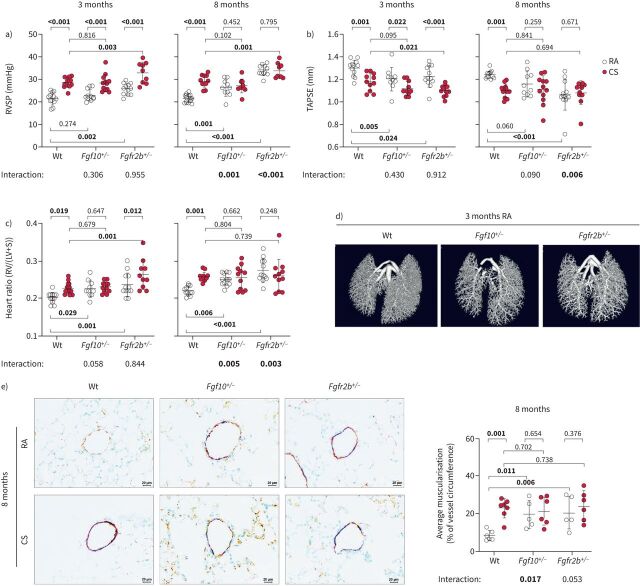
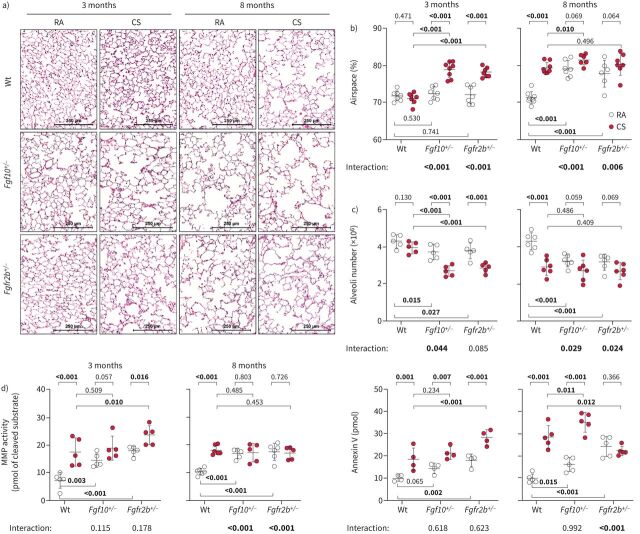
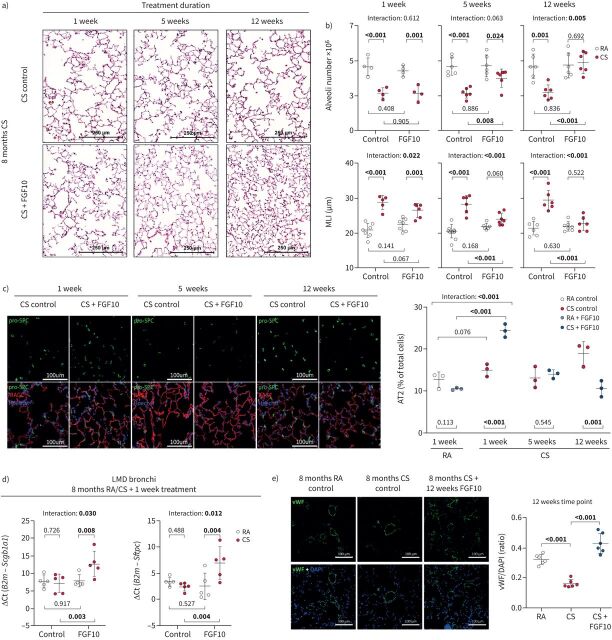
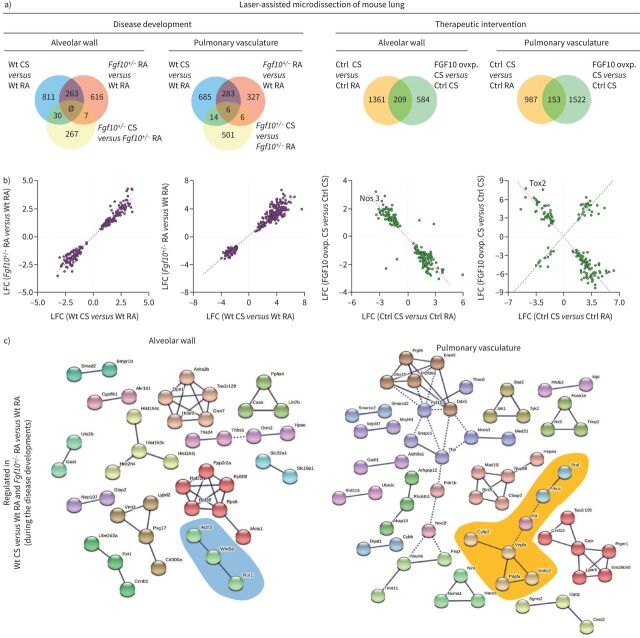
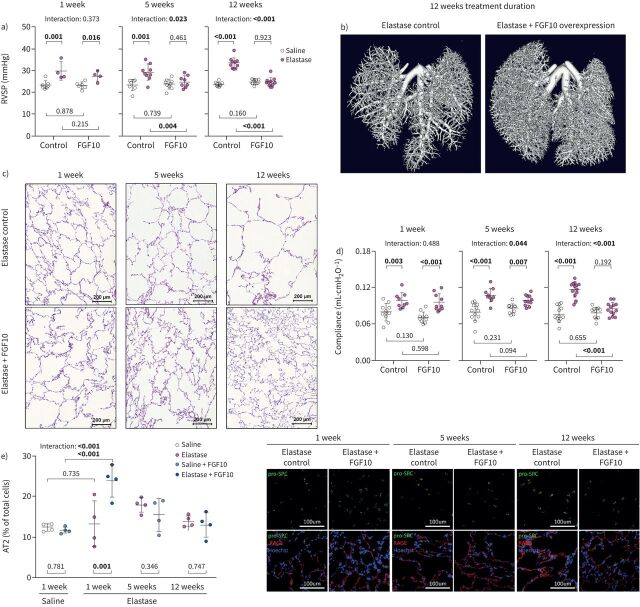
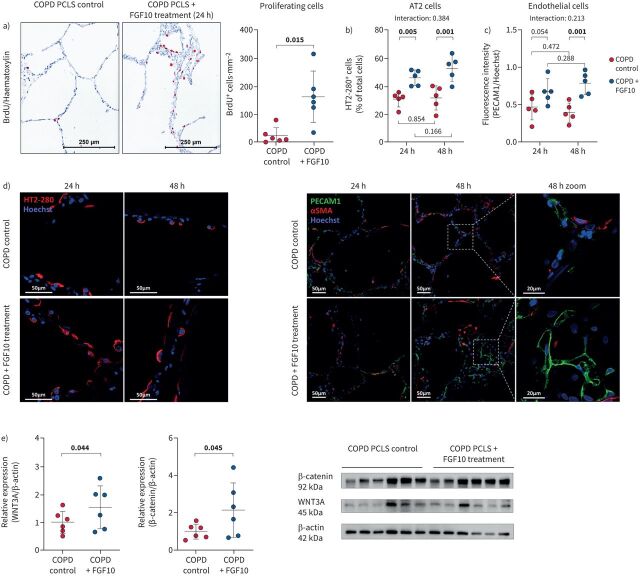
Methods: We analysed FGF10 signalling in human lung sections and isolated cells from healthy donor, smoker and COPD lungs. The development of emphysema and PH was investigated in Fgf10+/- and Fgfr2b+/- (FGF receptor 2b) mice upon chronic exposure to cigarette smoke. In addition, we overexpressed FGF10 in mice following elastase- or cigarette smoke-induced emphysema and pulmonary hypertension (PH).

Results: We found impaired FGF10 expression in human lung alveolar walls and in primary interstitial COPD lung fibroblasts. In contrast, FGF10 expression was increased in large pulmonary vessels in COPD lungs. Consequently, we identified impaired FGF10 signalling in alveolar walls as an integral part of the pathomechanism that leads to emphysema and PH development: mice with impaired FGF10 signalling (Fgf10+/- and Fgfr2b+/- ) spontaneously developed lung emphysema, PH and other typical pathomechanistic features that generally arise in response to cigarette smoke exposure.

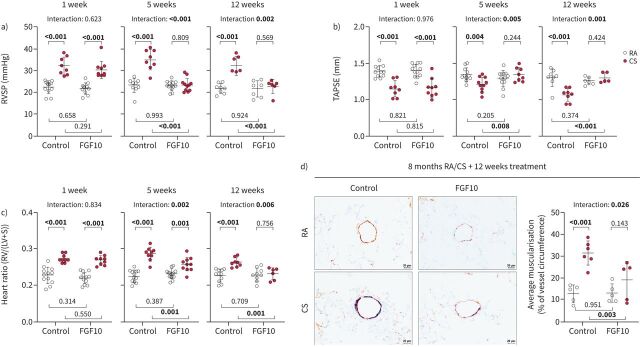
Conclusion: In a therapeutic approach, FGF10 overexpression successfully restored lung alveolar and vascular structure in mice with established cigarette smoke- and elastase-induced emphysema and PH. FGF10 treatment triggered an initial increase in the number of alveolar type 2 cells that gradually returned to the basal level when the FGF10-mediated repair process progressed. Therefore, the application of recombinant FGF10 or stimulation of the downstream signalling cascade might represent a novel therapeutic strategy in the future.


Conflict of interest statement

Conflict of interest: The authors have no potential conflicts of interest to disclose.

Figures

FIGURE 1
FIGURE 1
Fibroblast growth factor (FGF)10 signalling in human donor and COPD lungs. a, b) Representative images and quantification of a) FGF10 and b) FGFR2 staining in human lung sections from healthy donors (D; n=10), smokers without emphysema (S; n=8) and smokers with COPD (C; n=18). Asterisks (*) indicate pulmonary vessels. c, d) FGF10 expression quantified by Western blotting in lung interstitial fibroblasts isolated from c) healthy donor lungs (n=6) and COPD lungs (n=6); d) healthy donor (n=6) and COPD (n=6) lungs in vitro treated with cigarette smoke extract (CSE). Protein expression in Western blot was quantified by band densitometry analysis and standardised to β-actin; relative expression was calculated by standardising each value to the mean value of the corresponding control group. Immunohistochemistry: red: FGF10/FGFR2; blue: haematoxylin. In the quantification panels each dot represents a measurement obtained from an individual COPD or healthy donor. The mean value for each group is represented by a horizontal line (±sd). Statistical analysis: a, b) one-way ANOVA (Dunnett's multiple-to-one comparison); c) unpaired and d) paired t-test; p-value for each comparison is given in the graphs. Bold type represents statistical significance.
FIGURE 2
FIGURE 2
Mice with impaired fibroblast growth factor (FGF)10 signalling spontaneously develop pulmonary hypertension. Pulmonary hypertension assessed by measurement of a) right ventricular systolic pressure (RVSP) (n=9–12) and b) echocardiographic tricuspid annular plane systolic excursion (TAPSE) quantification (n=10–12). c) Right ventricular (RV) hypertrophy quantified by the weight ratio between the RV and left ventricle with septum (LV+S) (n=10–12). No significant changes in LV+S mass were detected between analysed groups. d) Pulmonary vasculature visualised ex vivo by microcomputed tomography in lungs perfused with radio-dense Microfil, representative scans of lungs from wild-type (Wt), Fgf10+/− or Fgfr2b+/− mice exposed to room air (RA) for 3 months. e) Representative images of pulmonary vessels (brown: von Willebrand factor; purple: α-smooth muscle actin; green: nuclei) and quantification of average vessel muscularisation in lungs of experimental animals (n=5–7). Analysis was performed in pulmonary vessels with a diameter of 20–70 µm and results are shown as percentage of vessel circumference positive for α-smooth muscle actin staining. In the quantification panels each dot represents a measurement obtained from one individual experimental animal. The mean value for each group is represented by a horizontal line (±sd). Statistical analysis: two-way ANOVA; p-values for each comparison and interaction are given in the graphs. CS: cigarette smoke. Bold type represents statistical significance.
FIGURE 3
FIGURE 3
Mice with impaired fibroblast growth factor (FGF)10 signalling spontaneously develop pulmonary emphysema. a) Representative images of haematoxylin and eosin-stained lung sections of wild-type (Wt), Fgf10+/− or Fgfr2b+/− mice exposed to cigarette smoke (CS) or room air (RA) for 3 or 8 months. b, c) Pulmonary emphysema was quantified by determination of b) airspace percentage quantified using histological analysis (n=6–8) and c) alveoli number from left lung lobes using design-based stereology (n=5–6). d) In vivo matrix metalloproteinases (MMP) activity (MMPsense probe representing activity of MMP 2, 3, 7, 9, 12 and 13) or apoptosis (Annexin-Vivo probe) assessed using fluorescence molecular tomography imaging in experimental animals (n=4–6). In the quantification panels each dot represents a measurement obtained from one individual experimental animal. The mean value for each group is represented by a horizontal line (±sd). Statistical analysis: a–c) two-way ANOVA; d) paired two-way ANOVA; p-values for each comparison and interaction are given in the graphs. Bold type represents statistical significance.
FIGURE 4
FIGURE 4
Fibroblast growth factor (FGF)10 overexpression reverses cigarette smoke (CS)-induced pulmonary hypertension in mice. a) Right ventricular systolic pressure (RVSP) (n=6–12), b) tricuspid annular plane systolic excursion (TAPSE) (n=5–12) and c) weight ratio of right ventricle (RV) and left ventricle plus septum (LV+S) (n=6–12), measured in CS- or room air (RA)-exposed mice that were subsequently fed with standard feed (control) or feed containing doxycycline (FGF10) for 1, 5 or 12 weeks. No significant changes in LV+S mass were detected between analysed groups. d) Representative images of pulmonary vessels (brown: von Willebrand factor; purple: α-smooth muscle actin; green: nuclei) and quantification of average vessel muscularisation in lungs of experimental animals (n=5–6). Analysis was performed in pulmonary vessels with a diameter of 20–70 µm and results are shown as percentage of vessel circumference positive for α-smooth muscle actin staining. In the quantification panels each dot represents a measurement obtained from one individual experimental animal. The mean value for each group is represented by a horizontal line (±sd). Statistical analysis: two-way ANOVA; p-values for each comparison and interaction are given in the graph. Bold type represents statistical significance.
FIGURE 5
FIGURE 5
Fibroblast growth factor (FGF)10 overexpression reverses cigarette smoke (CS)-induced pulmonary emphysema in mice. a) Representative images of haematoxylin and eosin stained lung sections from the respective experimental groups. b) Pulmonary emphysema was histologically quantified in CS- or room air (RA)-exposed mice that were subsequently fed with standard feed (control) or feed containing doxycycline (FGF10) for 1, 5 or 12 weeks, shown as alveoli number (calculated by design-based stereology, n=4–6) or mean linear intercept (MLI) (n=5–7). c) Immunofluorescence staining for alveolar epithelial type 2 cells (AT2, pro-surfactant protein C (pro-SPC)) and type 1 cells (receptor for advanced glycation end products (RAGE)) in lungs of experimental animals. Quantification shows percentage of AT2 of total lung cells in distal lung parenchyma (n=3). No significant changes in nuclei count were detected between analysed groups. d) mRNA expression of epithelial progenitor markers (secretoglobin family 1A member 1 (Scgb1a1) and surfactant protein C (Sftpc)) in laser microdissected bronchi of experimental mice (n=5). mRNA was quantified using reverse transcriptase quantitative PCR and expression of the gene of interest related to the expression of B2m used as a reference gene. e) Immunofluorescence staining and fluorescence intensity quantification of von Willebrand factor (vWF)/4′,6-diamidino-2-phenylindole (DAPI) in lungs from CS-treated mice with or without doxycycline-induced FGF10 overexpression for 12 weeks (n=6). In the quantification panels each dot represents a measurement obtained from one individual experimental animal. The mean value for each group is represented by a horizontal line (±sd). Statistical analysis: two-way ANOVA; p-values for each comparison and interaction are given in the graphs. Bold type represents statistical significance.
FIGURE 6
FIGURE 6
Cigarette smoke (CS)- and fibroblast growth factor (FGF)10-related molecular pathways involved in the development or reversion of emphysema and pulmonary hypertension. a) Venn diagrams were used to show the number of dysregulated genes during disease development or therapeutic intervention by FGF10 overexpression in the alveolar wall or the pulmonary vasculature. The overlap regions show genes that are in common for the compared groups. Genes that are commonly regulated (between wild-type (Wt) CS versus Wt room air (RA) and Fgf10+/− RA versus Wt RA during disease development; between control (Ctrl) CS versus Ctrl RA and FGF10 overexpression (ovxp) CS versus Ctrl CS during the therapeutic intervention) were further investigated. b) Diagrams showing the common genes with the direction of gene expression changes. Between the two compared groups of genes, positive or negative correlation implies the similar or opposite direction of fold changes, respectively. c) Genes that are regulated in Wt CS versus Wt RA and Fgf10+/− RA versus Wt RA during the disease development are investigated using functional protein association networks (STRING-DB). The analysis shows only genes whose products are connected in the alveolar wall compartment or in pulmonary vessels. Genes that play a role in the Wnt signalling pathway and are regulated during the disease development in the alveolar wall compartment are marked in blue. A cluster related to tyrosine kinase signalling in the pulmonary vasculature is marked in orange. Nos3: (endothelial) nitric oxide synthase 3; Ctsk: cathepsin K; Bok: Bcl-2-related ovarian killer; Tox2: TOX high mobility group box family member 2; Wnt5a: Wnt family member 5A; Ror1: receptor tyrosine kinase-like orphan receptor 1; Actr3: actin-related protein 3; Braf: serine/threonine-protein kinase B rapidly accelerated fibrosarcoma; Prkca: protein kinase Cα; Kit: tyrosine kinase receptor KIT; Vefga: vascular endothelial growth factor A; Cyfip2: cytoplasmic FMR1 interacting protein 2; Nhlrc2: NHL repeat containing 2; Pdgfa: platelet-derived growth factor subunit α; LFC: log fold change.
FIGURE 7
FIGURE 7
Fibroblast growth factor (FGF)10 overexpression ameliorates elastase-induced pulmonary hypertension and emphysema in mice. a) Haemodynamic measurement of the right ventricular systolic pressure (RVSP) (n=4–10) in saline- or elastase-treated mice that were subsequently fed with standard feed (control) or feed containing doxycycline (FGF10) for 1, 5 or 12 weeks. b) Visualisation of the pulmonary vascular tree by ex vivo microcomputed tomography scanning in lungs perfused with radiopaque Microfil. c) Representative images of haematoxylin and eosin-stained mouse lung sections after elastase-induced pulmonary emphysema and subsequent treatment by doxycycline-induced FGF10 overexpression for a duration of 1, 5 or 12 weeks. d) In vivo lung function measurements showing static lung compliance (n=9–13) in the experimental mice. e) Immunofluorescence staining of markers for alveolar epithelial type 2 cells (AT2, pro-surfactant protein C (pro-SPC)) and type I cells (receptor for advanced glycation end products (RAGE)) in lungs of experimental animals (n=4). Quantification shows percentage of AT2 cells of total lung cells in distal lung parenchyma. No significant changes in nuclei count were detected between analysed groups. In the quantification panels each dot represents a measurement obtained from one individual experimental animal. The mean value for each group is represented by a horizontal line (±sd). Statistical analysis: two-way ANOVA; p-values for each comparison and interaction are given in the graphs. Bold type represents statistical significance.
FIGURE 8
FIGURE 8
Fibroblast growth factor (FGF)10 treatment in vitro has beneficial effects on human precision cut lung slices. a) Bromodeoxyuridine-positive (BrdU+) cells in precision-cut lung slices (PCLS) obtained from COPD lungs (n=6) and in vitro treated with recombinant human FGF10 for 24 h. Quantification of proliferation shown as the number of BrdU+ cells⋅mm2 of the analysed tissue area. b–d) Immunostaining and quantification of b) alveolar epithelial type 2 cells (AT2; percentage of HT2–280-positive cells) and c) endothelial cells (platelet and endothelial cell adhesion molecule (PECAM)1 fluorescence intensity) in human COPD PCLS with or without FGF10 treatment at 24 h and 48 h time points (n=5). No significant changes in nuclei count were detected between analysed groups. d) Representative images of immunostaining in PCLS obtained using laser scanning confocal microscopy. e) Protein expression of β-catenin and WNT3A and quantification by densitometry in PCLS homogenates upon 24 h of in vitro treatment with recombinant human FGF10 (n=6). In the quantification panels, each dot represents a measurement obtained from one human PCLS (five to six different COPD lungs). Immunohistochemistry: red: BrdU; blue: haematoxylin. The mean value for each group is represented by a horizontal line (±sd). Statistical analysis: a, e) paired t-test; b, c) paired two-way ANOVA; p-values for each comparison and interaction are given in the graphs. Bold type represents statistical significance. αSMA: α-smooth muscle actin.

Comment in

References

    1. Barnes PJ, Burney PGJ, Silverman EK, et al. . Chronic obstructive pulmonary disease. Nat Rev Dis Primers 2015; 1: 15076. doi:10.1038/nrdp.2015.76 - DOI - PubMed
    1. Barnes PJ. Cellular and molecular mechanisms of chronic obstructive pulmonary disease. Clin Chest Med 2014; 35: 71–86. doi:10.1016/j.ccm.2013.10.004 - DOI - PubMed
    1. Hadzic S, Wu CY, Avdeev S, et al. . Lung epithelium damage in COPD – an unstoppable pathological event? Cell Signal 2020; 68: 109540. doi:10.1016/j.cellsig.2020.109540 - DOI - PubMed
    1. Gredic M, Blanco I, Kovacs G, et al. . Pulmonary hypertension in chronic obstructive pulmonary disease. Br J Pharmacol 2021; 178: 132–151. doi:10.1111/bph.14979 - DOI - PubMed
    1. Pichl A, Sommer N, Bednorz M, et al. . Riociguat for treatment of pulmonary hypertension in COPD: a translational study. Eur Respir J 2019; 53: 1802445. doi:10.1183/13993003.02445-2018 - DOI - PubMed

Publication types

MeSH terms

Substances