. 2023 Oct;33(10):1690-1707.
doi: 10.1101/gr.278239.123. Epub 2023 Oct 26.

Single-cell transcriptome and metagenome profiling reveals the genetic basis of rumen functions and convergent developmental patterns in ruminants

Affiliations

Single-cell transcriptome and metagenome profiling reveals the genetic basis of rumen functions and convergent developmental patterns in ruminants

Juan Deng et al. Genome Res. 2023 Oct.

Abstract

The rumen undergoes developmental changes during maturation. To characterize this understudied dynamic process, we profiled single-cell transcriptomes of about 308,000 cells from the rumen tissues of sheep and goats at 17 time points. We built comprehensive transcriptome and metagenome atlases from early embryonic to rumination stages, and recapitulated histomorphometric and transcriptional features of the rumen, revealing key transitional signatures associated with the development of ruminal cells, microbiota, and core transcriptional regulatory networks. In addition, we identified and validated potential cross-talk between host cells and microbiomes and revealed their roles in modulating the spatiotemporal expression of key genes in ruminal cells. Cross-species analyses revealed convergent developmental patterns of cellular heterogeneity, gene expression, and cell-cell and microbiome-cell interactions. Finally, we uncovered how the interactions can act upon the symbiotic rumen system to modify the processes of fermentation, fiber digestion, and immune defense. These results significantly enhance understanding of the genetic basis of the unique roles of rumen.


Figures

Figure 1.
Figure 1.
UMAP plots and the number of cell types. Cell number (n > 3) at the 17 time points (middle) and expression levels of representative marker genes shown as violin plots (right) for each cell type in sheep (A) and goat (B) rumen.
Figure 2.
Figure 2.
Immunofluorescence staining and pseudotime trajectory analysis. (A) Immunofluorescence of KRT15 in rumen tissues of sheep at the time points e135 and d21 and of goats at the time points e120 and d7. Scale bars, 60 μm (zoomed-in image). (B) Immunofluorescence of LYVE1 in rumen tissues of sheep and goats at the time points e90 and d90. Scale bars, 60 μm (zoomed-in image). (C) Pseudotime trajectory analysis corresponding to the differentiation of basal cells in sheep and goats. Cells are colored by pseudotime, cell types, and sample stages. (D) Pseudotime trajectory analysis corresponding to the marker gene CA1 in sheep and CA3 in goats. Cells are colored by sample stage.
Figure 3.
Figure 3.
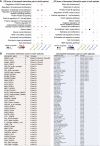
scRNA-seq-based gene expression in rumen cell atlases of sheep and goats. (A) Heatmap showing the top 10 expressed genes (row) in each cell (column) in sheep and goat rumen. The right panel shows the significant (Padj < 0.05) Gene Ontology (GO) terms for the marker genes in each cell type. (B) Heatmaps showing the up-regulated and down-regulated DEGs for each pairwise comparison between different stages (stages E2 vs. E1, E3 vs. E2, P1 vs. E3, P2 vs. P1, and P3 vs. P2) in sheep and goat rumen. The abbreviations of the cell names are shown in Figure 1.
Figure 4.
Figure 4.
Changes in core regulatory transcription factors (TFs) during rumen development. (A) Common up-regulated and down-regulated TFs across the six major developmental stages. (B) Heatmap of the area under the curve (AUC) scores of TF motifs estimated per cell of the cell types across the six major developmental stages. The abbreviations of the cell names are shown in Figure 1.
Figure 5.
Figure 5.
Changes in ligand–receptor (LR) interactions between different cell types in the comparisons of adjacent stages (stages E2 vs. E1, E3 vs. E2, P1 vs. E3, P2 vs. P1, and P3 vs. P2) in sheep and goats. (A) Functional enrichment analysis showing the GO terms for the common up- or down-regulated LR interactions (Padj < 0.05). (B) Common interaction pairs and their frequencies (Freq).
Figure 6.
Figure 6.
Conserved TFs and cell communications in rumen or stomach tissues across species of sheep (including download data), goats, cattle, monkeys, mice, and humans. (A) Dot plots showing the cell–cell interaction pairs in the indicated cell types. The size of the dots indicates the −log10 P-value, and the colored dots show the mean expression levels. (B) Heatmap of the area under the curve (AUC) scaled scores of TF motifs estimated per cell of the cell types.
Figure 7.
Figure 7.
Ruminal microbiota correlations with single-cell transcriptome sequencing in sheep and goats, and transcriptomic analysis of co-cultured rumen cells with Prevotella copri. (A) Correlations of host rumen cell types with the dominant ruminal microbiota. Heatmap shows the Spearman's correlation coefficient between the Eigengene/PC1 value of cell types and the abundances of dominant ruminal microbiota (P < 0.05). (B) Correlations of host rumen cell types with microbial KEGG pathways. Heatmap shows the Spearman's correlation coefficient between the Eigengene/PC1 value of cell types and the abundances of selected microbial KEGG pathways (P < 0.05). The abbreviations of the cell names are shown in Figure 1. (C,D) GO terms (P < 0.05) for up- and down-regulated DEGs (P < 0.05 and |logFC| > 0.75) between the treatment group (co-cultured with P. copri) and control group in primary rumen epithelial cells (C) and primary rumen Fib (D). (E,F) Boxplots showing expression levels of overlap between up-regulated DEGs (treatment vs. control) in primary rumen epithelial cells (E) and primary rumen Fib (F) with up-regulated DEGs (stages P2 vs. P1; Padj < 0.05 and |logFC| > 0.25), which were significantly (P < 0.05) correlated with P. copri. (****) P < 0.0001, (**) P < 0.01, (*) P < 0.05.
Figure 8.
Figure 8.
A summary model of the genetic basis underlying the rumen functions along the development stages.

References

    1. Aagaard K, Ma J, Antony KM, Ganu R, Petrosino J, Versalovic J. 2014. The placenta harbors a unique microbiome. Sci Transl Med 6: 237ra65. 10.1126/scitranslmed.3008599 - DOI - PMC - PubMed
    1. Aibar S, González-Blas CB, Moerman T, Huynh-Thu VA, Imrichova H, Hulselmans G, Rambow F, Marine J-C, Geurts P, Aerts J, et al. 2017. SCENIC: single-cell regulatory network inference and clustering. Nat Methods 14: 1083–1086. 10.1038/nmeth.4463 - DOI - PMC - PubMed
    1. Aramaki T, Blanc-Mathieu R, Endo H, Ohkubo K, Kanehisa M, Goto S, Ogata H. 2020. KofamKOALA: KEGG Ortholog assignment based on profile HMM and adaptive score threshold. Bioinformatics 36: 2251–2252. 10.1093/bioinformatics/btz859 - DOI - PMC - PubMed
    1. Arendt D, Musser JM, Baker CV, Bergman A, Cepko C, Erwin DH, Pavlicev M, Schlosser G, Widder S, Laubichler MD, et al. 2016. The origin and evolution of cell types. Nat Rev Genet 17: 744–757. 10.1038/nrg.2016.127 - DOI - PubMed
    1. Bi Y, Tu Y, Zhang N, Wang S, Zhang F, Suen G, Shao D, Li S, Diao Q. 2021. Multiomics analysis reveals the presence of a microbiome in the gut of fetal lambs. Gut 70: 853–864. 10.1136/gutjnl-2020-320951 - DOI - PMC - PubMed

Publication types

LinkOut - more resources