. 2024 Jan 5;73(2):282-297.
doi: 10.1136/gutjnl-2023-329628.

IL-20 controls resolution of experimental colitis by regulating epithelial IFN/STAT2 signalling

Affiliations

IL-20 controls resolution of experimental colitis by regulating epithelial IFN/STAT2 signalling

Mircea Teodor Chiriac et al. Gut. .

Abstract

Objective: We sought to investigate the role of interleukin (IL)-20 in IBD and experimental colitis.

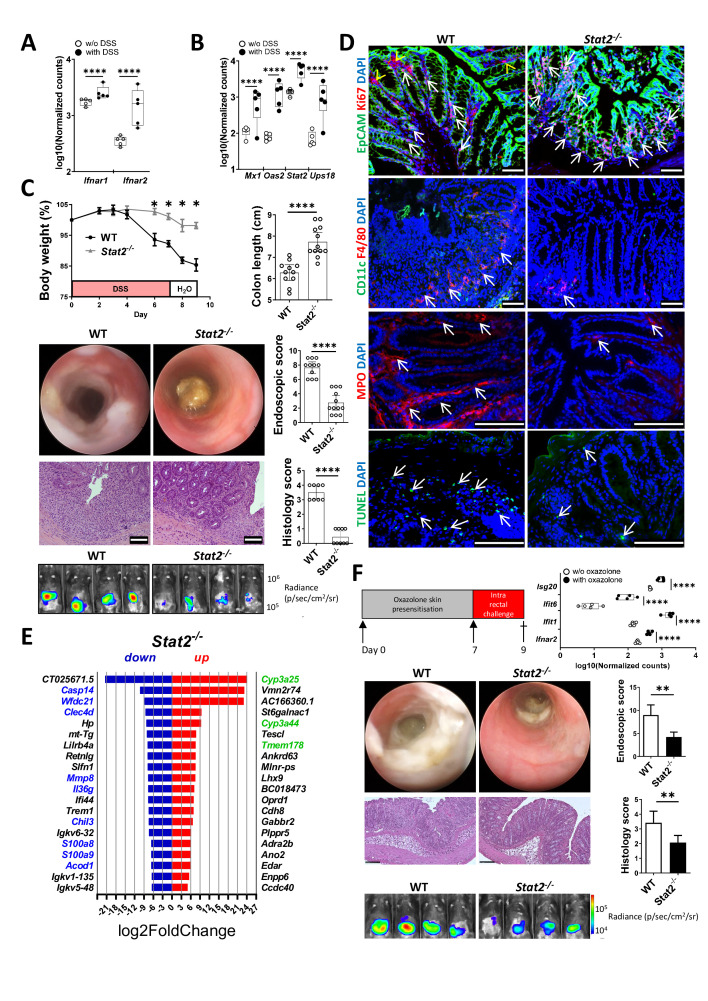
Design: Experimental colitis was induced in mice deficient in components of the IL-20 and signal transducer and activator of transcription (STAT)2 signalling pathways. In vivo imaging, high-resolution mini-endoscopy and histology were used to assess intestinal inflammation. We further used RNA-sequencing (RNA-Seq), RNAScope and Gene Ontology analysis, western blot analysis and co-immunoprecipitation, confocal microscopy and intestinal epithelial cell (IEC)-derived three-dimensional organoids to investigate the underlying molecular mechanisms. Results were validated using samples from patients with IBD and non-IBD control subjects by a combination of RNA-Seq, organoids and immunostainings.

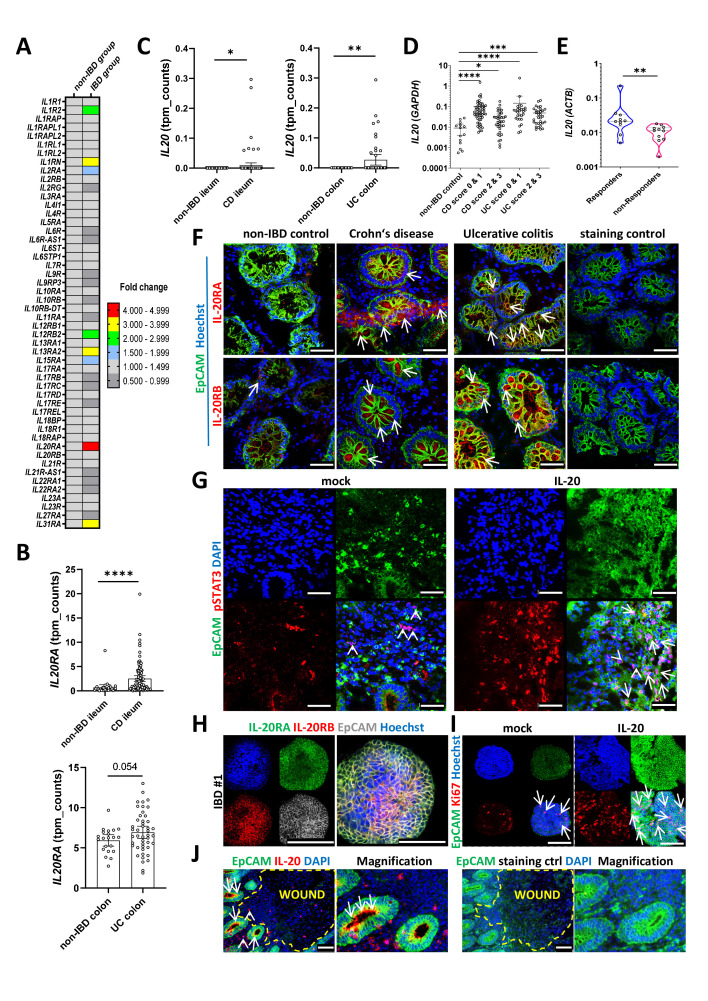
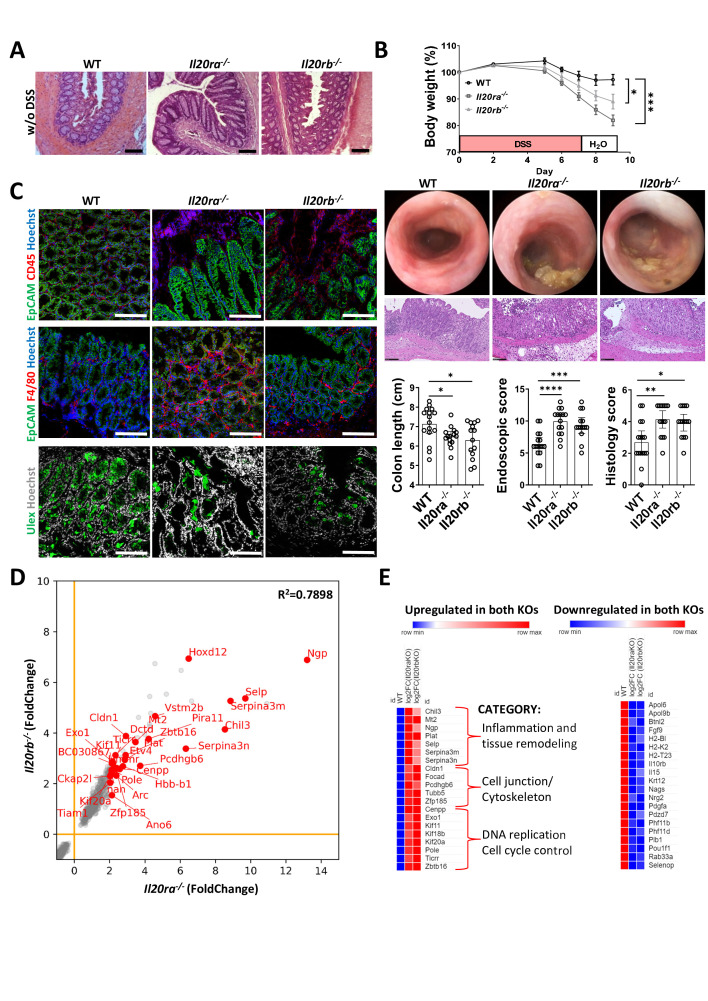
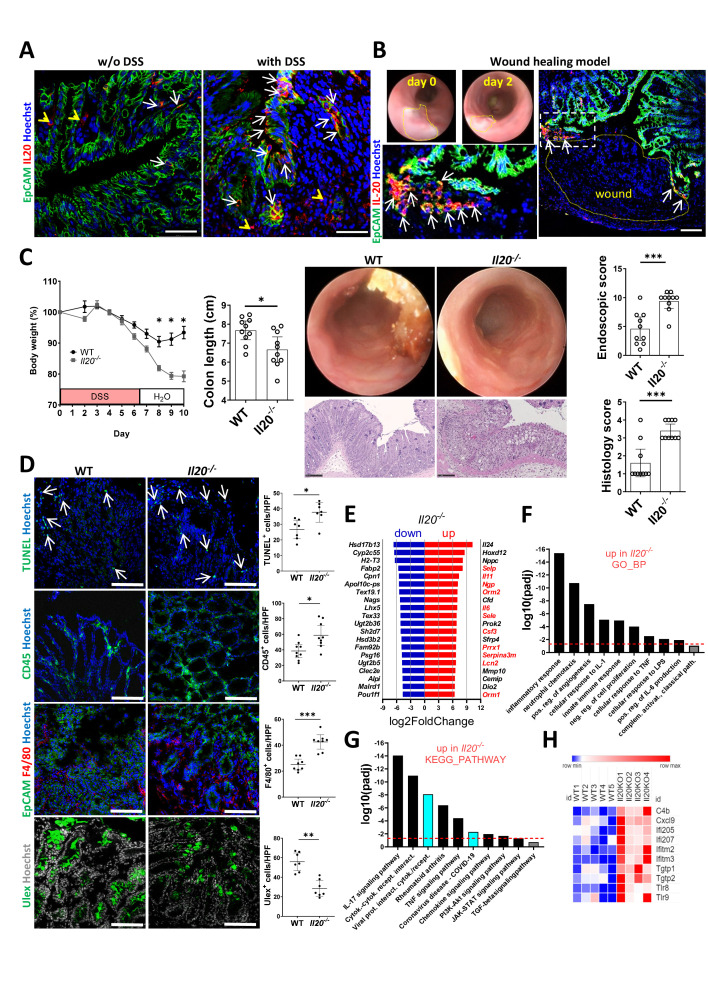
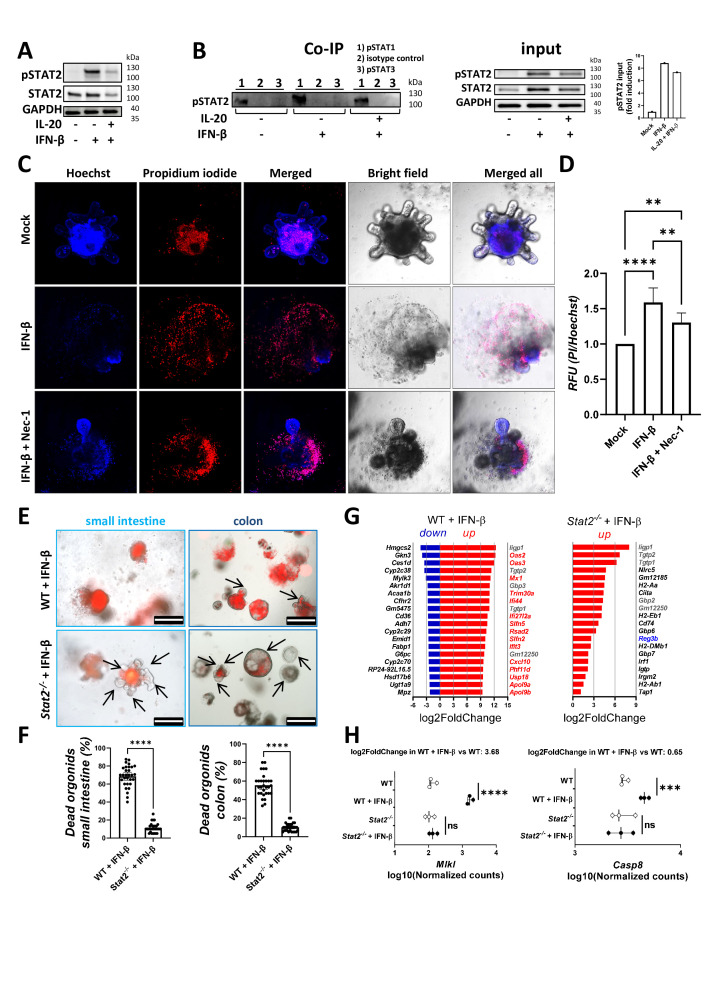
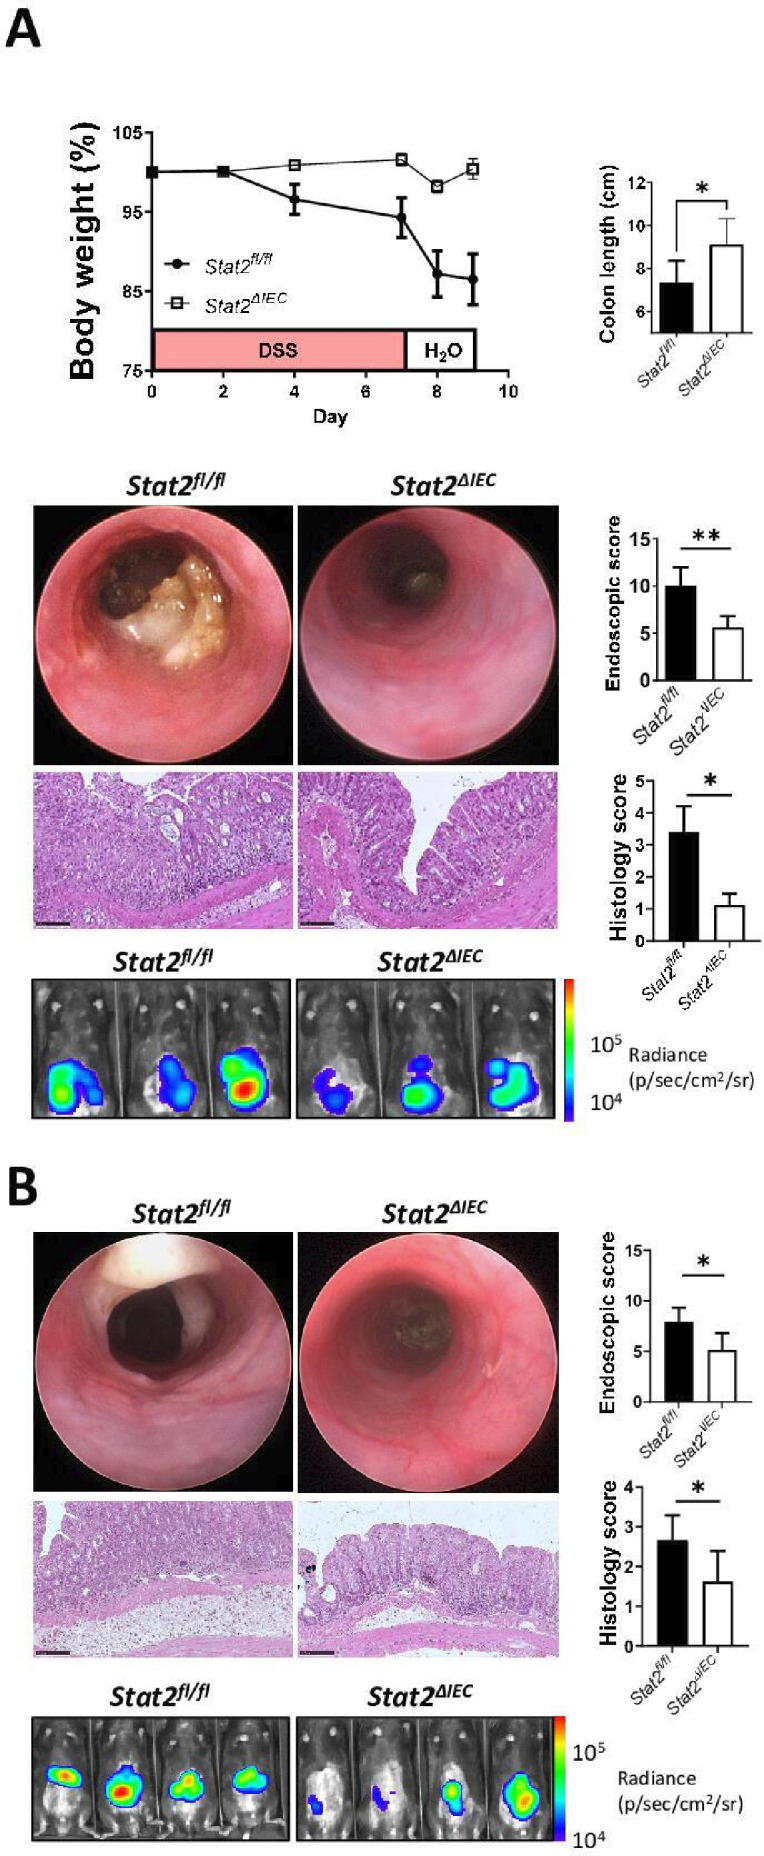
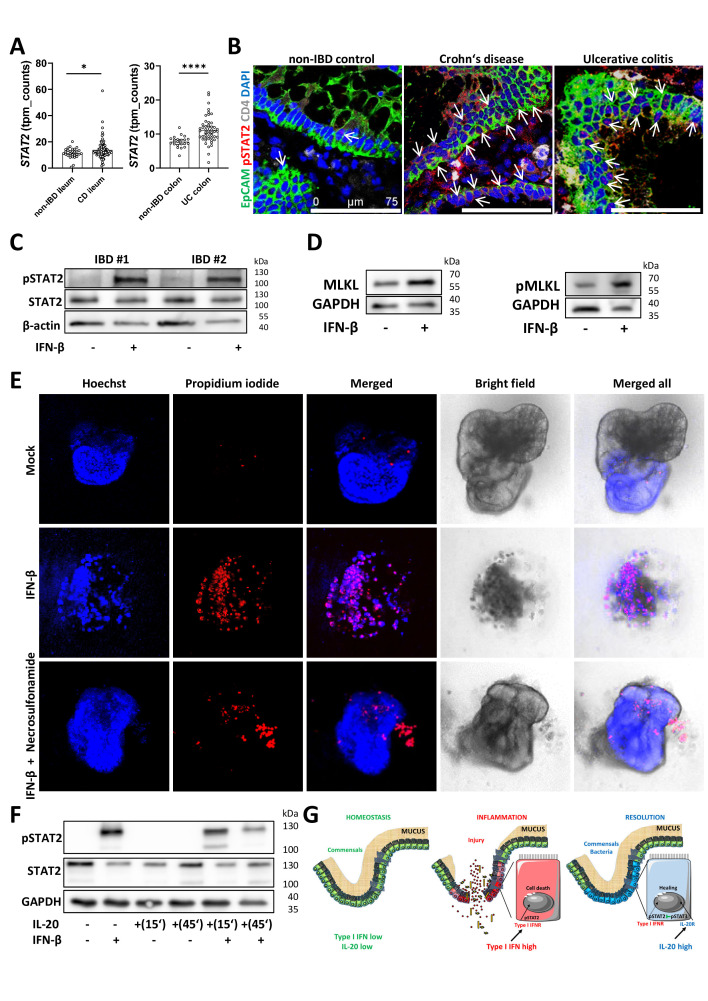
Results: In IBD, IL20 levels were induced during remission and were significantly higher in antitumour necrosis factor responders versus non-responders. IL-20RA and IL-20RB were present on IECs from patients with IBD and IL-20-induced STAT3 and suppressed interferon (IFN)-STAT2 signalling in these cells. In IBD, experimental dextran sulfate sodium (DSS)-induced colitis and mucosal healing, IECs were the main producers of IL-20. Compared with wildtype controls, Il20-/-, Il20ra-/- and Il20rb-/- mice were more susceptible to experimental DSS-induced colitis. IL-20 deficiency was associated with increased IFN/STAT2 activity in mice and IFN/STAT2-induced necroptotic cell death in IEC-derived organoids could be markedly blocked by IL-20. Moreover, newly generated Stat2ΔIEC mice, lacking STAT2 in IECs, were less susceptible to experimental colitis compared with wildtype controls and the administration of IL-20 suppressed colitis activity in wildtype animals.

Conclusion: IL-20 controls colitis and mucosal healing by interfering with the IFN/STAT2 death signalling pathway in IECs. These results indicate new directions for suppressing gut inflammation by modulating IL-20-controlled STAT2 signals.

Keywords: experimental colitis; inflammatory bowel disease; interferon; interleukins; signal transduction.


Conflict of interest statement

Competing interests: MFN has served as an advisor for Pentax, Giuliani, PPM, BMS, Janssen, MSD, Takeda and Boehringer. MFN has served as an Associate Editor of the journal/Editorial Board Member. BS has served as consultant for AbbVie, Arena, BMS, Boehringer, Celgene, Falk, Galapagos, Janssen, Lilly, Pfizer, Prometheus and Takeda and received speaker’s fees from AbbVie, CED Service, Falk, Ferring, Janssen, Novartis, Pfizer, Takeda (served as representative of the Charité). All other authors have nothing to disclose.

Figures

Figure 1
Figure 1
IL-20 signalling is altered during remission in patients with IBD. (A) RNA-Seq analysis of the expression levels of IL receptors in an initial cohort of patients with IBD and non-IBD controls (n=10/group). (B) RNA-Seq expression levels of IL20RA in ileal samples from CD (n=100) and patients without IBD (n=29), in the upper panel, or colon samples from UC (n=46) and non-IBD control samples (n=21), in the lower panel. (C) RNA-Seq expression levels of IL20 in ileal samples from CD and patients without IBD, in the left side panel, or colon samples from UC and non-IBD control samples, in the right side panel. (D) Results of quantitative PCR for IL20 (relative to GAPDH) in non-IBD controls and patients suffering from either CD or UC. Patients were grouped according to their inflammation score into the following categories: 0, no inflammation; 1, mild inflammation; 2, moderate inflammation and 3, severe inflammation (criteria referenced in the online supplemental file). (E) IL20 expression levels (relative to ACTB) in samples from anti-TNF responders and anti-TNF non-responders. (F) Confocal imaging of cryosections from biopsies of patients with CD and UC are shown alongside non-IBD controls (n=5/group). Antibodies to IL-20RA and IL-20RB were used to identify the cells expressing these receptor chains (arrows indicate positive cells in the epithelium). (G) Fresh biopsies from six different patients with IBD were incubated for 60 min in the presence or absence of 250 ng/mL IL-20 and sections were cut and stained with anti-pSTAT3 antibodies. One representative result is shown. Arrows and arrowheads indicate positive cells in the epithelium or in the lamina propria, respectively. (H) Three-dimensional organoids generated from colon biopsies of three different patients with IBD were stained to detect the presence of IL-20RA and IL-20RB. (I) Organoids stimulated for 36 hours with 250 ng/mL IL-20 were stained for Ki67 to identify proliferating cells (arrows). (J) Localisation of IL-20+ cells at the edges of erosions in a colon biopsy of a patient with IBD. A total of four different patients with IBD were evaluated. Arrows indicate IL-20-positive cells in the epithelium and arrowheads in the wounded area. (F–J) Epithelial cell adhesion molecule (EpCAM) and 4′,6-diamidino-2-phenylindole (DAPI)/Hoechst were used to mark epithelial cells and nuclei, respectively. Scale bars, 50 µm in F and G, 100 µm in H (merged), I and J and 200 µm in H (channels). Statistics: Welch’s t-test in B and C; Kruskal-Wallis corrected for multiple comparisons in D; Mann-Whitney U test in E; B–D, mean with 95% CI is displayed. CD, Crohn’s disease; IL, interleukin; RNA-Seq, RNA-sequencing; TNF, tumour necrosis factor. *P<0.05; **p<0.01; ***p<0.001; ****p<0.0001.
Figure 2
Figure 2
Signalling through IL-20RA and IL-20RB controls experimental DSS-induced colitis. (A) Normal appearance of colon cross-sections of WT, Il20ra−/− and Il20rb−/− mice in steady state (water without (w/o) DSS). (B) Experimental colitis (three independent experiments) was induced by the administration of 2% DSS in the drinking water for 7 days in WT (n=16), Il20ra−/− mice (n=15) and Il20rb−/− mice (n=14). Body weight loss during colitis course respective to day 0 (set as 100%). High-resolution mini-endoscopy pictures indicating the degree of intestinal inflammation and histological analysis of inflammation based on H&E staining. Scores were calculated as described in the online supplemental file. Shortened colon lengths indicate aggravation of inflammation. (C) Representative colon cross-sections of mice with DSS-induced colitis that have been stained with the pan-leucocyte marker CD45, the F4/80 macrophage marker and the goblet cell marker Ulex are presented in confocal images. (D–E) RNA-Seq analysis of Il20ra−/− (n=3) and Il20rb−/− (n=3) samples respective to WT control mice (n=5). (D) Expression levels for transcripts that are co-upregulated and co-downregulated in both KO mouse strains versus WT controls from one DSS experiment. (E) Most genes that were found to be co-upregulated in the KO strains could be grouped to Gene Ontology processes that are classically involved in the progression of DSS-induced colitis (left side panel) whereas the most co-downregulated genes did not readily point out to known Gene Ontology categories and are presented in alphabetical order in the panel on the right side. Scale bars, 100 µm in A and C, 50 µm in B. Statistics: analysis of variance corrected for multiple comparisons in B, mean with SEM or 95% CI is displayed; squared Pearson’s correlation coefficient (r) of the linear regression analysis in D. DSS, dextran sulfate sodium; IL, interleukin; KO, knockout; RNA-Seq, RNA-sequencing; WT, wildtype. *P<0.05; **p<0.01; ***p<0.001; ****p<0.0001.
Figure 3
Figure 3
Exacerbated colitis in mice lacking IL-20 is linked to increased IFN responses. (A) Changes in the pattern of IL-20 staining between colon samples from WT mice in steady state (left side panel) compared with mice receiving DSS in the drinking water (right side panel). Arrows indicate positive staining in the IECs and arrowheads in the lamina propria, respectively. (B) Wounds of defined size were placed by a standardised protocol in the colons of mice using a biopsy forceps and the wound areas were collected 2 days thereafter, stained for IL-20 and imaged by confocal microscopy. The appearance of the wound bed at days 0 and 2 is presented in the mini-endoscopy images and one representative wound is presented in the immunofluorescence staining on the right side. Arrows point at positive cells in the epithelial cell compartment that are immediately adjacent to the wound. Magnification is shown in the inset to the left. (C) Experimental colitis (two independent experiments) was induced in WT (n=10) and Il20−/− mice (n=10) by the administration of DSS in the drinking water for 7 days after which the mice received water without DSS. Body weight loss is presented relative to day 0. High-resolution mini-endoscopy pictures indicating the degree of intestinal inflammation and the histological analysis of inflammation based on H&E staining. Scores were calculated as described in the online supplemental file. (D) Colon cryosections of mice with DSS-induced colitis were stained with the late apoptosis marker TUNEL (arrows) and the goblet cell marker Ulex as well as the pan-leucocyte marker CD45 and the specific macrophage cell marker F4/80. (E) RNA-Seq expression levels of the top 20 most upregulated and downregulated genes in the colonic samples from Il20−/− mice (n=4) as compared with WT controls (n=5) are presented with genes linked to IBD/experimental colitis in red font. (F) Selection of some of the significantly altered biological processes from the Gene Ontology analysis performed on the upregulated genes (criteria described in the ‘Results’ section) are presented. (G) Two of the most significant terms of the KEGG pathway analysis linked high colitis activity to antiviral responses (marked in turquois). (H) Differential RNA-Seq expression levels for a typical panel of type I IFN signalling-related genes. Scale bars, 50 µm in A, B and C, 100 µm in D. Statistics: Welch’s t-test in C and D, mean with SEM or 95% CI is displayed. Benjamini-Hochberg for pdaj in E, F and G; the dashed red line indicates pdaj=0.05 in F and G. DSS, dextran sulfate sodium; HPF, high power field; IEC, intestinal epithelial cell; IFN, interferon; IL, interleukin; RNA-Seq, RNA-sequencing; WT, wildtype. *P<0.05; **p<0.01; ***p<0.001.
Figure 4
Figure 4
The IFN-β/STAT2 axis induces necroptosis in murine IEC and IL-20 can interfere with the actions of IFN-β. Organoids from the small intestine and colon of mice were cultured as described in the online supplemental file. (A) Western blot analysis of the levels of pSTAT2 and STAT2 in WT organoids pre-incubated for 60 min with 250 ng/mL IL-20 prior to stimulation with 25 ng/mL IFN-β for 30 min. (B) Organoids from mice with DSS-induced colitis were stimulated with either IFN-β or a combination of IL-20 and IFN-β or were left untreated and cell extracts were then Co-IP with anti-pSTAT1, anti-pSTAT3 or with monoclonal isotype control antibodies. Western blot analysis was performed to detect pSTAT2. Lysates not subjected to Co-IP served as input controls for the detection of pSTAT2, STAT2 and GAPDH levels. (C) Murine colon organoids from mice with DSS-induced colitis (n=5 mice, technical duplicates or triplicates) were stimulated with IFN-β in the presence or absence of the Nec-1 and stained with PI to assess cell death and Hoechst for normalisation purposes. (D) Quantification of the results. (E) Survival of WT and Stat2−/− organoids stimulated for 36 hours with 100 ng/mL IFN-β was followed by microscopy on addition of PI (red indicates dead areas, green is autofluorescence, areas with living cells are indicated by arrows). (F) Quantification of the results in n=3 mice/group with technical triplicates. (G) Small intestine organoids from WT and Stat2−/− mice (n=3/group) were either left untreated or were stimulated for 20 hours with 25 ng/mL IFN-β and then subjected to RNA-Seq (three biological replicates/condition, pairwise design). The top 20 upregulated and downregulated genes are displayed in WT organoids in the left side panel. The vast majority of these genes that are missing in the right-side panel (ie, top 20 upregulated genes in Stat2−/− organoids after IFN-β stimulation) are marked in red. (H) Differences between levels of Mlkl and Casp8 in the RNA-Seq profiling of results from G. Scale bars, 500 µm in E. Statistics: analysis of variance in D; Welch’s t-test in F; Benjamini-Hochberg for pdaj in G and H. Co-IP, co-immunoprecipitation; DSS, dextran sulfate sodium; IEC, intestinal epithelial cell; IFN, interferon; IL, interleukin; Nec-1, necrostatin-1; ns, not significant; PI, propidium iodide; RFU, relative fluorescence units; RNA-Seq, RNA-sequencing; WT, wildtype. **p<0.01; ***p<0.001; ****p<0.0001.
Figure 5
Figure 5
Stat2−/− mice are resistant to experimental DSS-induced and oxazolone-induced colitis. (A, B) RNA-Seq data analysis of the levels of type I IFN receptor chains (A) and different type I IFN target genes (B) in mice receiving DSS in the drinking water versus mice receiving water without (w/o) DSS (n=5/group). (C) Experimental colitis (two independent experiments) was induced in WT (n=11) and Stat2−/− mice (n=12) by the administration of 2% DSS in the drinking water for 7 days. Body weight loss during colitis course respective to day 0. The degree of inflammation was further assessed by the colon length shortening, high-resolution mini-endoscopy, in vivo imaging of neutrophil infiltration and histology. (D) Representative staining of immune cell markers (CD11c, F4/80, MPO), the proliferation marker Ki67, the epithelial cell marker EpCAM and the late apoptosis marker TUNEL. Arrows indicate positive staining in IECs. Arrowheads in the top panels indicate positive Ki67 staining in the non-IEC compartment. (E) Top 20 most upregulated and downregulated genes in the RNA-Seq analysis of Stat2−/− vs WT mice from one DSS experiment (n=4/group). Upregulated genes that have been previously linked to beneficial outcomes in IBD/experimental colitis are marked in green whereas downregulated genes marked in blue have been previously linked to disease pathogenesis. (F) Experimental colitis was induced by cutaneous sensitisation of mice on day 0 and 1 week later by the intrarectal application of oxazolone. Significant upregulation of Ifnar2 as wells as typical IFN target genes in RNA-Seq analysis of WT mice receiving oxazolone versus WT mice w/o oxazolone treatment (n=5/group, right side panel). Representative endoscopy pictures from WT and Stat2−/− mice in the oxazolone-induced model showing fibrin deposits and altered mucosal appearance are shown alongside in vivo imaging of neutrophil infiltration and histology pictures confirming the infiltration of the gut and the destruction of the epithelial architecture. Scale bars, all 100 µm. Statistics: Benjamini-Hochberg for padj in A, B, E and F, box and whiskers with min to max are displayed in A, B and F. Welch’s t-test in C and F, mean with SEM or 95% CI is displayed. DSS, dextran sulfate sodium; IEC, intestinal epithelial cell; IFN, interferon; RNA-Seq, RNA-sequencing; WT, wildtype. *P<0.05; **p<0.01; ****p<0.0001.
Figure 6
Figure 6
Stat2ΔIEC mice are resistant to DSS-induced and oxazolone-induced colitis. (A) Colitis (two independent experiments) was induced in mice by the administration of DSS in the drinking water for 7 days. Stat2ΔIEC mice were more resistant as compared with Stat2fl/fl littermates as indicated by the body weight curve, colon length, mini-endoscopy, histology and real-time imaging of neutrophil infiltration assessed by in vivo luminescence. (B) Compared with their Stat2fl/fl control littermates, Stat2ΔIEC developed less inflammation as defined by a similar set of criteria in the complementary model of oxazolone-induced colitis. Statistics: Welch’s t-test in A and B, mean with SEM or 95% CI is displayed. DSS, dextran sulfate sodium; IEC, intestinal epithelial cell. *P<0.05; **p<0.01.
Figure 7
Figure 7
IL-20 interferes with IFN/STAT2-dependent necroptotic cell-death pathway in IECs from patients with IBD. (A) Levels of STAT2 expression in Crohn’s disease, UC and non-IBD controls as detected by RNA-Seq. (B) Confocal imaging of pSTAT2 in biopsies from Crohn‘s disease, UC and non-IBD controls (n=5/group) with positive IECs indicated by arrows. (C) Three-dimensional organoids generated from colon biopsies of patients with IBD were either stimulated for 30 min with 25 ng/mL IFN-β or were left untreated and protein extracts were subjected to western blot analysis with anti-pSTAT2 and STAT2 antibodies. Results from two patients are shown. Beta-actin served as loading control. (D) Results of MLKL and pMLKL levels after the incubation of IBD organoids with IFN-β for 24 hours. (E) IBD organoids (n=3 different patients) were incubated with IFN-β in the presence or absence of necrosulfonamide for 36 hours and cell death was assessed by staining with propidium iodide to mark dead cells. Hoechst was used for normalisation purposes. (F) Western blot analysis of pSTAT2 and STAT2 in IBD organoids after stimulations with IL-20 and IFN-β. Scale bars, 75 µm in B. Statistics: Welch’s t-test in A, mean with 95% CI is displayed. (G) Schematic representation of possible interactions between IL-20 and type I IFN signals in homeostasis, during the active phase and the resolution phases of intestinal inflammation. IEC, intestinal epithelial cell; IFN, interferon; IL, interleukin; RNA-Seq, RNA-sequencing. *P<0.05; ****p<0.0001.

References

    1. Macdonald TT, Monteleone G. Immunity, inflammation, and allergy in the gut. Science 2005;307:1920–5. 10.1126/science.1106442 - DOI - PubMed
    1. Strober W, Fuss I, Mannon P. The fundamental basis of inflammatory bowel disease. J Clin Invest 2007;117:514–21. 10.1172/JCI30587 - DOI - PMC - PubMed
    1. Kaser A, Zeissig S, Blumberg RS. Inflammatory bowel disease. Annu Rev Immunol 2010;28:573–621. 10.1146/annurev-immunol-030409-101225 - DOI - PMC - PubMed
    1. MacDonald TT, Monteleone I, Fantini MC, et al. Regulation of homeostasis and inflammation in the intestine. Gastroenterology 2011;140:1768–75. 10.1053/j.gastro.2011.02.047 - DOI - PubMed
    1. Buckley CD, Gilroy DW, Serhan CN, et al. The resolution of inflammation. Nat Rev Immunol 2013;13:59–66. 10.1038/nri3362 - DOI - PubMed

Publication types