. 2023 Oct 26;14(1):6797.
doi: 10.1038/s41467-023-42273-8.

Antibody-directed extracellular proximity biotinylation reveals that Contactin-1 regulates axo-axonic innervation of axon initial segments

Affiliations

Antibody-directed extracellular proximity biotinylation reveals that Contactin-1 regulates axo-axonic innervation of axon initial segments

Yuki Ogawa et al. Nat Commun. .

Abstract

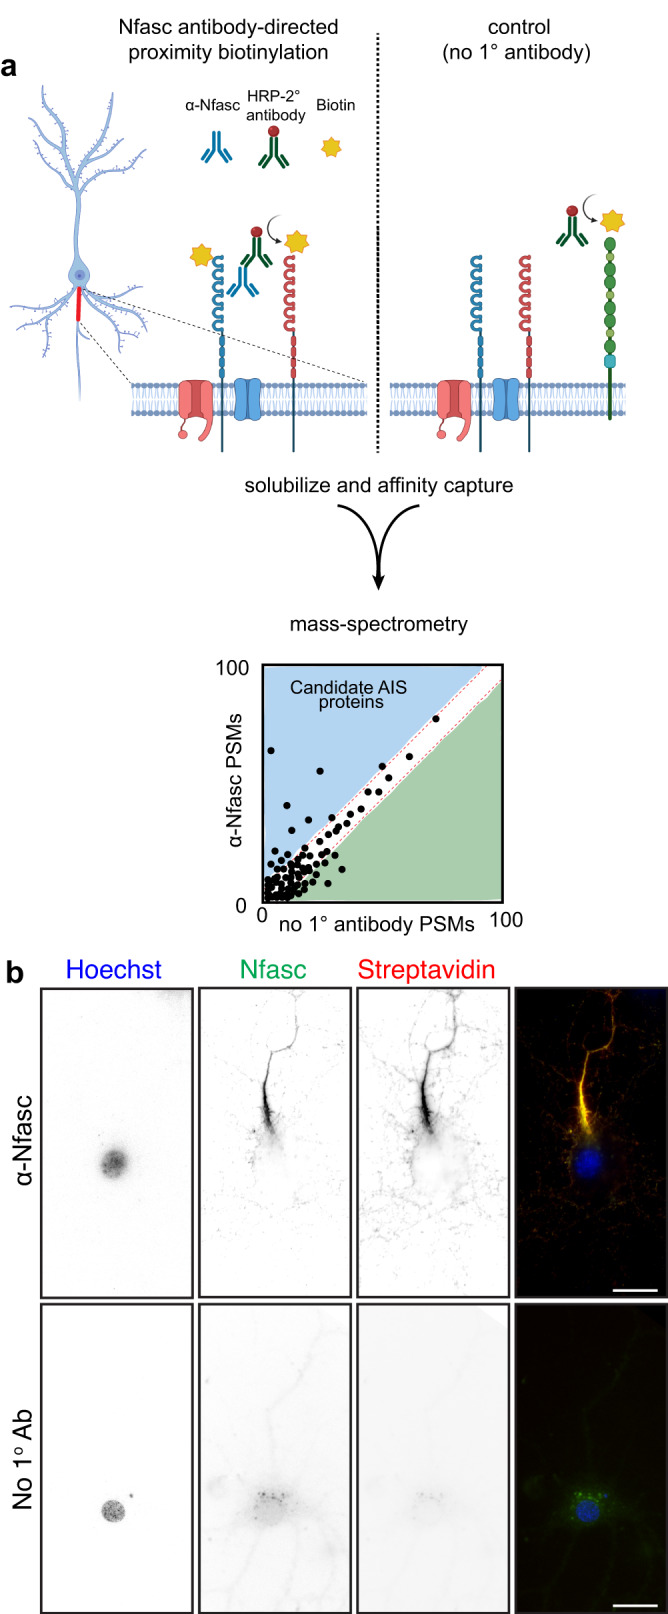
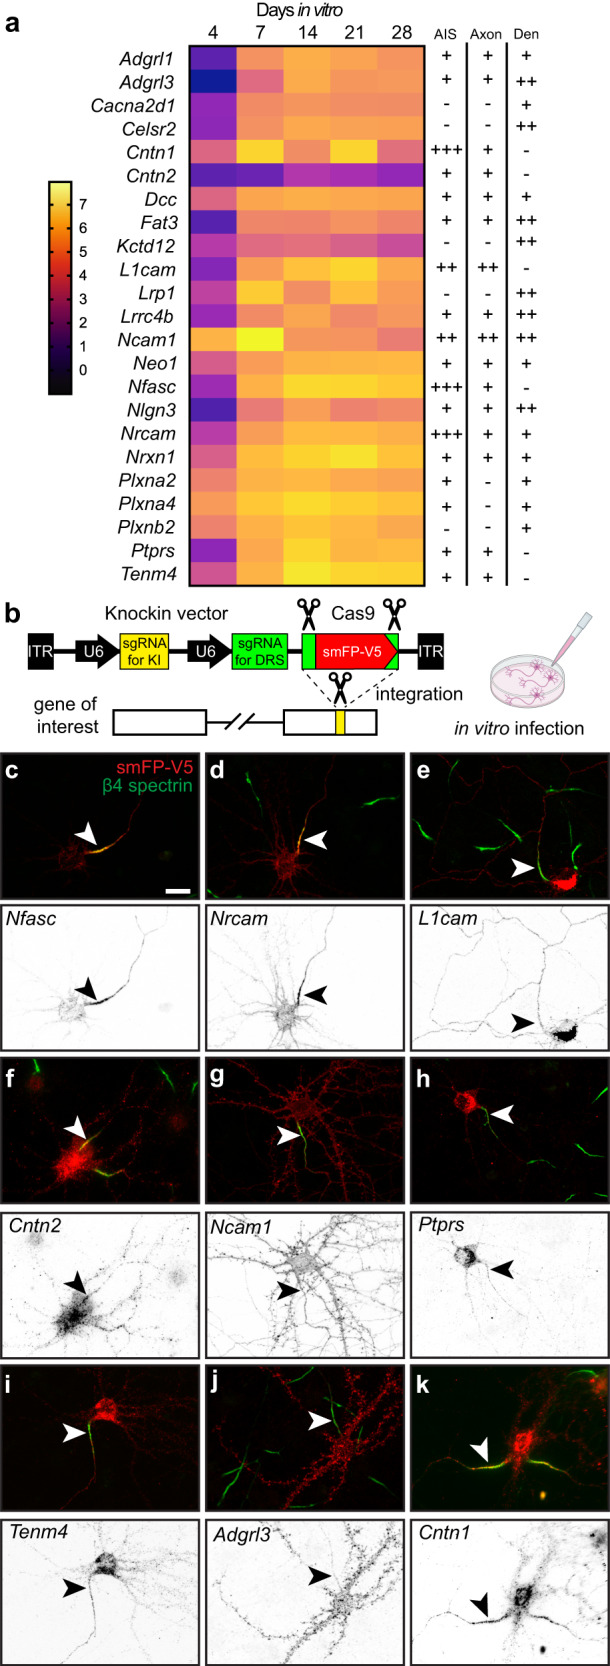
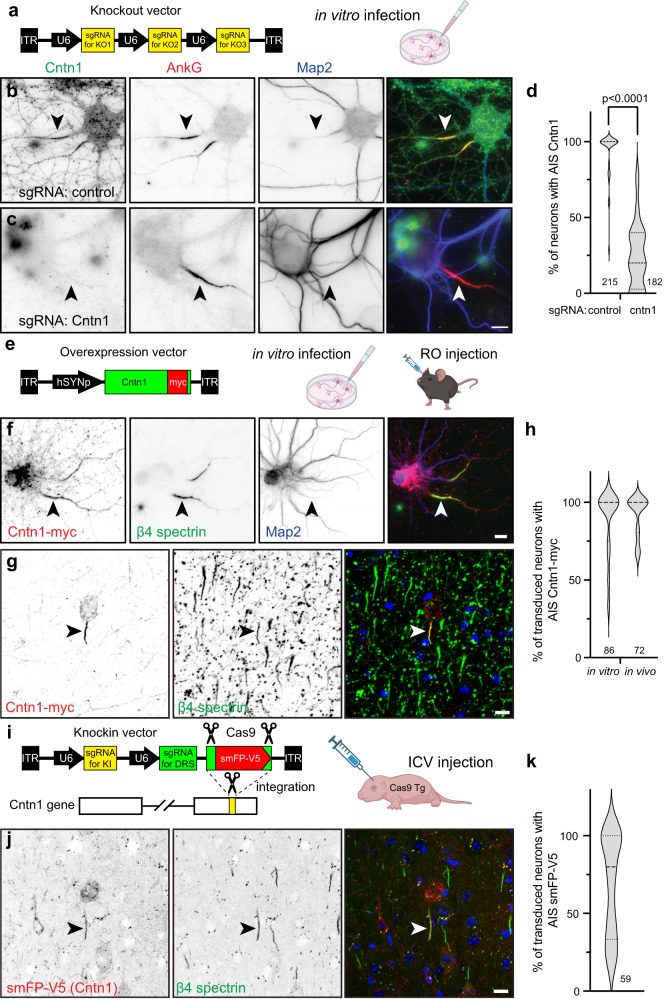
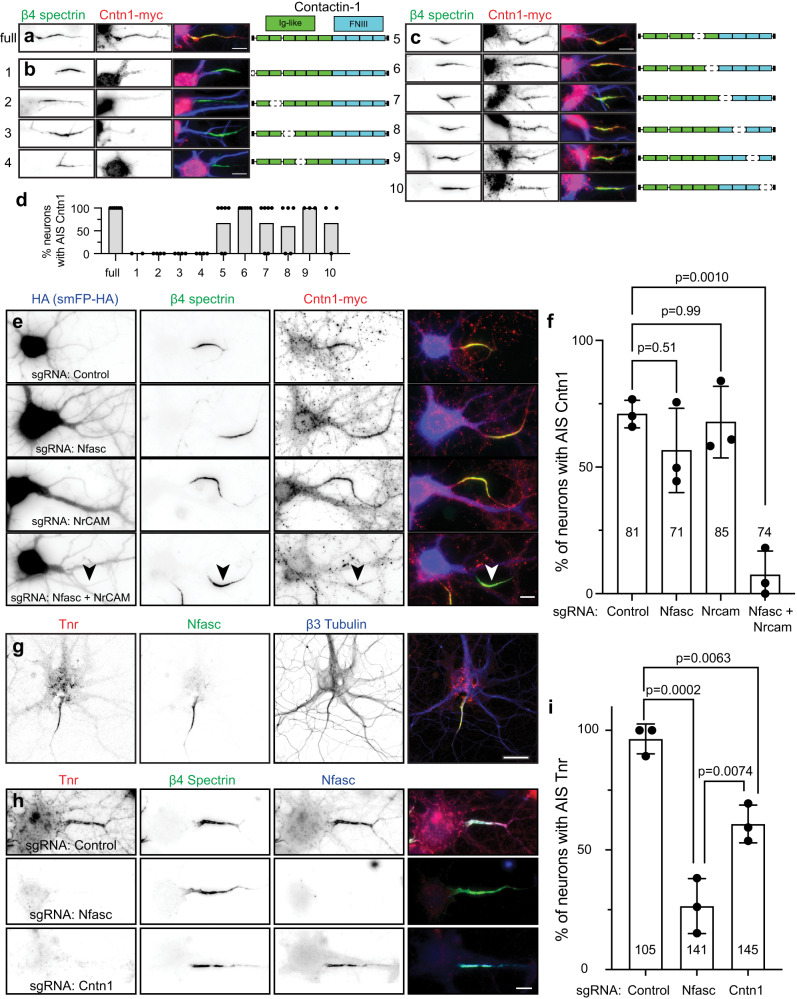
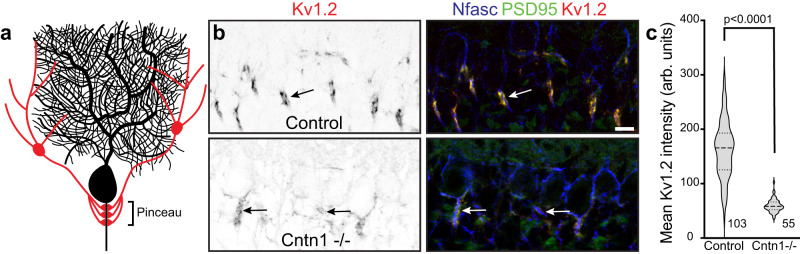
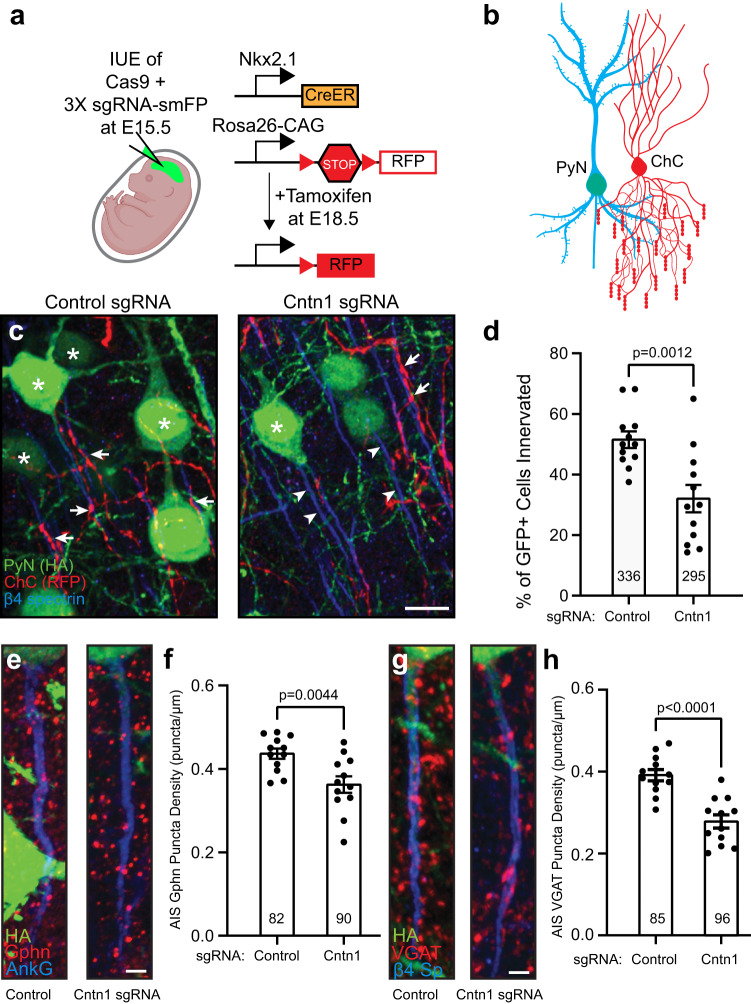
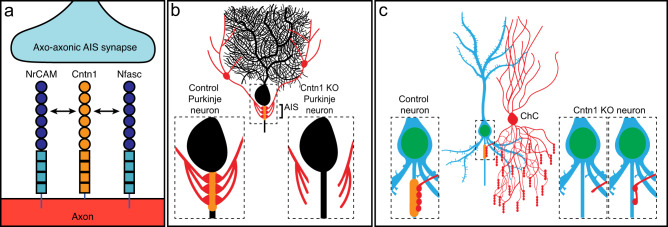
Axon initial segment (AIS) cell surface proteins mediate key biological processes in neurons including action potential initiation and axo-axonic synapse formation. However, few AIS cell surface proteins have been identified. Here, we use antibody-directed proximity biotinylation to define the cell surface proteins in close proximity to the AIS cell adhesion molecule Neurofascin. To determine the distributions of the identified proteins, we use CRISPR-mediated genome editing for insertion of epitope tags in the endogenous proteins. We identify Contactin-1 (Cntn1) as an AIS cell surface protein. Cntn1 is enriched at the AIS through interactions with Neurofascin and NrCAM. We further show that Cntn1 contributes to assembly of the AIS extracellular matrix, and regulates AIS axo-axonic innervation by inhibitory basket cells in the cerebellum and inhibitory chandelier cells in the cortex.


Conflict of interest statement

The authors declare no competing interests.

Figures

Fig. 1
Fig. 1. Proximity-dependent biotinylation using Nfasc antibodies.
a Illustration of the antibody-directed proximity biotinylation strategy. Anti-Nfasc antibodies bind to Nfasc, while HRP-conjugated secondary antibodies bind to the Nfasc antibodies. Addition of biotin phenol (biotin tyramide) in an H2O2 containing diluent results HRP-mediated conversion of the biotin phenol to an active radical biotin phenoxyl that covalently adds the tyramide biotin to extracellular tyrosine residues. Omission of the primary anti-Nfasc serves as a control. After stringent solubilization and affinity capture by streptavidin-conjugated magnetic beads. Biotinylated proteins are then identified by mass spectrometry. Created with Biorender.com. b Fluorescence imaging of DIV14 rat hippocampal neurons labeled by Nfasc-BAR or a control condition (no primary Ab). Nfasc fluorescence (green) enrichment defines the AIS. Hoechst (blue) labels nuclei, and biotinylated proteins are detected using Alexa594-conjugated streptavidin (red). N = 3 independent experiments. Scale bars, 20 μm.
Fig. 2
Fig. 2. NF186 proximity proteomes across neuronal development.
a Immunofluorescence labeling of NF186 at different timepoints of hippocampal neuron development in vitro; N = 3 independent experiments. Lower panels: magnified images show the Nfasc-labeled AIS at each time point. Scale bars, 20 μm. b–f Volcano plots showing the log2-fold changes of proteins versus the statistical significance -log10(pvalue) identified using Nfasc-directed proximity biotinylation (N = 3). P values were calculated using a nonparametric two-sided T-test; no adjustments were made for multiple comparisons. P < 0.05 was used as a cutoff for significance (horizontal dashed line). Some identified proteins are indicated (corresponding gene names listed); those previously reported as AIS cell surface proteins are shown in red.
Fig. 3
Fig. 3. Change in expression level for cell surface proteins in proximity to Nfasc.
a Heatmaps showing log2-fold changes at each timepoint for all 285 proteins that satisfied two filtering criteria [(1) normalized PSMs > 10; (2) log2FC (Nfasc/Ctrl) > 2] for at least one of five timepoints, rank-ordered by the slope of the linear regression of their log2 fold enrichment over time. b Expanded heat map showing gene names for the proteins (1–50 and 51–100) with the largest rate of increase in PSM count (B). Data shown are from N = 3 biological replicates for each timepoint (see Fig. S2).
Fig. 4
Fig. 4. Nfasc-BAR identifies known AIS membrane and membrane-associated proteins.
a Known AIS membrane and membrane-associated proteins and their log2FC (Nfasc/Ctrl). b Illustration of membrane topology, average PSMs (at DIV14), and the number of extracellular tyrosine residues for three different AIS and membrane proteins. Created with Biorender.com. c, d Scatter plot of the number of peptide spectral matches (PSMs) for each biotinylated protein identified by mass spectrometry as compared to the number of tyrosine residues present in each protein’s extracellular domain, shown at different scales. Proteins in red were previously reported at the AIS. e Proximity plot showing biotinylated proteins (at DIV14) ordered by extracellular (EC) tyrosine/PSM ratio. The plot is an estimate of abundance and proximity to the HRP secondary antibody bound to the Nfasc primary antibody. Each protein is represented by a circle with size proportional to the number of PSMs identified for that protein. Proteins analzyed in subsequent experiments are indicated by their gene names. EC Tyrosine/PSM ratio: 0–0.5 green, 0.5–1.0 yellow, 1.0–1.5 blue, 1.5–2.0 red.
Fig. 5
Fig. 5. Tagging of endogenous membrane proteins.
a Proteins whose distribution was tested using endogenous protein tagging. The heatmap shows the increase in expression level is shown as a function of days in vitro (see also Fig. 2c). The presence of the tagged protein in AIS, axon, and dendrite is indicated. b Schematic of the knock-in vector for in vitro CRISPR-mediated endogenous gene tagging. DRS, donor recognition sites. Created with Biorender.com. c–k Examples of smFP-V5 tagged proteins (red) enriched at the AIS (c, d, f, k), the axon (e, g), dendrites (j), or in multiple domains (e, g, h, i). AIS are labeled for β4 spectrin (green) and are indicated by an arrowhead. Neurons were transfected at DIV0 and fixed at DIV21. N = 2 independent experiments with two independent viruses targeting each gene of interest. Scale bar, 20 µm.
Fig. 6
Fig. 6. Cntn1 is an AIS protein.
a The knockout vector for in vitro transduction of neurons. b, c Immunostaining for Cntn1 (green), AnkG (red) and Map2 (blue) after transduction with control (b) or Cntn1 (c) sgRNAs; arrowheads indicate AIS. Neurons were transduced at DIV0 and fixed at DIV21. Scale bar, 10 µm. N = 8 independent experiments. d Quantification of Cntn1 knockout by sgRNA. N = 8 coverslips, 4 FOV for each coverslip and each sgRNA; n = 215 and 182 neurons for control and Cntn1 sgRNAs, respectively. P values calculated using a nonparametric two-sided T-test; no adjustments were made for multiple comparisons; (t = 14.07, df = 62) p = 5.79 × 10−21. e The Cntn1-myc vector used for infection of neurons. RO, retro-orbital. f Transduction of hippocampal neurons at DIV 10 using AAV to express myc-tagged Cntn1. Neurons were fixed at DIV14. Cntn1-myc (red) is enriched at the AIS (arrowhead) and colocalizes with β4 spectrin (green). Map2 (blue) labels somatodendritic domains. N = 3 independent experiments. Scale bar, 10 µm. g In vivo transduction of cortical neurons in 13-week-old mice to express myc-tagged Cntn1. Brains were collected 4 weeks later. Cntn1-myc (red) is enriched at the AIS (arrowhead) and colocalizes with β4 spectrin (green); Hoechst (blue) labels nuclei. N = 4 mice. Scale bar, 10 µm. h The percentage of transduced neurons with AIS Cntn1-myc. For in vitro experiments, N = 3, with 15 fields of view (FOV) and 86 transduced neurons. For in vivo experiments, N = 4, with 16 FOV and 72 transduced neurons. i The knock-in vector for in vivo tagging of Cntn1. DRS, donor recognition sites. AAV were delivered by intracerebroventricular (ICV) injection at P0 into Cas9 transgenic (Tg) mice. j In vivo transduction of P0 cortical neurons to tag endogenous Cntn1 (red). Brains were collected 8 weeks later. The smFP-V5 tagged Cntn1 colocalizes with AIS β4 spectrin (green, arrowhead). Hoechst dye (blue) labels nuclei. N = 4 mice. Scale bar, 10 µm. k The percentage of cortical neurons with AIS smFP-V5 labeling. N = 4 mice, with 15 FOV and 59 transduced neurons. In all violin plots dotted and dashed lines indicate quartiles and median, respectively. a, e, i Created with Biorender.com.
Fig. 7
Fig. 7. Cntn1 is recruited to the AIS through interactions with AnkG-binding L1-family cell adhesion molecules.
a Cntn1-myc (red) colocalizes with β4 spectrin (green). Cntn1 consists of 6 N-terminal Immunoglobulin (Ig)-like domains and 4 C-terminal Fibronectin type III (FNIII) domains. Scale bar, 10 µm. b Cntn1-myc with N-terminal and internal deletions of the first 4 Ig-like domains. Scale bar, 10 µm. c Cntn1-myc localization to the AIS does not depend on the last 2 Ig-like domains or any FNIII domain. Scale bar, 10 µm. For experiments in (b and c), neurons were transfected at DIV15 and fixed one day later at DIV16. d The percentage of neurons with Cntn1-myc (full) or Cntn1-myc truncation variants (variants 1-10) at the AIS. N = 2, 4, 4, 4, 6, 5, 6, 5, 3, and 3 FOV for constructs 1–10, respectively; individual data points and mean are shown. Data are from two independent experiments. e Hippocampal neurons transduced with AAV to express Cas9 and control, Nfasc, NrCAM, or Nfasc+NrCAM gRNAs at DIV0 (these AAVs also express smFP-HA). At DIV12 neurons were transduced with Cntn1-myc AAV, and fixed at DIV21. Neurons were labeled using antibodies against HA as a transduction marker (blue), β4 spectrin (green), and Cntn1-myc (red). Scale bar, 10 µm. f Quantification of the percentage of transduced neurons with AIS Cntn1-myc. N = 3 independent experiments, 5-13 FOV per experiment. Ordinary one-way ANOVA with Tukey’s multiple comparisons test. Error bars, ±SEM. The total number of neurons analyzed is also indicated. g Immunostaining of cultured hippocampal neurons using antibodies against Tenascin R (Tnr; red), β4 spectrin (green), and β3 Tubulin (blue). N = 3 independent experiments. Scale bar, 25 µm. h Cultured hippocampal neurons transduced at DIV0 with AAV to express Cas9 and control, Nfasc, or Cntn1 gRNAs. Neurons were labeled at DIV21 using antibodies against Tnr (red), β4 spectrin (green), and Nfasc (blue). Scale bar, 10 µm. i Quantification of the percentage of transduced neurons with AIS Tnr. N = 3 independent experiments. Ordinary one-way ANOVA with Tukey’s multiple comparisons test. Error bars, ±SEM. The total number of neurons analyzed is also indicated.
Fig. 8
Fig. 8. Cntn1 is required for axo-axonic innervation of Purkinje neuron AIS.
a Illustration of a Purkinje neuron (black) with a basket cell (red) forming the cerebellar pinceau on the AIS. b Immunostaining of P17 cerebellar pinceau in control and Cntn1 −/− mouse brain using antibodies against Kv1.2 (red) and PSD95 (green) to label the pinceau, and Nfasc (blue) to label the Purkinje neuron AIS. Scale bar, 10 µm. N = 3 control and 2 Cntn1 −/− mice. c Violin plot of the mean Kv1.2 intensity of the cerebellar pinceau in control and Cntn1 −/− mice. N = 3 control and 2 Cntn1 −/− mice. The number of pinceau analyzed is indicated. In the violin plot the dashed lines indicate the median, while the dotted lines represent the first and third quartiles. P values were calculated using a nonparametric two-sided T-test; no adjustments were made for multiple comparisons; (t = 14.41, df = 156) p = 1.8 × 10−30.
Fig. 9
Fig. 9. Pyramidal neuron Cntn1 regulates AIS synaptic innervation by ChCs.
a The knockout and labeling strategy for PyN and ChCs. PyNs are electroporated at E15.5 using plasmids to express Cas9 and 3X sgRNA-smFP (HA tag) to delete expression of Cntn1. ChCs are labeled by expression of red fluorescent protein (RFP) using inducible Cre (CreER) in Nkx2.1-CreER mice at E18.5. b ChC (red) innervation of PyN (blue/green) AIS. c PyNs (HA, green) innervated at their AIS (β4 spectrin, blue) by ChC cartridges (red) in layer II of the somatosensory cortex from Nkx2.1-CreER;Ai9 mice co-electroporated at E15.5 with a plasmid expressing Cas9 and a plasmid expressing smFP-HA and a control sgRNA or Cntn1 sgRNA; mice were sacrificed at P17. Stars indicate HA+ PyNs and arrows indicate ChC innervation of PyN AISs; arrowheads indicate AIS of PyNs transfected with Cntn1 sgRNA lacking innervation by ChC cartridges. Scale bar, 10 µm. d The percentage of HA+ PyNs innervated by single RFP+ ChCs at P17. 12 ChCs and 336 and 295 HA+ PyNs measured from 3 animals were analyzed for Control and Cntn1 sgRNA, respectively. Data are mean ± SEM. (t = 3.701, df = 22) P = 0.0012. e, f HA+ PyN AISs from Nkx2.1-CreER;Ai9 mice electroporated at E15.5 and sacrificed at P17. Inhibitory synapses are visualized by immunostaining for the GABAergic postsynaptic marker gephyrin (Gphn; red; e) or the GABAergic presynaptic marker VGAT (red; g). AISs (blue) immunostained for AnkG in (e) and β4 spectrin in (g). Scale bars, 2 µm. f, h The average number of gephyrin (f) or VGAT (h) puncta per µm of HA+ PyN AIS at P17. 82 and 90 HA+ PyN AIS from 3 animals were analyzed for Gphn (f) in Control and Cntn1 sgRNA, respectively. 85 and 96 HA+ PyN AIS from 3 animals were analyzed for VGAT puncta (h) in Control and Cntn1 sgRNA, respectively. In f and h, data are mean ± SEM. For f, (t = 3.176, df = 22) p = 0.0044; for (h), (t = 5.313, df = 22) p = 2.0 × 10−5. In d, f, and h, P values were calculated using a nonparametric two-sided T-test; no adjustments were made for multiple comparisons. a and b Created with Biorender.com.
Fig. 10
Fig. 10. Summary of results.
a Cntn1 interacts with and is redundantly recruited to the AIS through interactions with both NrCAM and Nfasc. b Loss of AIS Cntn1 (orange at AIS) from cerebellar Purkinje neurons disrupts basket cell innervation of the AIS and formation of pinceau synapses. c Loss of AIS Cntn1 (orange) from Pyramidal neurons results in reduced innervation of AIS by Chandelier cells (ChC) and reduced numbers of AIS inhibitory synapses. Created with Biorender.com.

Update of

References

    1. Leterrier C. The Axon Initial Segment: An Updated Viewpoint. J. Neurosci. 2018;38:2135–2145. doi: 10.1523/JNEUROSCI.1922-17.2018. - DOI - PMC - PubMed
    1. Rasband MN. The axon initial segment and the maintenance of neuronal polarity. Nat. Rev. Neurosci. 2010;11:552–562. doi: 10.1038/nrn2852. - DOI - PubMed
    1. Samavarchi-Tehrani P, Samson R, Gingras AC. Proximity Dependent Biotinylation: Key Enzymes and Adaptation to Proteomics Approaches. Mol. Cell. Proteom. 2020;19:757–773. doi: 10.1074/mcp.R120.001941. - DOI - PMC - PubMed
    1. Hamdan H, et al. Mapping axon initial segment structure and function by multiplexed proximity biotinylation. Nat. Commun. 2020;11:100. doi: 10.1038/s41467-019-13658-5. - DOI - PMC - PubMed
    1. Li J, et al. Cell-Surface Proteomic Profiling in the Fly Brain Uncovers Wiring Regulators. Cell. 2020;180:373–386.e315. doi: 10.1016/j.cell.2019.12.029. - DOI - PMC - PubMed

Publication types

LinkOut - more resources