. 2023 Oct 26;14(1):6813.
doi: 10.1038/s41467-023-42608-5.

PH13 improves soybean shade traits and enhances yield for high-density planting at high latitudes

Affiliations

PH13 improves soybean shade traits and enhances yield for high-density planting at high latitudes

Chao Qin et al. Nat Commun. .

Abstract

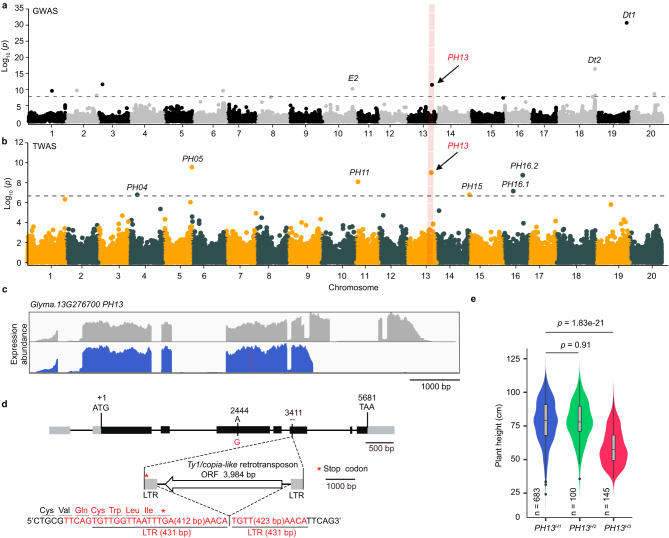
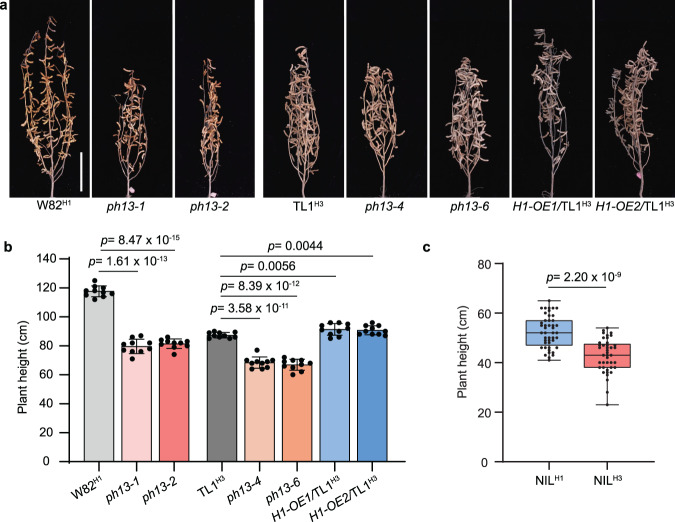
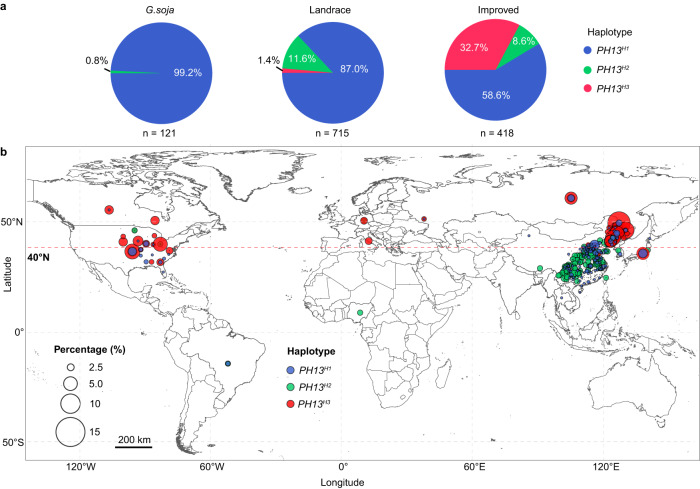
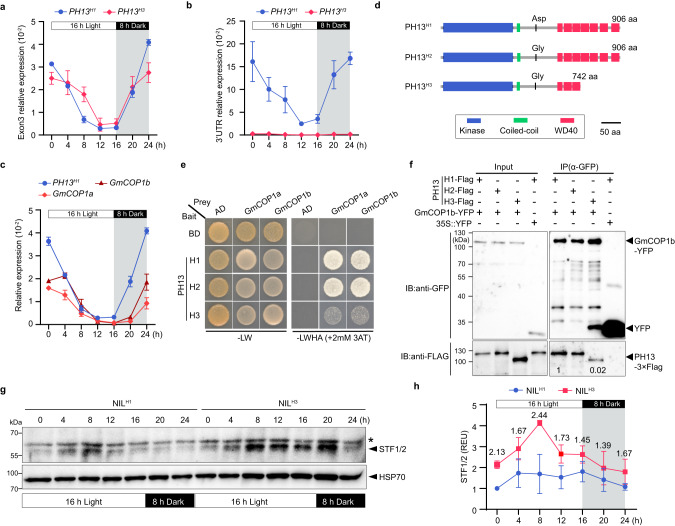
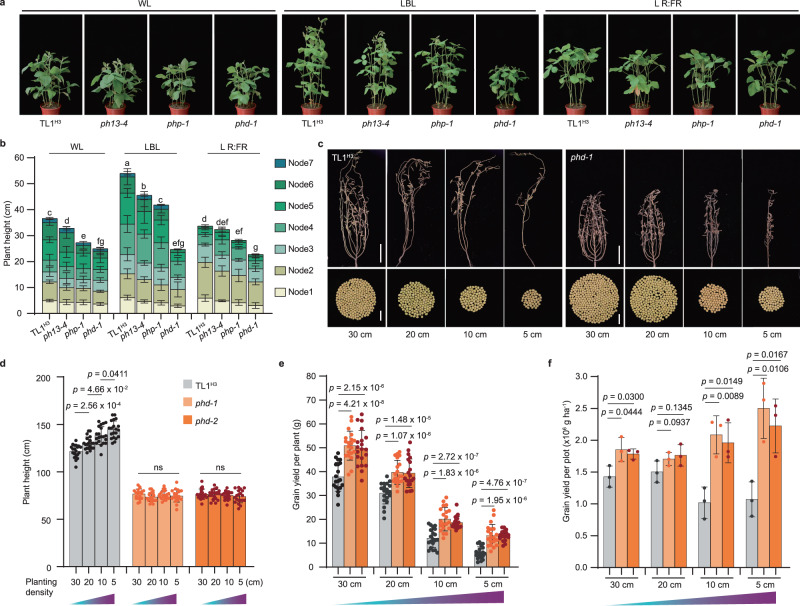
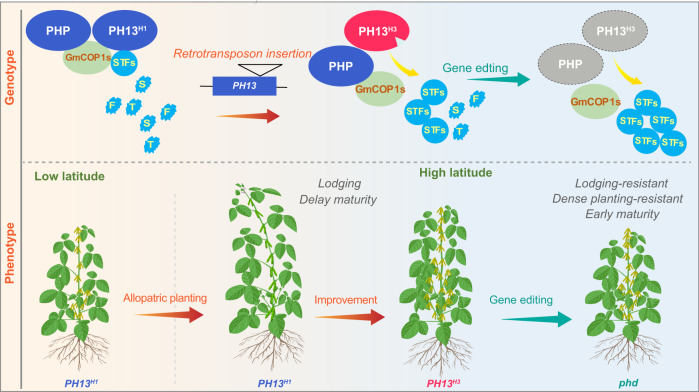
Shading in combination with extended photoperiods can cause exaggerated stem elongation (ESE) in soybean, leading to lodging and reduced yields when planted at high-density in high-latitude regions. However, the genetic basis of plant height in adaptation to these regions remains unclear. Here, through a genome-wide association study, we identify a plant height regulating gene on chromosome 13 (PH13) encoding a WD40 protein with three main haplotypes in natural populations. We find that an insertion of a Ty1/Copia-like retrotransposon in the haplotype 3 leads to a truncated PH13H3 with reduced interaction with GmCOP1s, resulting in accumulation of STF1/2, and reduced plant height. In addition, PH13H3 allele has been strongly selected for genetic improvement at high latitudes. Deletion of both PH13 and its paralogue PHP can prevent shade-induced ESE and allow high-density planting. This study provides insights into the mechanism of shade-resistance and offers potential solutions for breeding high-yielding soybean cultivar for high-latitude regions.


Conflict of interest statement

The authors declare no competing interests.

Figures

Fig. 1
Fig. 1. Identification of PH13 as a major QTL for plant height in soybean.
a, b Manhattan plots for GWAS (540 accessions) and TWAS (488 accessions) of soybean plant height (Supplementary Data 1). Each dot represents one SNP in GWAS (a) or gene/exon in TWAS (b). The p values derived from association analyses conducted using FarmCPU were log-transformed, with the gray dashed line representing the Bonferroni correction threshold for multiple test adjustments. Previously identified genes are labeled in black, and PH13 is labeled in red. The green and orange dots are arranged in alternation to distinguish them from different chromosomes. c Two types of transcripts associated with plant height variation were shown. The transcripts with normal expression levels are displayed at the top, while those with truncated expression due to the insertion of a Ty1/Copia-like retrotransposon are shown below. Five samples from each category were randomly selected and pooled for alignment visualization. d Schematic representation of the PH13 candidate gene and the insertion site of a Ty1/Copia-like retrotransposon. Solid and shaded boxes in the gene structure represent exons and UTRs, respectively. The retrotransposon diagram is shown at the bottom, with LTR representing long terminal repeats and ORF representing open reading frame. The red “G” (base 2444) represents the nonsynonymous mutation derived from exonic SNP. The red letters below denote flanking nucleotides and amino acids derived from the retrotransposon insertion. e Distribution of plant height BLUP (Best Linear Unbiased Prediction) for each haplotype. The BLUP values were calculated using the plant height data of natural populations in ten field environments over two or three years (Methods-GWAS and TWAS assays). The box plot shows the 25th to 75th percentile range, with a black line indicating the median. The whiskers extend to cover a range of 1.5 times the interquartile range, and black dots represent outliers. p values obtained from unpaired, two-tailed Student’s t-tests (Supplementary Data 7).
Fig. 2
Fig. 2. Genetic confirmation of PH13 as a plant height regulator.
a Gross photos of the indicated lines grown under natural field conditions in the summer of Beijing. The CRISPR/Cas9-engineered mutants ph13-1 and ph13-2 are in the W82H1 (carrying PH13H1) background, and ph13-4 and ph13-6 are in the TL1H3 (carrying PH13H3) background. The PH13H1 overexpression lines (H1-OE1/TL1H3 and H1-OE2/TL1H3) are in the TL1H3 background. Scale bar, 20 cm. b Plant height of the indicated lines as shown in a. Data are mean ± SD (n = 10 biologically independent plants). c Plant height of the near-isogenic lines (NILs) carrying homozygous H1 (NILH1) and homozygous H3 (NILH3) under natural field conditions in Beijing. The NILs were derived from the hybrid combination between W82H1 and TL1H3 (Supplementary Fig. 13). The two ends of the box plot and the upper, middle, and lower box lines represent the upper edge, lower edge, median, and two quartiles of values. Data are mean ± SD (n = 45 and 41 biologically independent plants for NILH1 and NILH3, respectively). Above p values were calculated by unpaired, two-tailed Student’s t-tests. Source data are provided as a Source Data file.
Fig. 3
Fig. 3. The evolution and geographical distribution of PH13 different haplotypes.
a The pie charts represent the percentage of accessions with different haplotypes in wild soybean, landrace, and improved cultivars. b The global geographical distribution of 1133 soybean accessions (including landrace and improved cultivars) carrying PH13H1, PH13H2, and PH13H3 (Supplementary Data 7) is shown using circle. The color of the circle represents the type of germplasm, and the size of the circle represents the percentage of germplasm in respective location.
Fig. 4
Fig. 4. Comparison of transcripts and protein activities of different haplotype of PH13.
Transcript levels of PH13H1 in W82 and PH13H3 in TL1 respectively, were measured using primers detecting the expression of exon 3 (a) and 3’UTR (b). c Transcript levels of PH13H1, GmCOP1a, and GmCOP1b in W82. The second trifoliate leaves of 20-day-old seedlings grown under long-day conditions were collected at 4-hour intervals for RT-qPCR analysis. Data are mean ± SD (n = 3 biologically independent replicates) calculated relative to GmActin. d Protein structure of each haplotype. aa, amino acids. e Auxotrophic assays showing the interactions between different PH13 haplotypes with GmCOP1s. Yeast cells transformed with indicated constructs were selected on -LW (lacking Leu and Trp) or -LWHA (lacking Leu, Trp, His and Ade) medium. AD, GAL4 activation domain; BD, GAL4 DNA-binding domain. f Co-Immunoprecipitation (Co-IP) assay showing the interaction between each PH13 haplotype with GmCOP1b in tobacco leaves. The indicated constructs were co-transformed into tobacco which were then incubated at 25 °C in dark for 12 h and grown under white light (WL, 80 μmol m−2 s−1) for 36 h. The immunoprecipitates were detected using anti-GFP (at a 1:2500 dilution) and anti-Flag (at a 1:2500 dilution) antibodies, respectively. Empty vector (35S::YFP) was used as a negative control. Numbers at bottom represent the relative IP efficiency, calculated as (IP-PH13/Input-PH13)/(IP-GmCOP1b/Input-GmCOP1). A representative result of three independent replicates is shown. g Immunoblots showing STF1/2 protein levels in the NILH1 and NILH3 lines under diurnal conditions. The first trifoliate leaves of 15-day-old seedlings grown under long-day condition were collected at 4-hour intervals. The membrane was probed with the anti-STF1/2 antibody (at a 1:1000 dilution), stripped, and then probed with the anti-HSP70 antibody (at a 1:10,000 dilution). The asterisk indicates a non-specific band. h The relative expression level of STF1/2 proteins represented by REU (Relative Expression Unit) was calculated by the formula [STF1/2] / [HSP70], in which ‘STF1/2’ and ‘HSP70’ indicate the digitized band intensity of STF1/2 or HSP70 in each sample collected at respective time point. The REU of STF1/2 in NILH1 at ZT0 was arbitrarily set to 1. Data are shown as means ± SD of three biological replicates (Supplementary Fig. 18). Source data are provided as a Source Data file.
Fig. 5
Fig. 5. CRISPR/Cas9 targeting of the PH13 gene and its paralog (PHP) abolished the LBL induced ESE and enhanced yield under different planting densities.
a Representative images of the php-1, ph13-4, and phd-1 mutants and WT TL1 under different light regimes. Seedlings were grown under white light (WL), LBL, and WL plus far-red (L R:FR) for 15 days after de-etiolation with white light under long-day conditions. The intensity of photosynthetically active radiation (PAR) was maintained at approximately 500 μmol m−2 s−1 (Supplementary Fig. 24). Scale bar corresponds to 20 cm. b Plant height and internode length of the indicated lines shown in a. Data are means ± SD (n = 6 biologically independent plants for b). Different letters indicate statistically significant differences as determined by two-way ANOVA with two-sided Tukey test at the 0.05 level. c Gross photos of the WT TL1 and phd-1 mutant plants (upper panel, Scale bar, 20 cm) and the whole seeds (bottom panel, Scale bar, 2 cm) produced by respective plant grown with 30 cm, 20 cm, 10 cm, or 5 cm plant space, respectively. Statistical analysis of the plant height (d), grain yield per plant (e), and grain yield per plot (f) of each indicated line. Data are means ± SD (n = 20 biologically independent plants for d and e; n = 3 biologically independent field plots for f). p values are from unpaired, two-tailed Student’s t-tests. Source data are provided as a Source Data file.
Fig. 6
Fig. 6. A proposed working model of PH13 and PHP for breeding of elite cultivar suitable for high density planting in high latitudes.
The insertion of the Ty1/Copia-like retrotransposon in the PH13 H3 gene attenuates the interaction between PH13 and GmCOP1s and increases the abundance of STFs protein, resulting in a stocky architecture in the natural population. The soybean accessions harboring PH13H3 were selected during improvement and utilized by modern breeders at high latitude. The phd double mutants (harbors mutation in both PH13 and PHP) display excellent shade traits under high-density planting conditions, which can be further utilized to improve the yield at high latitudes.

References

    1. SoyStat. http://www.soystats.com/ (2023).
    1. Ray DK, Ramankutty N, Mueller ND, West PC, Foley JA. Recent patterns of crop yield growth and stagnation. Nat. Commun. 2012;3:1293. doi: 10.1038/ncomms2296. - DOI - PubMed
    1. Ray DK, Mueller ND, West PC, Foley JA. Yield trends are insufficient to double global crop production by 2050. PLoS ONE. 2013;8:e66428. doi: 10.1371/journal.pone.0066428. - DOI - PMC - PubMed
    1. Zhang SR, et al. Photoperiodism dynamics during the domestication and improvement of soybean. Sci. China Life Sci. 2017;60:1416–1427. doi: 10.1007/s11427-016-9154-x. - DOI - PubMed
    1. Lin X, Liu B, Weller JL, Abe J, Kong F. Molecular mechanisms for the photoperiodic regulation of flowering in soybean. J. Integr. Plant Biol. 2021;63:981–994. doi: 10.1111/jipb.13021. - DOI - PubMed

Publication types