. 2023 Oct 26;13(1):18341.
doi: 10.1038/s41598-023-44050-5.

Lineage specific extracellular vesicle-associated protein biomarkers for the early detection of high grade serous ovarian cancer

Affiliations

Lineage specific extracellular vesicle-associated protein biomarkers for the early detection of high grade serous ovarian cancer

Camille V Trinidad et al. Sci Rep. .

Abstract

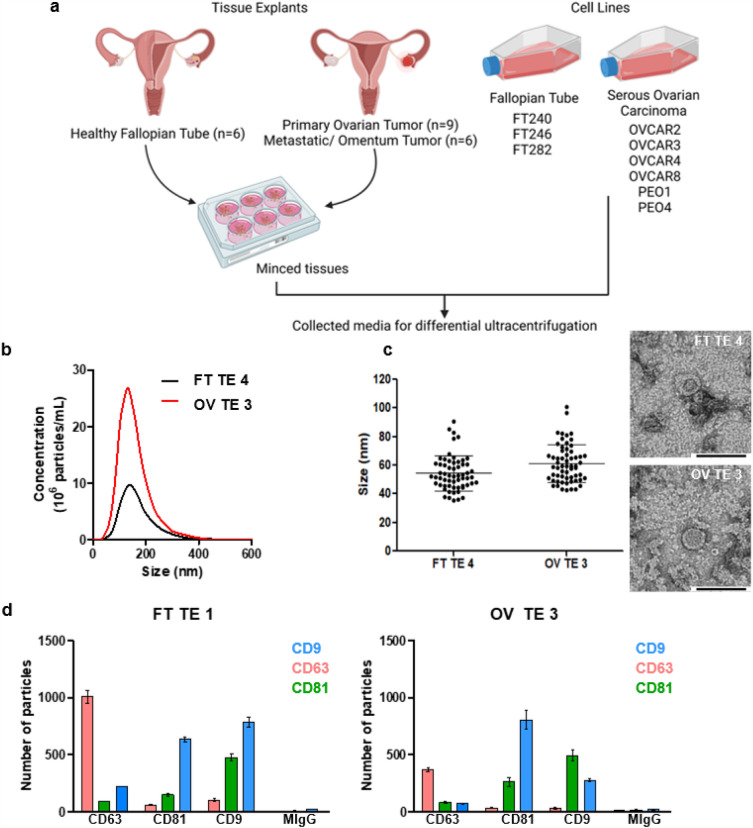
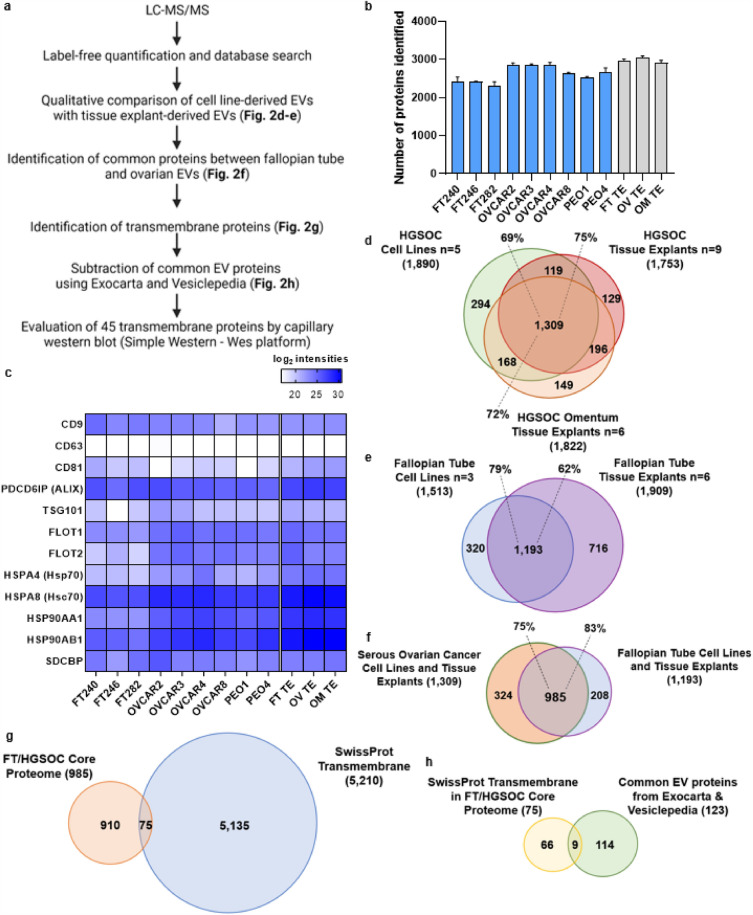
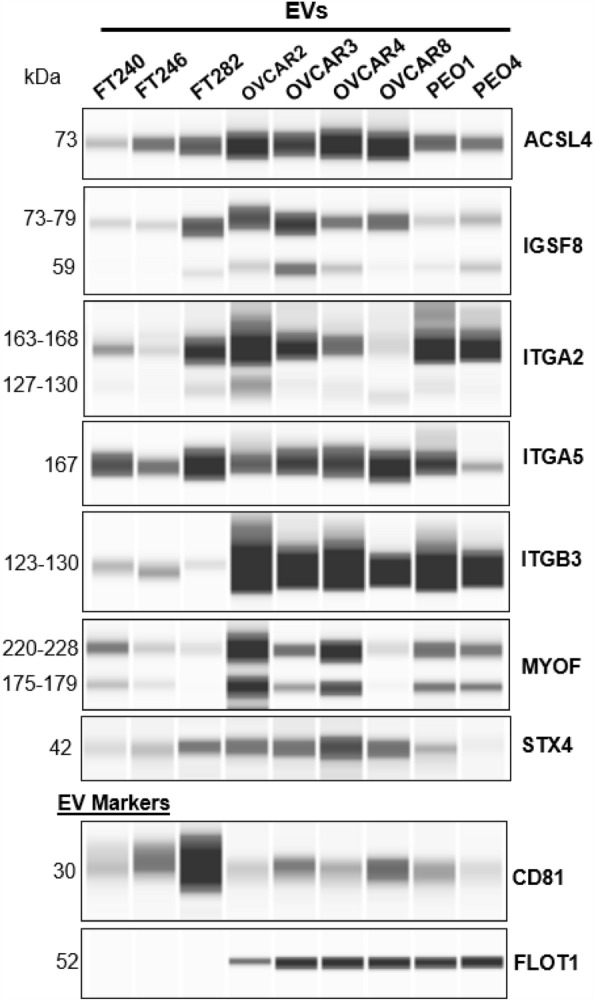
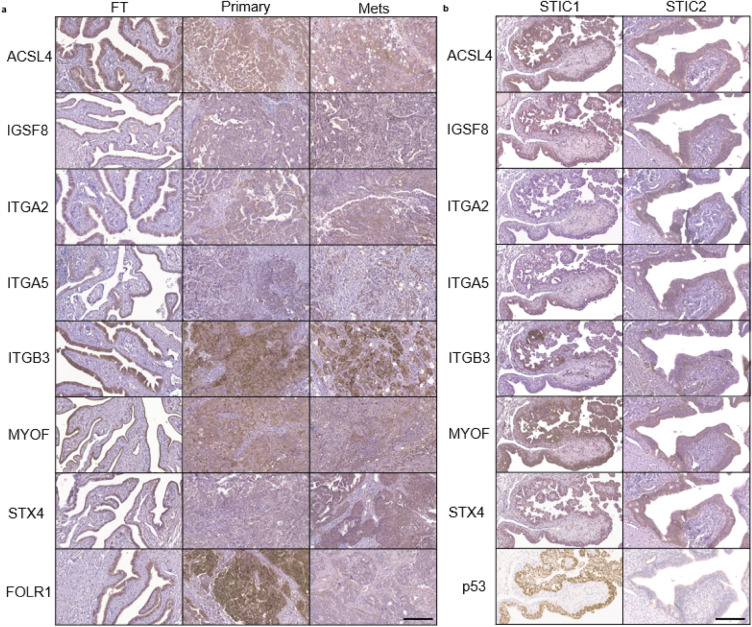
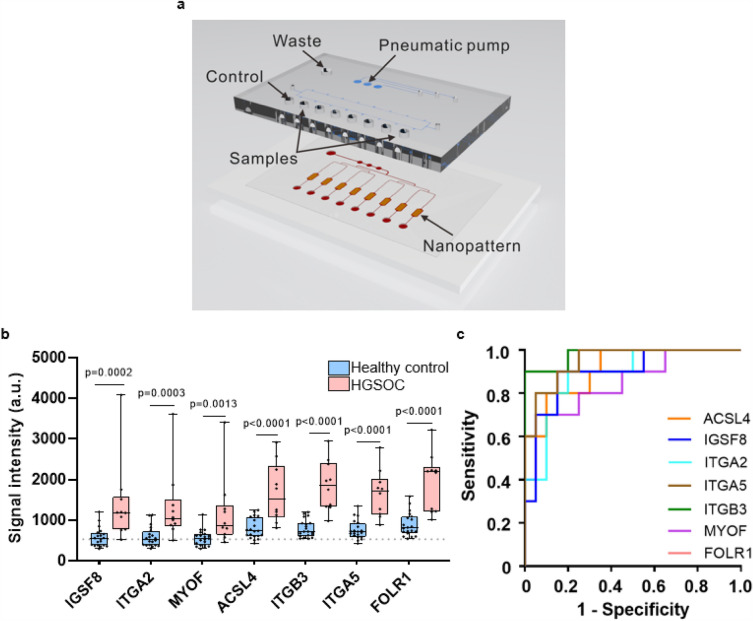
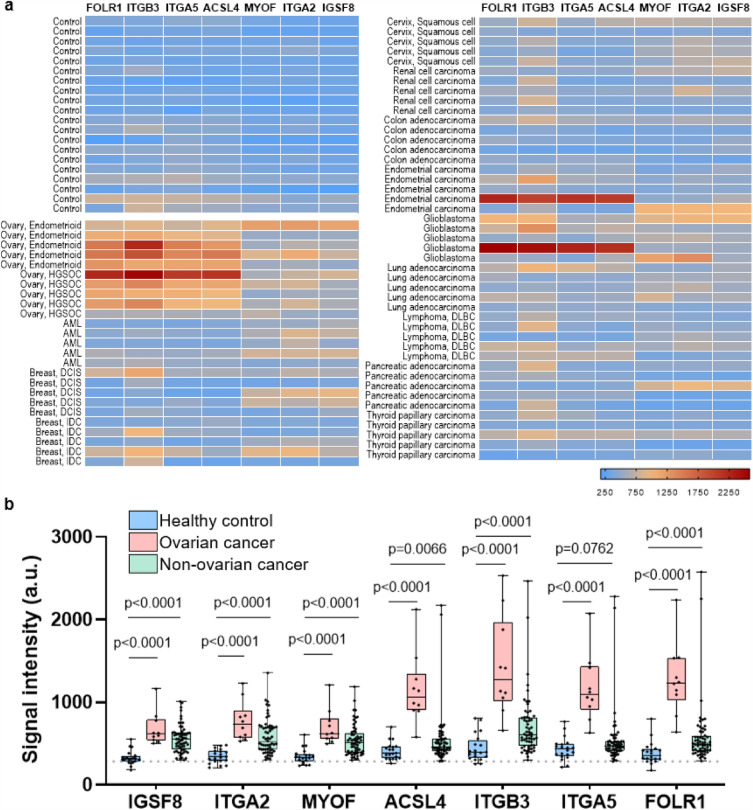
High grade serous ovarian carcinoma (HGSOC) accounts for ~ 70% of ovarian cancer cases. Non-invasive, highly specific blood-based tests for pre-symptomatic screening in women are crucial to reducing the mortality associated with this disease. Since most HGSOCs typically arise from the fallopian tubes (FT), our biomarker search focused on proteins found on the surface of extracellular vesicles (EVs) released by both FT and HGSOC tissue explants and representative cell lines. Using mass spectrometry, 985 EV proteins (exo-proteins) were identified that comprised the FT/HGSOC EV core proteome. Transmembrane exo-proteins were prioritized because these could serve as antigens for capture and/or detection. With a nano-engineered microfluidic platform, six newly discovered exo-proteins (ACSL4, IGSF8, ITGA2, ITGA5, ITGB3, MYOF) plus a known HGSOC associated protein, FOLR1 exhibited classification performance ranging from 85 to 98% in a case-control study using plasma samples representative of early (including stage IA/B) and late stage (stage III) HGSOCs. Furthermore, by a linear combination of IGSF8 and ITGA5 based on logistic regression analysis, we achieved a sensitivity of 80% with 99.8% specificity and a positive predictive value of 13.8%. Importantly, these exo-proteins also can accurately discriminate between ovarian and 12 types of cancers commonly diagnosed in women. Our studies demonstrate that these lineage-associated exo-biomarkers can detect ovarian cancer with high specificity and sensitivity early and potentially while localized to the FT when patient outcomes are more favorable.


Conflict of interest statement

A.K.G. is a co-founder of Sinochips Diagnostics, serves as a scientific advisory board member to Biovica, Clara Biotech, and Sinochips Diagnostics, and receives research funding from Predicine and VITRAC Therapeutics. Y.Z. serves as a scientific advisory board member to Clara Biotech. C.V.T., H.B.P, M.E.S. and A.K.G applied to patent ACSL4, IGSF8, ITGA2, ITGA5, ITGB3 and MYOF as early detection biomarkers for ovarian cancer. The other authors report no conflict of interest.

Figures

Figure 1
Figure 1
Enrichment and characterization of cell line and tissue explant EVs. (a) Surgical resections of healthy FT or tumor tissues were minced and used to initiate short-term tissue explants (cultured for 24 h) followed by collection of the conditioned media and processed by differential ultracentrifugation to enrich for EVs. Likewise, conditioned media from the FT and ovarian cancer cell lines shown was collected and processed. Created with BioRender.com (b) Representative NTA data. (c) Sixty (60) EV particles were imaged, and their size was measured for representative samples by TEM at x30K magnification. The mean size with s.e.m. is indicated by the error bars. (d) Shown are representative fluorescence data obtained using ExoView for FT and HGSOC tissue explant derived EVs. The EVs were captured using commonly expressed EV tetraspanins, namely, CD9, CD63 and CD81 and probed with detection antibodies conjugated to Alexa Fluor dyes: CD9-AF488 (blue), CD63-AF647 (pink) and CD81-AF555 (green). The error bars represent the mean particle count with s.e.m.
Figure 2
Figure 2
Proteomic analysis of tissue explant and cell line EVs. (a) Pipeline for filtering LC–MS/MS data to aide in selection of potential transmembrane candidate protein biomarkers. Created with BioRender.com. (b) Shown are the initial number of proteins identified in cell line EVs (blue, average of two or three EV isolations from conditioned media) and tissue explant EVs (gray, average of all samples from their respective groups). (c) Heatmap of proteomic data showing enrichment of common EV protein markers for both cell line and tissue derived EVs. (d) Venn diagram comparison of protein distribution between HGSOC cell lines and tissue explants, and (e) between FT cell lines and FT tissue explants. (f) Identification of the FT/HGSOC core proteome by comparison of common proteins between the two groups (HGSOC EVs and FT EVs). (g) Identification of transmembrane proteins within the FT/HGSOC core proteome by comparison to the SwissProt predicted transmembrane database, and (h) removal of expected/common EV proteins within the transmembrane FT/HGSOC core proteome by comparison to the Exocarta and Vesiclepedia.
Figure 3
Figure 3
Detection of predicted transmembrane proteins in FT and HGSOC cell line EVs using capillary western blotting. One antibody for each of the 45 candidate transmembrane proteins was evaluated by capillary western blotting. The 7 exo-proteins that were confirmed to be present in EVs from 6 HGSOC and 3 FT cell lines are shown. Excluded from the figure are 23 exo-proteins with non-specific bands or no detectable bands at the expected molecular weight, and 15 exo-proteins with bands at the expected molecular weight but did not meet the criteria for presence in the EVs of all tested cell lines. In addition, CD81 and FLOT1 were evaluated as these are common EV markers. Full length unprocessed blots can be found in Supplementary Fig. 6.
Figure 4
Figure 4
Immunohistochemistry staining of tissues from patients with HGSOC and FT tissue with STICs show expression of the candidate transmembrane proteins. (a) Representative IHC images from the tissue microarrays consisting of 100 patient samples containing benign FT, primary, and metastatic tumor tissue sections are shown for all markers except ITGA2; for ITGA2, tissue samples with higher IHC scores were selected for this figure. Supplementary Fig. 7 shows the IHC scores of all tissue samples used in the study. FOLR1 was included as a positive control for IHC staining. (b) p53-overexpressed STIC and p53-null STIC tissue sections from RRSO. p53 staining was done using an automated Dako Autostainer Link; a manual staining protocol was performed for the other markers. The scale bars represent 200 µm. Macro-tissue arrays of tissue sections representative of HGSOC, kidney, liver, placenta, spleen and tonsil were used as negative and positive controls. These macro-tissue arrays were also used in optimizing the antibody concentrations.
Figure 5
Figure 5
Evaluation of transmembrane exo-proteins in plasma samples using ExoProfile chips. (a) Image of an ExoProfile chip consisting of 8 nanopatterned parallel channels for EV capture. (b) Quantification of transmembrane exo-protein biomarkers on captured CD81 + EVs for HGSOC (n = 10) and healthy control (n = 20) (dotted line signifies background fluorescence from a negative control channel labeled as BKG). FOLR1 was included as a previous positive control for HGSOC. p-values were calculated using Mann–Whitney U test. (c) Area under the curve plot of receiver operating characteristic analyses for all the six markers and FOLR1 are shown.
Figure 6
Figure 6
Specificity testing of transmembrane exo-proteins in plasma samples from different cancer types using the ExoProfile chip. (a) Heatmap showing the relative intensity distribution of each exo-protein marker across 90 plasma samples comprising of 12 non-ovarian cancers commonly diagnosed in women (n = 60; 5 per each cancer type), ovarian cancer (n = 10) and healthy controls (n = 20). (b) Quantification and comparison of transmembrane exo-protein biomarkers on captured CD81 + EVs in non-ovarian cancers (n = 60), ovarian cancers (n = 10), and healthy control samples (n = 20). The dotted line represents background fluorescence from a negative control channel. p-values were calculated using Mann–Whitney U test. These samples were subjected to two separate tests on different chips, and the reported values represent the average of two experiments. AML: acute myeloid leukemia, DCIS: ductal carcinoma in situ, IDC: invasive ductal carcinoma, DLBC: diffuse large B cell lymphoma.

Update of

References

    1. Das PM, Bast RC., Jr Early detection of ovarian cancer. Biomark. Med. 2008;2:291–303. doi: 10.2217/17520363.2.3.291. - DOI - PMC - PubMed
    1. Drescher CW, et al. Impact of screening test performance and cost on mortality reduction and cost-effectiveness of multimodal ovarian cancer screening. Cancer Prev. Res. (Phila) 2012;5:1015–1024. doi: 10.1158/1940-6207.CAPR-11-0468. - DOI - PMC - PubMed
    1. van Nagell, J. R., Jr., Gallion, H. H., Pavlik, E. J. & DePriest, P. D. Ovarian cancer screening. Cancer76, 2086–2091 (1995). - PubMed
    1. Siegel RL, Miller KD, Jemal A. Cancer statistics, 2015. CA Cancer J. Clin. 2015;65:5–29. doi: 10.3322/caac.21254. - DOI - PubMed
    1. Bowtell DD. The genesis and evolution of high-grade serous ovarian cancer. Nat. Rev. Cancer. 2010;10:803–808. doi: 10.1038/nrc2946. - DOI - PubMed

Publication types