. 2023 Oct 26;13(1):18394.
doi: 10.1038/s41598-023-45718-8.

Assessment of hybrid population immunity to SARS-CoV-2 following breakthrough infections of distinct SARS-CoV-2 variants by the detection of antibodies to nucleoprotein

Affiliations

Assessment of hybrid population immunity to SARS-CoV-2 following breakthrough infections of distinct SARS-CoV-2 variants by the detection of antibodies to nucleoprotein

Gerco den Hartog et al. Sci Rep. .

Abstract

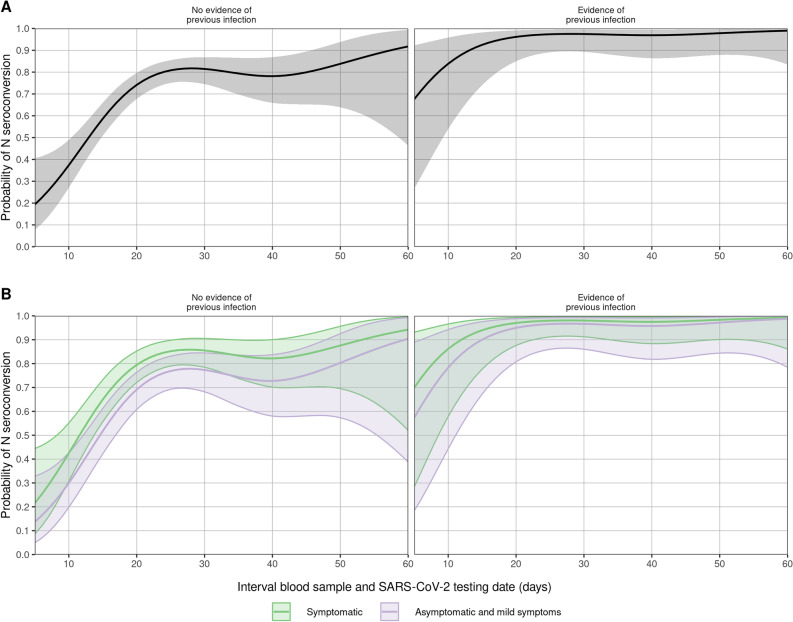
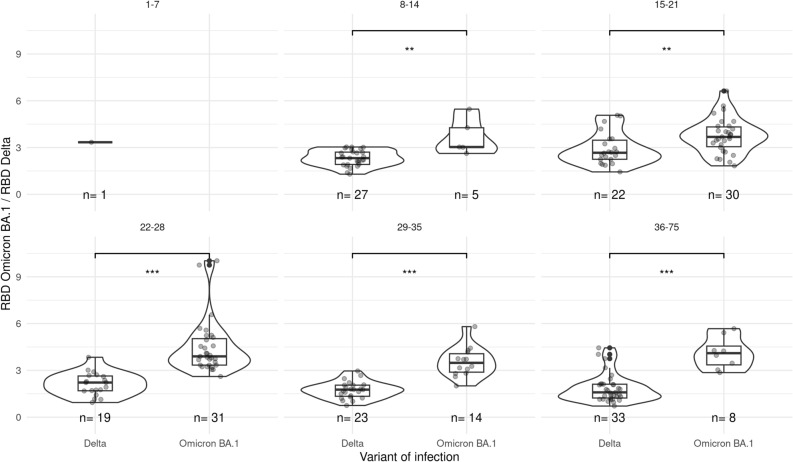
Immunity induced by vaccination and infection, referred to as hybrid immunity, provides better protection against SARS-CoV-2 infections compared to immunity induced by vaccinations alone. To assess the development of hybrid immunity we investigated the induction of Nucleoprotein-specific antibodies in PCR-confirmed infections by Delta or Omicron in vaccinated individuals (n = 520). Eighty-two percent of the participants with a breakthrough infection reached N-seropositivity. N-seropositivity was accompanied by Spike S1 antibody boosting, and independent of vaccination status or virus variant. Following the infection relatively more antibodies to the infecting virus variant were detected. In conclusion, these data show that hybrid immunity through breakthrough infections is hallmarked by Nucleoprotein antibodies and broadening of the Spike antibody repertoire. Exposure to future SARS-CoV-2 variants may therefore continue to maintain and broaden vaccine-induced population immunity.


Conflict of interest statement

The authors declare no competing interests.

Figures

Figure 1
Figure 1
Antibody levels following vaccination and breakthrough infection. (A, D, G) pre-infection antibody concentrations by time since first vaccination for N-, S1, and RBD-specific IgG, respectively (n = 598). Colors indicate the vaccination status at the time of blood collection. Measurements from the same individual are connected (gray line). (B, E, H) Post-breakthrough infection antibody concentrations by time since positive test for N-, S1-, and RBD-specific IgG, respectively (n = 520). Circle colors indicate the history of previous infection (see methods) and circles are filled by pre-infection N, S1, or RBD concentration. Absent pre-infection sample is indicated in grey. Black line shows the estimated mean serological response in not previously infected. Shaded areas represent 95% confidence envelopes. Red horizontal line indicates the seropositivity threshold for N (14.3 BAU/mL) and S1 (10.1 BAU/mL). (C, F, I) Histograms of the pre-infection and post-infection concentrations for N-, S1-, and RBD-specific IgG, respectively.
Figure 2
Figure 2
Estimated probability of N-seropositivity by time since positive test. (A) Estimates of the probability of N-seropositivity as a function of time since positive test and history of previous infection (n = 479). Shaded areas represent 95% confidence intervals/envelopes. (B) Estimates of the probability of N-seropositivity as a function of time since positive test, history of previous infection and COVID-19 symptom status (n = 474). Shaded areas represent 95% confidence intervals/envelopes.
Figure 3
Figure 3
Estimates of the mean S1 antibody levels as a function of time since infection and vaccination in not previously infected (n = 447). Panels show the different time since vaccination (30 days intervals) and x-axis the time since breakthrough infection. Orange and green indicate the persons with and without N-specific antibodies following breakthrough infection. Shaded areas represent 95% confidence intervals/envelopes. RBD estimates are shown in Fig. S2.
Figure 4
Figure 4
Ratio of the RBD Omicron BA.1 over RBD Delta serological response for Delta and Omicron BA.1 infections in not previously infected individuals. Different subplots indicate time since infection in days. See Fig. S3 for additional antigenic target ratio results. P-value is indicated with ***for < 0.001, **for < 0.01, *for < 0.05 and not significant (NS).

References

    1. WHO Coronavirus (COVID-19) Dashboard, <covid19.who.int> (2022).
    1. Eggink D, et al. Increased risk of infection with SARS-CoV-2 Omicron BA.1 compared with Delta in vaccinated and previously infected individuals, the Netherlands, 22 November 2021 to 19 January 2022. Euro. Surveill. 2022 doi: 10.2807/1560-7917.ES.2022.27.4.2101196. - DOI - PMC - PubMed
    1. Cao Y, et al. BA.2.12.1, BA.4 and BA.5 escape antibodies elicited by Omicron infection. Nature. 2022;608:593–602. doi: 10.1038/s41586-022-04980-y. - DOI - PMC - PubMed
    1. Yu J, et al. Neutralization of the SARS-CoV-2 Omicron BA.1 and BA.2 Variants. N. Engl. J. Med. 2022;386:1579–1580. doi: 10.1056/NEJMc2201849. - DOI - PMC - PubMed
    1. Andeweg SP, et al. Higher risk of SARS-CoV-2 Omicron BA.4/5 infection than of BA.2 infection after previous BA.1 infection, the Netherlands, 2 May to 24 July 2022. medRxiv. 2022 doi: 10.1101/2022.09.21.22280189. - DOI - PMC - PubMed

Publication types

Supplementary concepts