. 2023 Nov;5(11):1969-1985.
doi: 10.1038/s42255-023-00913-9. Epub 2023 Oct 26.

The glucose transporter 2 regulates CD8+ T cell function via environment sensing

Affiliations

The glucose transporter 2 regulates CD8+ T cell function via environment sensing

Hongmei Fu et al. Nat Metab. 2023 Nov.

Erratum in

  • Publisher Correction: The glucose transporter 2 regulates CD8+ T cell function via environment sensing.
    Fu H, Vuononvirta J, Fanti S, Bonacina F, D'Amati A, Wang G, Poobalasingam T, Fankhaenel M, Lucchesi D, Coleby R, Tarussio D, Thorens B, Hearnden RJ, Longhi MP, Grevitt P, Sheikh MH, Solito E, Godinho SA, Bombardieri M, Smith DM, Cooper D, Iqbal AJ, Rathmell JC, Schaefer S, Morales V, Bianchi K, Norata GD, Marelli-Berg FM. Fu H, et al. Nat Metab. 2025 Mar;7(3):634. doi: 10.1038/s42255-025-01256-3. Nat Metab. 2025. PMID: 40000839 Free PMC article. No abstract available.

Abstract

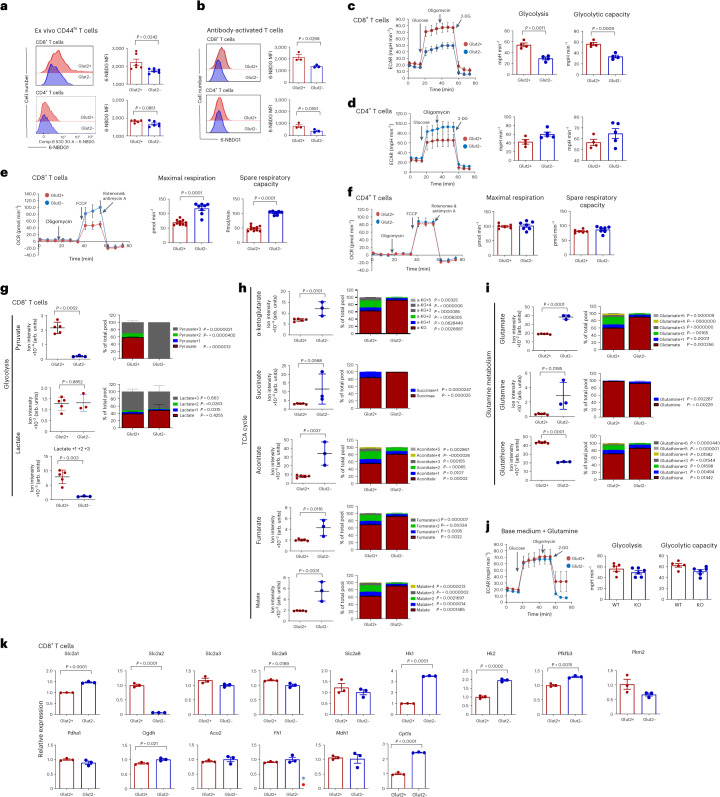
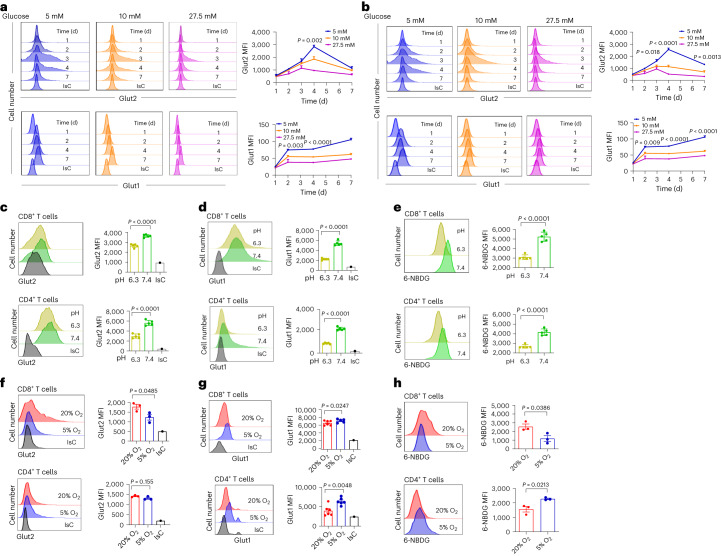
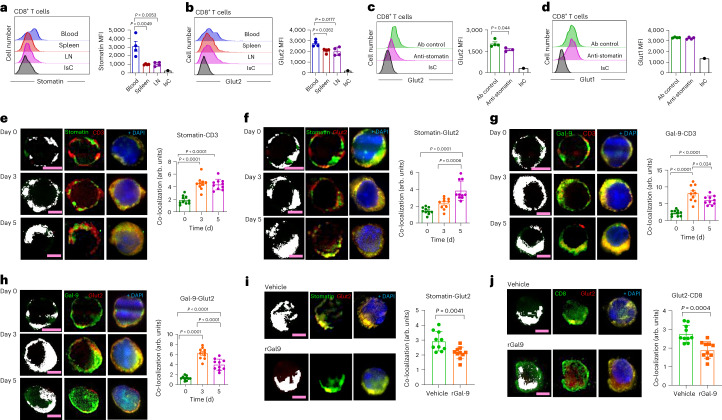
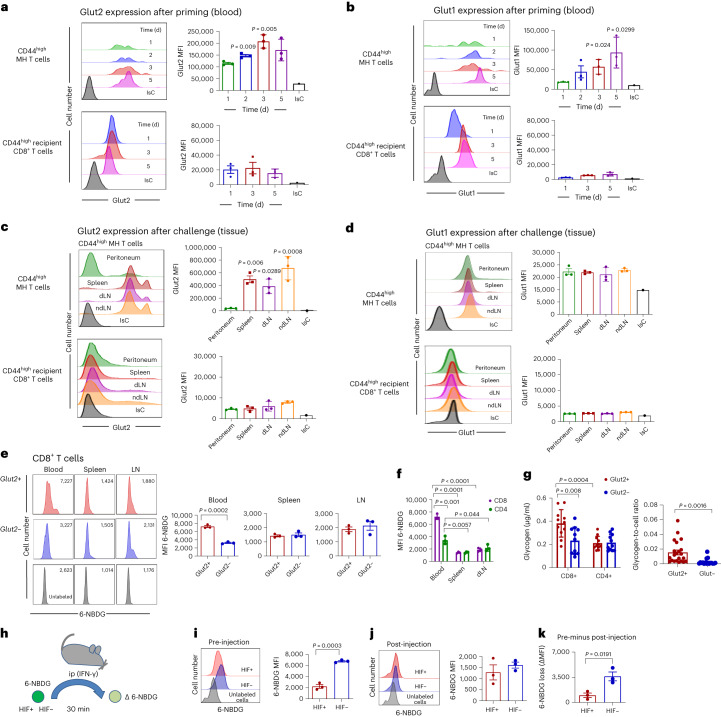
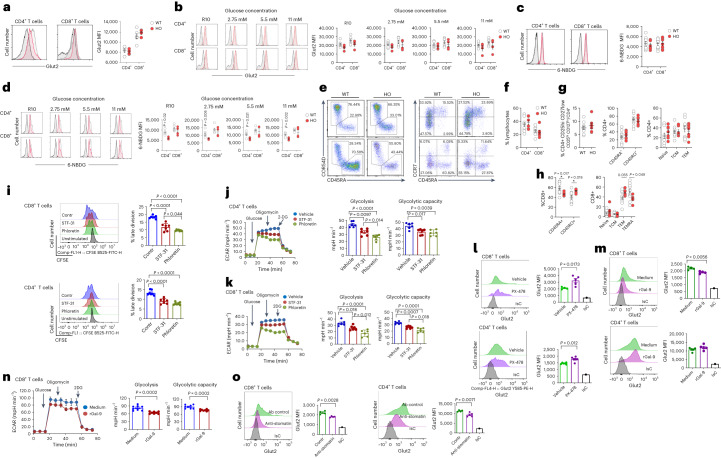
T cell activation is associated with a profound and rapid metabolic response to meet increased energy demands for cell division, differentiation and development of effector function. Glucose uptake and engagement of the glycolytic pathway are major checkpoints for this event. Here we show that the low-affinity, concentration-dependent glucose transporter 2 (Glut2) regulates the development of CD8+ T cell effector responses in mice by promoting glucose uptake, glycolysis and glucose storage. Expression of Glut2 is modulated by environmental factors including glucose and oxygen availability and extracellular acidification. Glut2 is highly expressed by circulating, recently primed T cells, allowing efficient glucose uptake and storage. In glucose-deprived inflammatory environments, Glut2 becomes downregulated, thus preventing passive loss of intracellular glucose. Mechanistically, Glut2 expression is regulated by a combination of molecular interactions involving hypoxia-inducible factor-1 alpha, galectin-9 and stomatin. Finally, we show that human T cells also rely on this glucose transporter, thus providing a potential target for therapeutic immunomodulation.


Conflict of interest statement

The authors declare no competing interests.

Figures

Fig. 1
Fig. 1. Glut2 affects T cell metabolism.
a,b, 6-NBDG uptake by ex vivo CD44hi (a) and 3-d in vitro-activated (b) mouse Glut2+ and Glut2 CD8+ and CD4+ T cells was analysed by flow cytometry. Representative histograms and mean data (±s.d.; n = 3–6, N = 2) are shown. c,d, ECAR (mpH min−1) in 2-d activated mouse Glut2+ and Glut2 CD8+ and CD4+ T cells, respectively. The bar graph shows the mean glycolysis and glycolytic capacity (±s.d., n = 3–5, N = 2). e,f, Oxygen consumption rate (OCR; pmol min−1) in 2-d activated mouse Glut2+ and Glut2 CD8+ (e) and CD4+ (f) T cells. The bar graph shows the mean maximal respiration and spare respiratory capacity (±s.d.; n = 6–10, N = 2). gi, 48 h activated mouse Glut2+ and Glut2 CD8+ T cells were incubated with 13C6-glucose for 18 h, followed by metabolite extraction for liquid chromatography–mass spectrometry (LC–MS) analysis. Fractional enrichment of 13C isotopologues related to glycolysis (g), TCA cycle (h) and glutamine metabolism (i). Column graphs show total levels of each metabolite in the samples on the left-hand side and the proportion of isotopologues of each metabolite indicated by the ‘M + n’, which designates the position in the molecule where the 13C label is found on the right-hand side. Data are presented as the mean ± s.d. (n = 3–5, N = 2). j, ECAR in 2-d activated mouse Glut2+ and Glut2 CD8+ T cells supplemented with glutamine (2 mM). The bar graph shows the mean glycolysis and glycolytic capacity (±s.d., n = 5–6, N = 1). k, Transcription of the indicated genes in 2-d activated mouse Glut2+ and Glut2 CD8+ T cells was measured by PCR with reverse transcription (RT–PCR; n = 3, N = 2). Gene expression was normalized to housekeeping genes and control Glut2+ was set as 1 (mean ± s.d.) af,j,k, unpaired, two-tailed Student’s t-test; gi, unpaired, two-tailed Student’s t-test, left columns; Mann–Whitney test, right columns. Source data
Fig. 2
Fig. 2. Glut2 contributes to CD8+ T cell function.
a, Mouse naive Glut2+ and Glut2 CD8+ and CD4+ T cells were labelled with CFSE (5 μM) and stimulated with plate-bound anti-CD3 (1 µg ml−1) and anti-CD28 (5 µg ml−1) monoclonal antibodies for 3 d. Proliferation was assessed by flow cytometry. Histograms (grey indicates unstimulated cells) and mean data from a representative experiment (n = 3, N = 2) ± s.d. are shown. b,c, Glut2+ and Glut2 chimera mice were primed and boosted (7 d apart) with IP injection of 750 µg ovalbumin protein plus 50 µg poly(I:C) adjuvant or adjuvant alone. After 7 d, T cells were separately harvested from mesenteric lymph nodes (dLN), inguinal and axillary (ndLNs) and the spleen. Expression of IFN-γ was assessed by flow cytometry. Representative dot plots are shown. Control injection with adjuvant alone and staining with an isotype-matched control antibody are shown on the right-hand side of each set. The mean number of IFN-γ+ cells from a representative experiment (n = 3, N = 2) is shown (±s.d.). Percentages are shown. d, Production of IFN-γ by mouse Glut2+ and Glut2 CD8+ T cells that were antibody activated in Tc-1 or Tc-0 polarizing conditions (Methods) was measured by flow cytometry. n = 3–4, N = 2. e, Production of granzyme B by primed (b) mouse Glut2+ and Glut2 CD8+ T cells from a representative experiment (±s.d.; n = 3, N = 2) is shown. Percentages are shown. f, T cells from Glut2+ and Glut2-deficient mice were activated by plate-bound CD3/CD28 antibodies, and differentiated toward Th0 and Th1 cells. CD107α was assessed by flow cytometry. Representative dot plots and histograms are shown (±s.d.; n = 10, N = 2). af, unpaired, two-tailed Student’s t-test. Source data
Fig. 3
Fig. 3. Glut2 is required for optimal CD8+ T cell-mediated anti-allograft and anti-tumour immunity.
a,b, Glut2+ or Glut2 female mice received skin grafts from female B6.Kd donors, to avoid confounders due to anti-HY responses (a). CD8+ T cell depletion was achieved by IP injection of 200 μg anti-CD8 at days –1 and 1 (b). P values of the mean time of rejection are indicated within the graphs (n = 8–10, N = 1). c, EO771 cells were injected into the mammary glands of female Glut2+ or Glut2 C57BL/6J mice (n = 10). The mean values of tumour volume (mm3) are reported (±s.d., n = 10, N = 1). df, Tumour tissue was embedded in paraffin for H&E staining (d) for assessment of necrosis score (e) and the percentage of TILs (f) (±s.d., n = 6, N = 1). gi, Immunofluorescence staining of CD3, CD4, CD8 and DAPI in OCT-embedded tumour sections was analysed and quantified for the percentage of CD3+CD4+ T cells (h), and the percentage of CD3+CD8+ T cells (i) (±s.d., n = 7, N = 1). j,k, T cells from tumour and spleen were assessed for surface expression of Glut2 (j) and Glut1 (k) by flow cytometry. Delta changes of MFI in Glut2 and Glut1 expression (±s.d.; n = 10, N = 1) were determined by subtraction of isotype control from antibody staining. a,b, log-rank (Mantel–Cox) test; ck, unpaired, two-tailed Student’s t-test. Source data
Fig. 4
Fig. 4. Regulation of Glut expression by environmental factors.
a,b, Mouse naive T cells were activated by antibodies in medium containing different concentrations of glucose for 7 d before assessing surface Glut2 and Glut1 expression by CD8+ (a) and CD4+ (b) T cells by flow cytometry. Histograms and mean data (±s.d.) from a representative experiment (n = 3, N = 3) are shown. ce, Mouse T cells were activated by antibodies in medium with a pH of either 6.3 or 7.4 for 3 d before analysing surface expression of Glut2 (c), Glut1 (d) (n = 5, N = 3) and 6-NBDG uptake (e) (n = 3, N = 3) by flow cytometry. Histograms and mean data (±s.d.) from a representative experiment are shown. fh, Mouse naive T cells were activated by antibodies for 2 d and subsequently maintained in high (20%) or low (5%) oxygen concentrations for the last 24 h of culture (n = 5–6, N = 3). Surface expression of Glut2 (f), Glut1 (g) and 6-NBDG uptake (h) (n = 3, N = 3) were analysed by flow cytometry. Histograms and mean data (±s.d.) from a representative experiment are shown. a,b, one-way analysis of variance (ANOVA); c–h, unpaired, two-tailed Student’s t-test. Source data
Fig. 5
Fig. 5. Regulation of Glut2 expression by HIF-1α and galectin-9.
a,b, Mouse naive CD8+ T cells were activated by antibodies in the presence or absence of the HIF-1α selective inhibitor PX-478 (20 µM) before analysing surface expression of Glut2 (a) and Glut1 (b). Histograms and mean data ± s.d. from a representative experiment (n = 3, N = 3) are shown. c, C57BL/6J mice received an IP injection of PX-478 (20 mg per kg body weight) for 3 d. Representative histograms and mean data (±s.d.) of Glut2 expression by CD8+ T cells are shown (n = 3, N = 2). d, Glut2 expression by mouse HIF+ or HIF+ CD44hi CD8+ T cells. Representative histograms and mean data (±s.d.) are shown (n = 3, N = 3). eg, Transcription of Glut1 (e), Glut2 (f) and Gal-9 (g) by mouse HIF+ or HIF CD44hi CD8+ T cells measured by RT–PCR. Gene expression was normalized to the housekeeping gene tubulin. Control HIF was set as 1. Error bars show the s.d. (n = 3, N = 3). h, Surface expression of Gal-9 by mouse HIF+ and HIF+ CD8+ T cells. Histograms and mean data (±s.d.) from a representative experiment are shown (n = 9–10, N = 2). i, Mouse naive CD8+ T cells were activated by antibodies for 2 d and subsequently maintained in high (20%) or low (5%) oxygen incubators for a further 24 h. Gal-9 surface expression was then analysed. Histograms and mean data (±s.d.) from a representative experiment are shown (n = 3, N = 2). j, Glut2 expression by mouse Gal-9+ or Gal-9 CD44hi T cells. Histograms and mean data (±s.d.) from a representative experiment are shown (n = 6, N = 2). k, Mouse naive T cells were activated by antibodies in the presence or absence of recombinant Gal-9 (30 nM) with or without the Gal-9 competitive inhibitor lactose (30 mM) before analysing surface expression of Glut2. Histograms and mean data (±s.d.) from a representative experiment (n = 3, N = 2). l,m, ECAR and OCR by antibody-activated mouse Gal-9+ and Gal-9CD8+ T cells. l,m, Mean glycolysis and glycolytic capacity (±s.d.; n = 5, N = 2) (l) and mean maximal respiration and spare respiratory capacity (m) are shown (±s.d.; n = 5, N = 2). n,o, Gal-9+ and Gal-9 mice received skin grafts from BL/6.Kd donors (n). CD8+ T cells were depleted by IP injection of 200 μg anti-CD8 at days –1 and +1 (o) (n = 7–8, N = 1). ad,ej,l,m, unpaired two-tailed Student’s t-test; k, one-way ANOVA; n,o, log-rank (Mantel–Cox) test. Source data
Fig. 6
Fig. 6. Stomatin and galectin-9 mediate regulation of Glut2 expression.
a,b, Surface expression of stomatin (a) and Glut2 (b) by mouse CD44hi CD8+ T cells from blood, spleen and LNs was analysed for by flow cytometry. Histograms and mean data (±s.d.) from a representative experiment (n = 3, N = 2). c,d, Mouse naive CD8+ T cells were activated by antibodies in the presence of anti-stomatin or isotype control antibody before analysing Glut2 (c) and Glut1 (d) expression by flow cytometry. Histograms and mean data (±s.d.) from a representative experiment (n = 4, N = 2). eh, Mouse naive CD8+ T cells were activated by antibodies for 3 d or 5 d before analysing surface expression of Glut2, stomatin, Gal-9 and CD3 by deconvolution microscopy. Representative deconvolution and channel co-localization images of stomatin/CD3 (e), stomatin/Glut2 (f), Gal-9/CD3 (g) and Gal-9/Glut2 (h) of non-permeabilized cells at day 0 (naive) and at day 3 and day 5 after activation are shown. Co-localization of different channels is indicated by the white areas in the cell images and presented as the percentage of cell volume. Bar charts show the mean percentage of cell volume (±s.d.) in at least n = 10 cells from a representative of N = 3 experiments. i,j, Mouse naive T cells were activated by antibodies in the presence or absence of recombinant Gal-9 (30 nM) before analysing surface expression of Glut2, stomatin and CD8+ by deconvolution microscopy. Representative deconvolution and channel co-localization images of stomatin/Glut2 (i) and Glut2/CD8 (j) are shown. Co-localization of different channels is indicated by the white areas in the cell images and presented as the percentage of cell volume. Bar charts show the mean percentage of cell volume (±s.d.) in at least n = 10 cells from a representative of N = 3 experiments. a,b,eh, one-way ANOVA; c,d,i,j, unpaired two-tailed Student’s t-test. Source data
Fig. 7
Fig. 7. Glut2 expression and function in T cells in vivo.
ad, Purified CD45.2+ CD8+ naive T cells from MH mice were IV transferred (107) into CD45.1+ recipients, some of which received male splenocytes (2 × 107) IP a day later. Tail blood was sampled on the indicated days, and Glut2 (a) and Glut1 (b) expression by T cells were analysed. Recipient CD45.1+ CD44hi T cells are shown for comparison. After 7 d, mice received male splenocytes (2 × 107) and 1.2 µg CXCL10 IP. T cells were harvested from peritoneum, spleen, dLNs and ndLNs 16 h later. Expression of Glut2 (c) and Glut1 (d) by CD44hi MH T cells and CD44hi recipient CD8+ T cells was assessed by flow cytometry. Representative histograms are shown. The bar graphs show the MFI measured for Glut2 and Glut1 (±s.d.) in a representative experiment (n = 3, N = 2). e,f, Glut2+ or Glut2 mice were starved for 2 h before IV injection of 6-NBDG (5 mg per kilogram body weight). Thirty minutes later, T cells were harvested from the indicated organs and 6-NBDG uptake was assessed. Representative histograms are shown. The bar graphs (e) show 6-NBDG MFI (±s.d.; n = 3, N = 2). f, Comparison of 6-NBDG uptake by CD8+ and CD4+ T cells from different tissues (±s.d.; n = 3, N = 2). g, Glycogen content in 3-d activated mouse Glut2+ and Glut2 naive T cells was measured as described in the Methods. Data were normalized by protein content (mean ± s.d.; n = 11, N = 1). Right, glycogen-to-cell ratios measured by transmission electron microscope (±s.d.; n = 22, N = 1). hj, Mouse CD45.2+HIF-1+ or HIF-1 naive CD8+ T cells were activated by antibodies for 3 d, labelled with 6-NBDG and injected IP (107) in CD45.1+ mice that had received IFN-γ IP 48 h previously to induce inflammation (h). 6-NBDG uptake by HIF+ and HIF T cells measured before injection (i) and in T cells retrieved from the peritoneal lavage 30 min after injection (j). Representative histograms are shown. The bar graphs show the MFI ± s.d. (n = 3, N = 3). k, Loss of incorporated 6-NBDG was calculated by subtracting the 6-NBDG MFI after injection to the pre-injection values (±s.d.; n = 3, N = 2). af, one-way ANOVA; gk, unpaired two-tailed Student’s t-test. Source data
Fig. 8
Fig. 8. Glut2 is expressed by, and is functional in, human T cells.
ad, GLUT2 expression (a and b) and 6-NBDG uptake (c and d) by human CD4+ and CD8+ T cells from WT and age-matched and sex-matched homozygous carriers of SLC2A2 SNP (HO) ex vivo (a and c) or after 2 d of antibody activation in complete RPMI (R1) or glucose-free medium reconstituted with the indicated concentrations of glucose (b and d); representative histograms (grey line indicates controls, red line indicates SLC2A2 SNP carriers, black indicates FMO control staining) and mean data measured in the indicated number of individuals ± s.e.m., n = 4–10 per group, N = 1. eh, Representative dot plots and percentage of circulating human CD4+ and CD8+ T cells (e) and their subsets (f and g, respectively) in WT and HO individuals: regulatory T cells (CD4+CD25hiCD127lo), naive (CD45RA+CCR7+), central memory (TCM, CD45RACCR7+), effector memory (TEM, CD45RACCR7) and terminally differentiated effector memory T cells (TEMRA, CD45RA+CCR7; ±s.d.; n = 7 per group, N = 1). i, CFSE (5 µM)-labelled human CD8+ and CD4+ T cells were activated by antibodies for 4 d in the presence of Glut1 inhibitor (STF-31, 1.25 µM) or dual inhibitor (phloretin, 75 µM) or vehicle added for the last 24 h. Representative histograms and mean data representative of three independent experiments performed in triplicate are shown (±s.d.; n = 7, N = 1). j, ECAR, mean glycolysis and glycolytic capacity in 4-d activated human CD4+ T cells treated with Glut1 inhibitor (STF-31, 1.25 µM) or dual inhibitor (phloretin, 75 µM) or vehicle control. (±s.d., n = 6, N = 1). k, ECAR, mean glycolysis and glycolytic capacity in 4-d activated human CD8+ T cells treated with Glut1 inhibitor (STF-31, 1.25 µM) or dual inhibitor (phloretin, 75 µM) or vehicle control. (±s.d., n = 6, N = 1). l, Glut2 expression by antibody-activated human naive T cells (6 d) in the presence or absence of the HIF-1α selective inhibitor PX-478 (20 µM) (±s.d.; n = 4–5, N = 1). m, Glut2 expression by antibody-activated human naive T cells (6 d) in the presence or absence of recombinant Gal-9 (30 nM) (±s.d.; n = 4–5, N = 1). n, ECAR, mean glycolysis and glycolytic capacity in 4-d activated human CD8+ T cells treated with recombinant Gal-9 (30 nM) or vehicle control. (±s.d., n = 8, N = 1). o, Human naive CD3+ T cells were activated by antibodies for 6 d in the presence of anti-stomatin (2.5 μg ml−1) or isotype control antibody before analysing surface expression of Glut2 (n = 4–5, N = 1). ah,ko, unpaired two-tailed Student’s t-test; ik, one-way ANOVA. Source data
Extended Data Fig. 1
Extended Data Fig. 1. Glut2 expression by immune cells and its effects on T cell metabolism.
(a) Gating strategy for the identification of immune cell subsets (applies to all Figures and extended data Figures). (b) Expression of Glut2 by ex vivo mouse naïve (CD44low) and memory (CD44high) CD8+ and CD4+ T cells was analysed by flow cytometry. Histograms and mean data from a representative experiment (±SD; n = 3, N = 3) are shown. (c) Representative confocal microscopy images of DAPI, Glut2 and CD8 expression by antibody-activated CD8 + T cells. (d) Representative histograms of Glut2 expression by the indicated immune cell subsets ex-vivo (n = 2, N = 2). (e-f) Mouse naïve T cells were activated with plate-bound anti-CD3 (1 µg/ml) and anti-CD28 (5 µg/ml) monoclonal antibodies for 1-7 days before analysing surface Glut2 (e) and Glut1 (f) expression by flow cytometry. Histograms and mean data from a representative experiment (±SD; n = 3, N = 3) are shown. (g) T cells were purified from Glut2+ and Glut2- mice and Glut2 transcription was measured by RT-PCR. Gene expression was normalized to housekeeping gene and control Glut2+ set as 1 (±SD; n = 3, N = 3). (h) The ability of CD44low T cells to take up the fluorescent glucose analogue 6-NBDG were analysed by flow cytometry. Histograms and mean data from a representative experiment (±SD; n = 3, N = 3) are shown. (i-j) Energy metabolism was assessed by extracellular acidification rate (ECAR, mpH/min) in (i) activated CD8 + T cells, (j) activated CD4+ T cells treated with Glut1 inhibitor (STF-31, 1.25 µM) or Glut2 and Glut1 dual inhibitor (Phloretin, 75 µM) or vehicle. Bar graphs show mean glycolysis and glycolytic capacity (±SD; n = 4-6, N = 2). (k) Transcription of the indicated genes in 2-day activated Glut2+ and Glut2- CD4+ T cells was measured by RT-PCR. Gene expression was normalized to tubulin and control Glut2+ set as 1. (±SD; n = 4-6, N = 2). b, h, unpaired, two-tailed Student’s t-test; e-f, i-j, One-way ANOVA; g, k, Kruskal-Wallis test. Source data
Extended Data Fig. 2
Extended Data Fig. 2. Glut 2 expression and function in T cells.
(a) Live and single cells from thymi of Glut2+and Glut2-chimera mice were analysed by flow cytometry. Representative dot-plots (left) and mean percentage of double-positive, CD4-single-positive, CD8-single-positive, and double-negative subsets (right) are shown (±SD; n = 3, N = 1). (b) T cells from the spleen and lymph nodes of Glut2+and Glut2-mice were analysed for expression of CD3, CD4, CD8, and FoxP3. Representative dot-plots (left) and mean percentage of CD4, CD8, and regulatory (Treg) subsets (right) are shown (±SD; n = 3, N = 1). (c-d) CD8+ and CD4+ effector memory T cells (Tem) and central memory T cells (Tcm) in ex-vivo T cells (c) and antibody-stimulated (6 days) naïve T cells (d) from Glut2+ and Glut2-. Representative dot-plots are shown on the top panel. The percentage of Tem and Tcm cells are shown on the bottom panel (±SD; n = 3, N = 1). Unpaired, two-tailed Student’s t-test. (e-f) Expression of the indicated molecules by naive (e) and antibody-activated (6 days) (f) CD4+ and CD8 + T cells was analysed by flow cytometry (n = 3). Source data
Extended Data Fig. 3
Extended Data Fig. 3. Cytokine production by Glut2- primed T cells and function of Glut2- antigen presenting cells.
(a-b) Glut2+ or Glut2- chimera mice were primed and boosted (7 days apart) with intra-peritoneal (IP) injection of 750 µg ovalbumin protein plus 50 µg Poly(I:C) adjuvant or adjuvant alone. After 7 days, T cells were separately harvested from mesenteric lymph nodes (draining LN, dLN), inguinal and axillary (non-draining LNs, ndLN) and the spleen. Expression of IL-17 (a) and FoxP3 (b) were assessed by flow cytometry. Representative dot plots are shown. Staining with an isotype-matched control antibody and adjuvant control alone are shown on the right-hand side of each set of dot plots. The mean number of IL-17+ and FoxP3+ from three independent experiments of identical design is shown on the bottom panel (±SD, n = 8, N = 2). (c-d) Effect of Glut2 on APCs. T cells from Mata Hari mice (107/mouse) and Marilyn mice (107/mouse) were labelled with CFSE (5 μM) and injected intravenously into Glut2+ and Glut2- female recipients. Twenty-four hours later, recipient mice received male splenocytes. Five days after immunization, T cells were separately harvested from mesenteric LN (draining LN, dLN), spleen, and inguinal and axillary (non-draining LNs, ndLN). Marilyn T cells were identified as CD4 + Vb6 + CD45.2 + , and donor Mata Hari T cells were identified as CD8 + Vb8.3 + CD45.2 + . CFSE dilution was assessed by flow cytometry. The proliferation index is shown (n = 4, N = 2). Source data
Extended Data Fig. 4
Extended Data Fig. 4. Regulation of Glut2 expression by HIF1α.
(a-b) T cells were incubated overnight at 20% or 5% oxygen. Expression of Hif1α was measured by deconvolution microscopy (a) or flow cytometry (b). Representative images and histograms, and mean corrected total cell fluorescence (CTCF, a) or MFI (b) in a representative experiment are shown (±SD; n = 4-5 N = 2). (c) CD8 + T cells were purified from HIF+ or HIF- mice and Hif1α mRNA expression was measured by RT-PCR. Hif1α gene expression was normalized to housekeeping gene tubulin (±SD; n = 4 N = 3). (d-e) Glut2 (d) and Gal-9 (e) expression by 3-day antibody-activated purified naïve CD4+ T cells from Hif1+ or HIF- mice were assessed for surface expression of Glut2 by flow cytometry. Representative histograms and mean data in a representative experiment (±SD; n = 10, N = 3) (f) Glut2 expression by 3-day antibody-activated naïve Gal-9+ or Gal-9- CD4+ T cells was assessed by flow cytometry. Histograms and mean data from a representative experiment are shown (±SD; n = 8, N = 3). (g) Naïve CD4+ T cells were antibody-activated for 3 days in the presence or absence of recombinant Gal-9 (30 nM) with or without the Gal-9 competitive inhibitor lactose (30 mM) before analysing surface expression of Glut2 by flow cytometry. Representative histograms and mean data from a representative experiment are shown (±SD; n = 3, N = 2). (h) Expression of Gal-9 by 3-day antibody-activated CD4+ and CD8 + T cells was analysed by flow cytometry. The mean data of a representative experiment performed in triplicate is shown (±SD; n = 10 N = 3). a-b, unpaired, two-tailed Student’s t-test; c, Kruskal-Wallis test; g, One-way ANOVA. Source data
Extended Data Fig. 5
Extended Data Fig. 5. Regulation of Glut2 expression by Stomatin.
(a) Expression of Stomatin mRNA by naïve and 3-day antibody-activated CD8 + T cells from Glut2+ or Glut2- mice was measured by RT-PCR. Stomatin gene expression was normalized to housekeeping gene tubulin (±SD; n = 3, N = 3). (b) T cells were antibody-activated in the presence of isotype control or anti-stomatin antibody at different concentrations before analysing Glut2 expression by flow cytometry. Mean data from a representative experiment are shown (±SD; n = 5, N = 2). (c) Purified CD8 + T cells were activated with plate-bound anti-CD3 (1 µg/ml) and anti-CD28 (5 µg/ml) monoclonal antibodies for 3 or 5 days before analysing surface expression of Glut2, stomatin and Gal-9 by decovolution microscopy imaging. (d) In some experiments, recombinant hGal-9 (30 nM) or vehicle control was added for 24 hours before staining. Bar charts show the corrected total cell fluorescence (CTCF) taken at the indicated time points. (±SD; c: n = 6, N = 2; d: n = 3, N = 2). a, Kruskal-Wallis test; b-c, One-way ANOVA; d, Unpaired, two-tailed Student’s T-test. Source data
Extended Data Fig. 6
Extended Data Fig. 6. Physiologic expression and function Glut2 in CD8+ T cells.
(a-b) Purified CD45.2+ Mata Hari CD8+ naïve T cells (MH) were adoptively transferred (107) into CD45.1+ recipients (N, naïve), some of which (P, primed) received male splenocytes IP a day later. After 7 days, P and N mice received antigenic male splenocytes (2 × 107) and 1.2 µg of the chemokine CXCL10 IP. T cells were also separately harvested from peritoneum, spleen, mesenteric LN (draining, dLN), and axillary LN (non-draining, ndLN) 16 hours later. The presence of primed CD44hi (P) and naïve CD44low (N) MH T cells CD8 + T cells was assessed by flow cytometry. Representative dot-plots and the mean percentage of MH T cell subset retrieved from the indicated sites in a representative experiment are shown (±SD; n = 3, N = 2). (c) Glut2+ or Glut2- mice were starved for 2 hours before IV injection of 6-NBDG (5 mg/kg). 30 minutes later, CD4+ T cells were harvested from blood, spleen, and LN and 6-NBDG uptake assessed. Representative histograms are shown. The bar graphs show the mean fluorescence intensity (MFI) of 6-NBDG (±SD; n = 3, N = 2). (d-e) 6-NBDG uptake in naïve CD44low CD8+ (d) and CD4+ (e) T cells from different tissues in the experiments described above (±SD; n = 3, N = 2). (f) Representative transmission electron microscopy images (magnification 3800X) of glycogen content in 3-day activated CD8+ Glut2+ and Glut2- naive T cells. White arrows point to glycogen deposits. Scale bar is indicated in each picture. (N = 2) (g-h) Antibody-activated (3 days) CD45.2 + HIF1+ or HIF1- CD8 + T cells were labelled with 6-NBDG and injected IP in CD45.1+ mice which had received IFN-γ ip 48 hours previously. (g) Standard curve of fluorescence measurement for various known 6-NBDG concentrations, from which the formula Y = 2017X + 4.274 is calculated. ‘Y’ is florescence reading and ‘X’ is 6-NBDG concentration (μM). (h) Mean concentrations of 6-NBDG in the peritoneal fluid (±SD; n = 6, N = 2). a-b, One-way ANOVA; h, Unpaired, two-tailed Student’s T-test. Source data
Extended Data Fig. 7
Extended Data Fig. 7. Function of Glut2 in human T cells.
(a-c) Mean percentage of proliferating CD4+ and CD8 + T cells from wild type (WT) and matched age and sex homozygous carriers of SLC2A2 SNP (HO) after 6 days of antibody activation in complete RPMI medium (a), or in glucose-free medium reconstituted with 2.75 mM, 5.5 mM or 11 mM glucose (b-c) ( ± SEM; n = 4-9, N = 1). (d-e) Percentage of IFN-γ+ total, CD4+ and CD8 + T cells from wild type and matched age and sex carriers of SLC2A2 SNP after 2 or 6 days of activation in complete RPMI medium or glucose-free DMEM reconstituted with 2.75 mM, 5.5 mM or 11 mM glucose, 2 and 6 days after antibody activation ( ± SEM; n = 4-9, N = 1). (f) Extracellular acidification rate (ECAR, mpH/min) and oxygen consumption rate (OCR; pmol/min) in 4-day activated human CD4+ T cells treated with recombinant Gal-9 (30 nM) or vehicle control. The bar graph shows the mean glycolysis, glycolytic capacity, maximal respiration, and spare respiratory capacity ( ± SEM, n = 7-8, N = 1). Unpaired, two-tailed Student’s T-test. Source data
Extended Data Fig. 8
Extended Data Fig. 8. Regulation of Glut2 expression in CD8+ T cells.
(a) Upon T cell activation expression of Glut 2 is upregulated on the T cell surface, where it localizes in lipid rafts via association with Stomatin. Stomatin competes with Galectin-9 (Gal-9) which segregates Glut2 in the non-raft membrane, where it is internalized. (b) Once T cells reach the circulation, they are exposed to increased glucose concentration, oxygen tension, and physiological pH which, by inhibiting HIF1α activation and subsequent Gal-9 transcription, further promote Glut2 expression, glucose uptake and storage as Glycogen. (c) Once in the inflammatory site, a drop in oxygen tension and pH upregulate Gal-9 expression, removal of Glut2 from lipid raft domains and subsequent internalization. This prevents passive loss of intracellular glucose in conditions of low extracellular availability.

References

    1. Geltink, R. I. K., Kyle, R. L. & Pearce, E. L. Unraveling the complex interplay between T cell metabolism and function. Annu. Rev. Immunol.36, 461–488 (2018). - PMC - PubMed
    1. Asnagli, H. & Murphy, K. M. Stability and commitment in T helper cell development. Curr. Opin. Immunol.13, 242–247 (2001). - PubMed
    1. Halle, S., Halle, O. & Forster, R. Mechanisms and dynamics of T cell-mediated cytotoxicity in vivo. Trends Immunol.38, 432–443 (2017). - PubMed
    1. MacIver, N. J., Michalek, R. D. & Rathmell, J. C. Metabolic regulation of T lymphocytes. Annu. Rev. Immunol.31, 259–283 (2013). - PMC - PubMed
    1. Cao, Y., Rathmell, J. C. & Macintyre, A. N. Metabolic reprogramming towards aerobic glycolysis correlates with greater proliferative ability and resistance to metabolic inhibition in CD8 versus CD4 T cells. PLoS ONE9, e104104 (2014). - PMC - PubMed

MeSH terms

Substances

LinkOut - more resources