. 2023 Oct 26;6(1):1089.
doi: 10.1038/s42003-023-05456-z.

Biological age estimation using circulating blood biomarkers

Affiliations

Biological age estimation using circulating blood biomarkers

Jordan Bortz et al. Commun Biol. .

Abstract

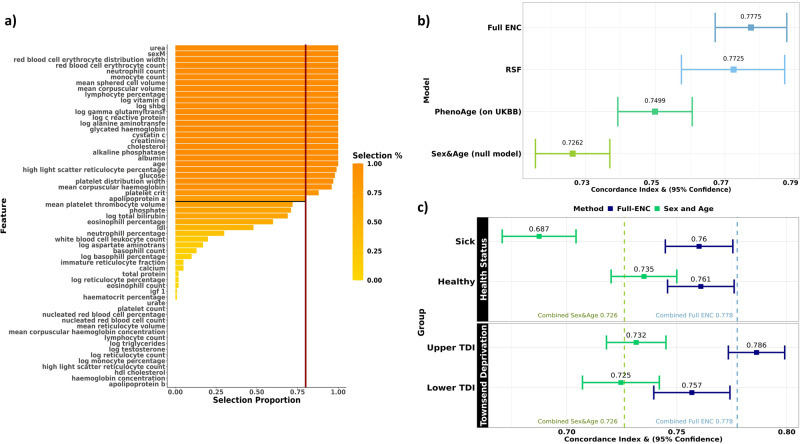
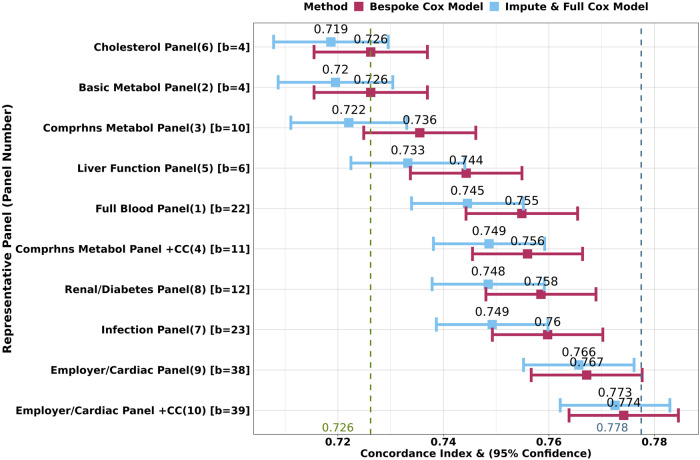
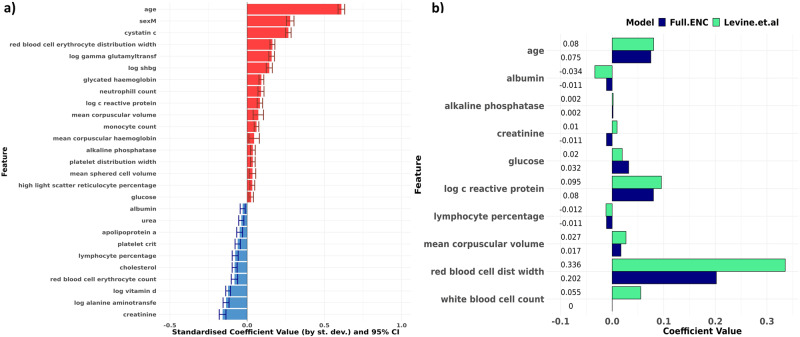
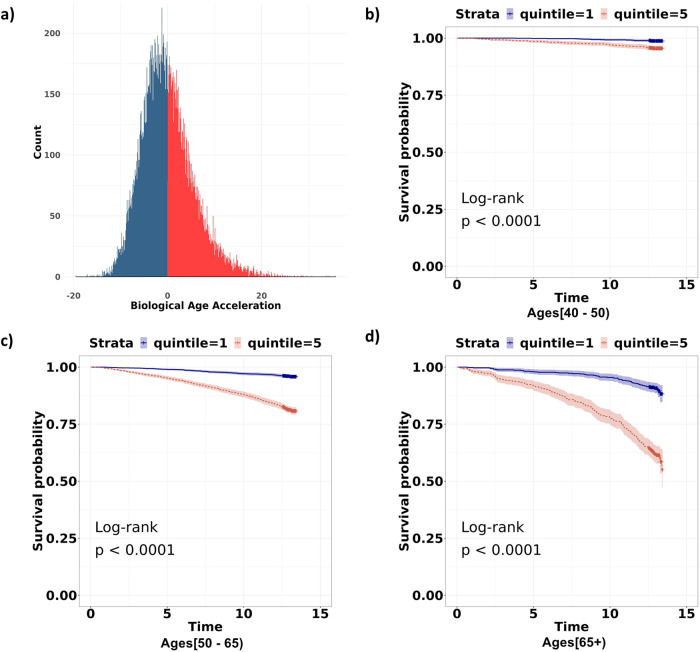
Biological age captures physiological deterioration better than chronological age and is amenable to interventions. Blood-based biomarkers have been identified as suitable candidates for biological age estimation. This study aims to improve biological age estimation using machine learning models and a feature-set of 60 circulating biomarkers available from the UK Biobank (n = 306,116). We implement an Elastic-Net derived Cox model with 25 selected biomarkers to predict mortality risk (C-Index = 0.778; 95% CI [0.767-0.788]), which outperforms the well-known blood-biomarker based PhenoAge model (C-Index = 0.750; 95% CI [0.739-0.761]), providing a C-Index lift of 0.028 representing an 11% relative increase in predictive value. Importantly, we then show that using common clinical assay panels, with few biomarkers, alongside imputation and the model derived on the full set of biomarkers, does not substantially degrade predictive accuracy from the theoretical maximum achievable for the available biomarkers. Biological age is estimated as the equivalent age within the same-sex population which corresponds to an individual's mortality risk. Values ranged between 20-years younger and 20-years older than individuals' chronological age, exposing the magnitude of ageing signals contained in blood markers. Thus, we demonstrate a practical and cost-efficient method of estimating an improved measure of Biological Age, available to the general population.


Conflict of interest statement

The authors declare the following competing interests: during preparation of this manuscript, P.K.J. and J.B. were paid consultants to Humanity Inc, a company focussed on measuring and developing interventions for Biological Age. L.K. was an employee of Humanity Inc. A.G. was formerly a paid consultant of Humanity Inc. M.G. and P.W. are founders of Humanity Inc and are employees and hold ordinary shares. P.K.J., M.G. and P.W. are partly remunerated under a Humanity Inc share option scheme. P.K.J. is founder of Geromica, a consultancy providing advice on measurement of health and aging. M.C.-H. holds shares in the O-SMOSE company and has no conflict of interest to disclose. Consulting activities conducted by the company are independent of the present work. All other authors declare no competing interests.

Figures

Fig. 1
Fig. 1. The Full Elastic-Net Cox model performs similarly to the Random Survival Forest and produces robust mortality risk predictions across both healthy and sick groups, and across groups of differing socio-economic status.
a Selection proportions of each feature as a percentage of the 100 Elastic-Net iterations performed, ranked from highest to lowest. The adopted selection threshold of 80% is indicated in red. b Forest plot comparing the C-Index values (and 95% CI) of (1) a Cox model using sex and age only (null model), (2) the PhenoAge model applied on the Scottish UKBB data, (3) our RSF and (4) our Elastic-Net derived Cox-model (Full ENC). c Comparison of C-Index values of the Full ENC and sex-and-age-only null models for (i) Healthy and Sick groups and (ii) for Lower and Higher rated Townsend Deprivation indexed groups. Across both stratifications, C-Index values of the Full ENC were significantly higher than those produced by the null model, with non-overlapping, or near non-overlapping* confidence intervals, indicating that the Full ENC model provides a statistically significant uplift in predictive ability. The dashed vertical lines represent the C-index values of the Full ENC and the null model on the full Scottish test set. *Whilst the separate confidence intervals of the Full ENC model and the null model visually overlap for the “Healthy” and “Lower TDI” groups, the T-test for the contrast shows a significant (p<5%) difference in C-Index values.
Fig. 2
Fig. 2. Imputing out-of-panel biomarkers and using the Full ENC model did not substantially reduce predictive accuracy compared to bespoke models for each representative panel.
Comparison of concordance values across bespoke models vs imputed ENC models, for each of the 10 real-world representative blood panels, on the Scottish test set. Sex and age were also included as (unpenalised) features in all models. The number in brackets next to the panel name indicates the panel number as per Supplementary Table 3. The number in square brackets indicates the count of biomarkers (b=) in the panel. The performance of the impute-then-Full-ENC method is similar to that of the bespoke models, especially for the more comprehensive panels. The green dashed vertical line indicates the 0.726 C-Index of the (sex and chronological age only) null model, whilst the blue line indicates the 0.778 C-Index of the Full ENC model with all 25 selected biomarkers measured. “+CC” indicates the addition of cystatin C to the panel (panels 4 and 10).
Fig. 3
Fig. 3. Our results confirm relationships suggested by Levine et al.’s PhenoAge model, and additionally suggest that cystatin C is the biomarker of primary importance in biological age estimation.
a Bar chart showing standardised Cox model coefficients and 95% confidence intervals (log hazard scale) of the Full ENC model developed using stably selected variables, ranked in descending order. Coefficients are standardised (i.e. rescaled) by multiplying by the standard deviation of the variable concerned. Red indicates that higher levels increase mortality hazard; blue indicates that higher levels reduce mortality hazard. Apart from age and sex, cystatin C appears to have the strongest effect size. b Comparison of coefficient values between Levine et. al’s PhenoAge coefficients (green) and our Elastic-Net derived Cox model (blue). Model coefficients are similar across both models. Our ENC model selected individual WBC components (monocytes, neutrophils and lymphocytes) rather than overall WBC count. Measurement units for biomarkers were the same across both models.
Fig. 4
Fig. 4. Biological Age Acceleration values range between −20 and 20, and reflect mortality risk even in same-age groups.
a Distribution of estimated BAA values on the test set. Blue indicates a negative BAA (biological age < chronological age), and red indicates a positive BAA (biological age > chronological age). The distribution is largely symmetric around 0, with most values ranging between −20 and 20. bd Kaplan-Meier curves comparing survival probabilities for the top and bottom BAA quintiles for each of the three age categories in the test set. Blue indicates the bottom quintile (largest negative BAA values) whilst red indicates the top quintile (largest positive BAA values). Notable differences are observed between quintiles, especially at older ages.

References

    1. Baker GT, III, Sprott RL. Biomarkers of aging. Exp. Gerontol. 1988;23:223–239. doi: 10.1016/0531-5565(88)90025-3. - DOI - PubMed
    1. Moqri M, et al. Biomarkers of aging for the identification and evaluation of longevity interventions. Cell. 2023;186:3758–3775. doi: 10.1016/j.cell.2023.08.003. - DOI - PMC - PubMed
    1. Jylhävä J, Pedersen NL, Hägg S. Biological age predictors. EBioMedicine. 2023;21:29–36. doi: 10.1016/j.ebiom.2017.03.046. - DOI - PMC - PubMed
    1. Horvath S, Raj K. DNA methylation-based biomarkers and the epigenetic clock theory of ageing. Nat. Rev. Genet. 2018;19:371–384. doi: 10.1038/s41576-018-0004-3. - DOI - PubMed
    1. Frenck RW, Jr, Blackburn EH, Shannon KM. The rate of telomere sequence loss in human leukocytes varies with age. Proc. Natl Acad. Sci. USA. 1998;95:5607–5610. doi: 10.1073/pnas.95.10.5607. - DOI - PMC - PubMed

Publication types