. 2024 May;20(5):594-604.
doi: 10.1038/s41589-023-01460-w. Epub 2023 Oct 26.

A genetically encoded tool to increase cellular NADH/NAD+ ratio in living cells

Affiliations

A genetically encoded tool to increase cellular NADH/NAD+ ratio in living cells

Xingxiu Pan et al. Nat Chem Biol. 2024 May.

Abstract

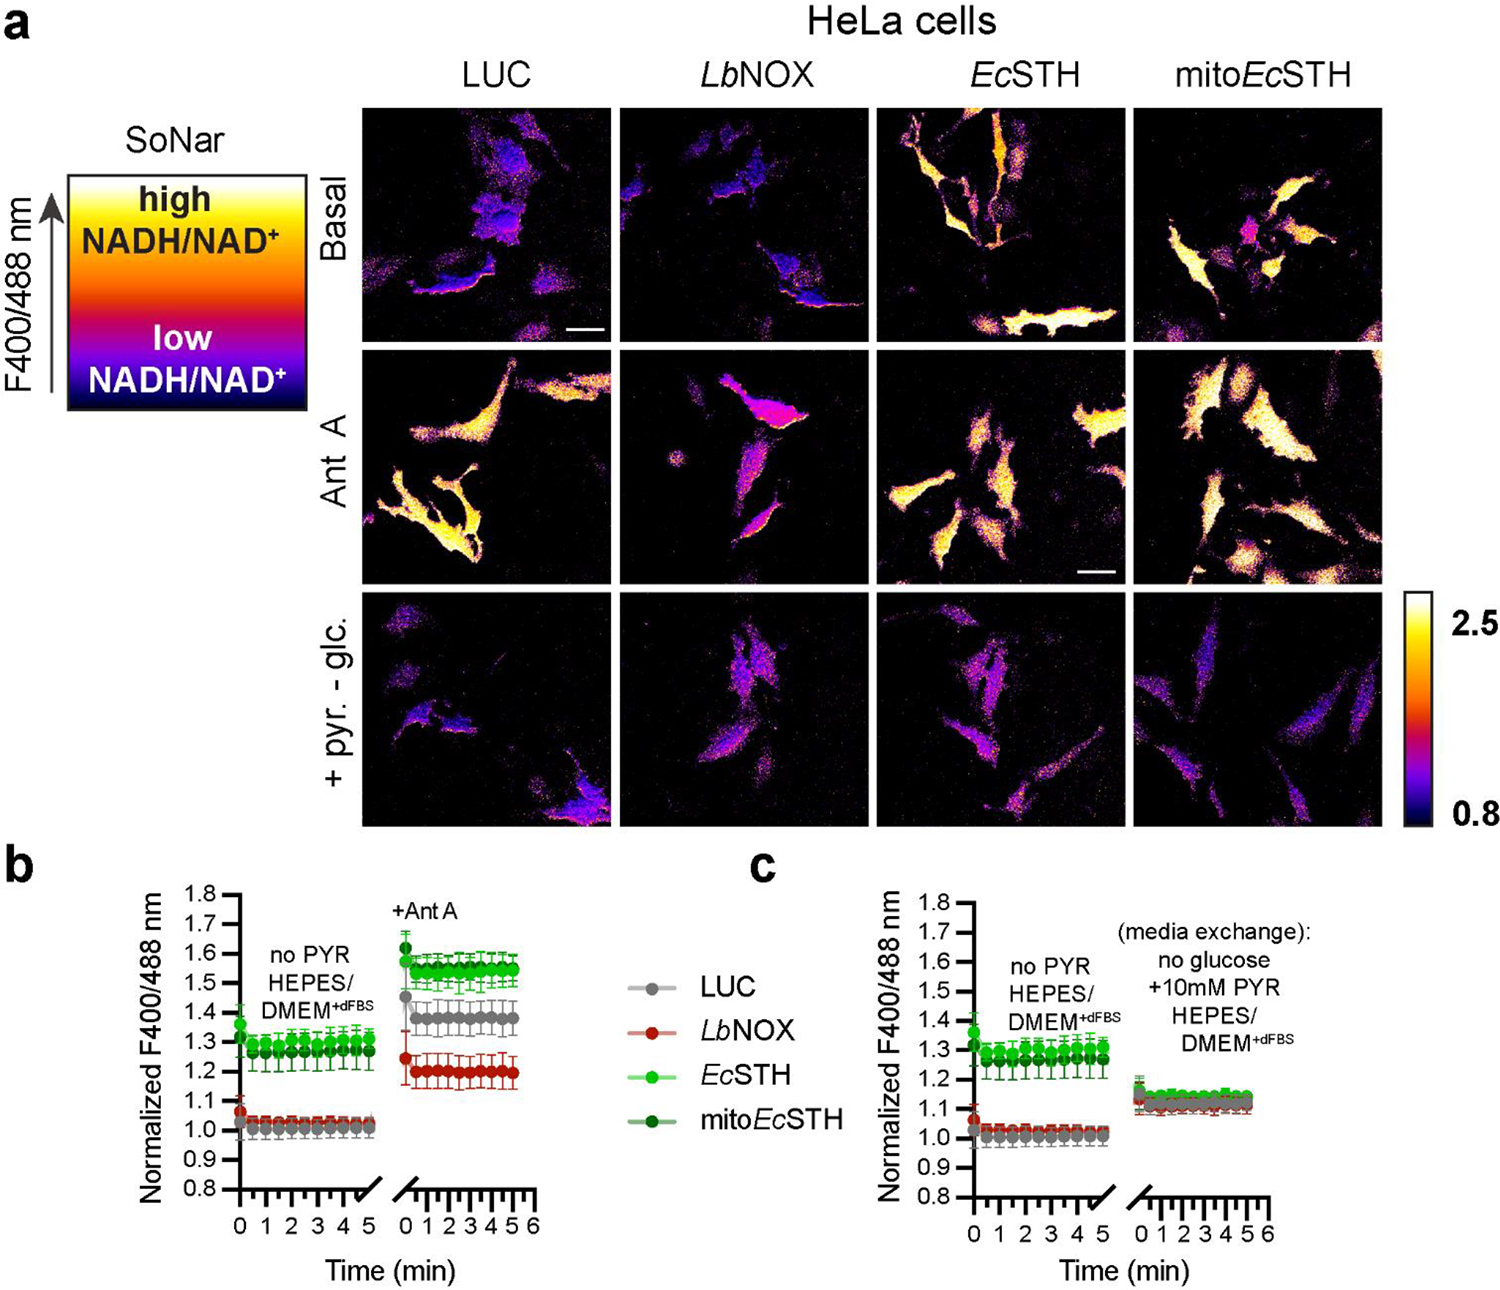
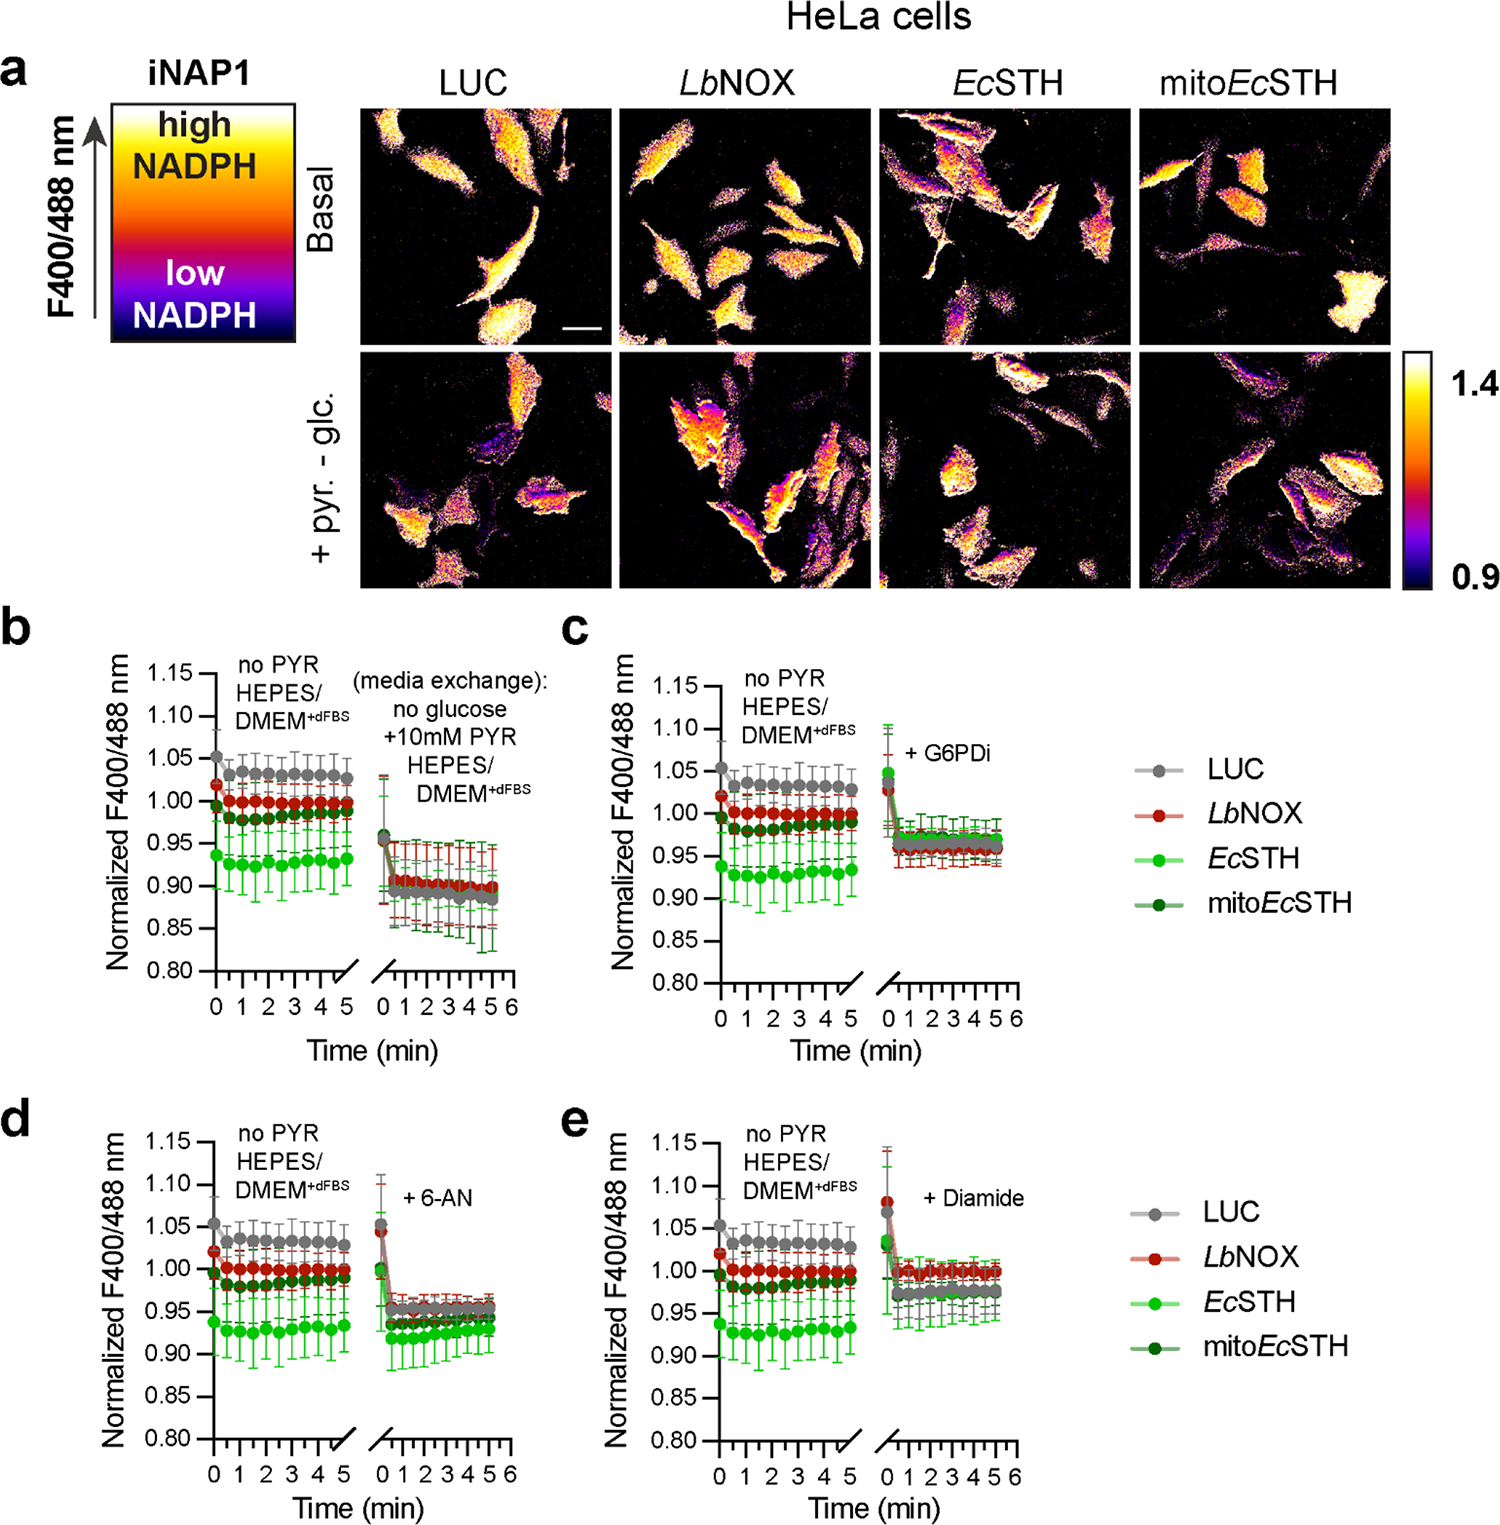
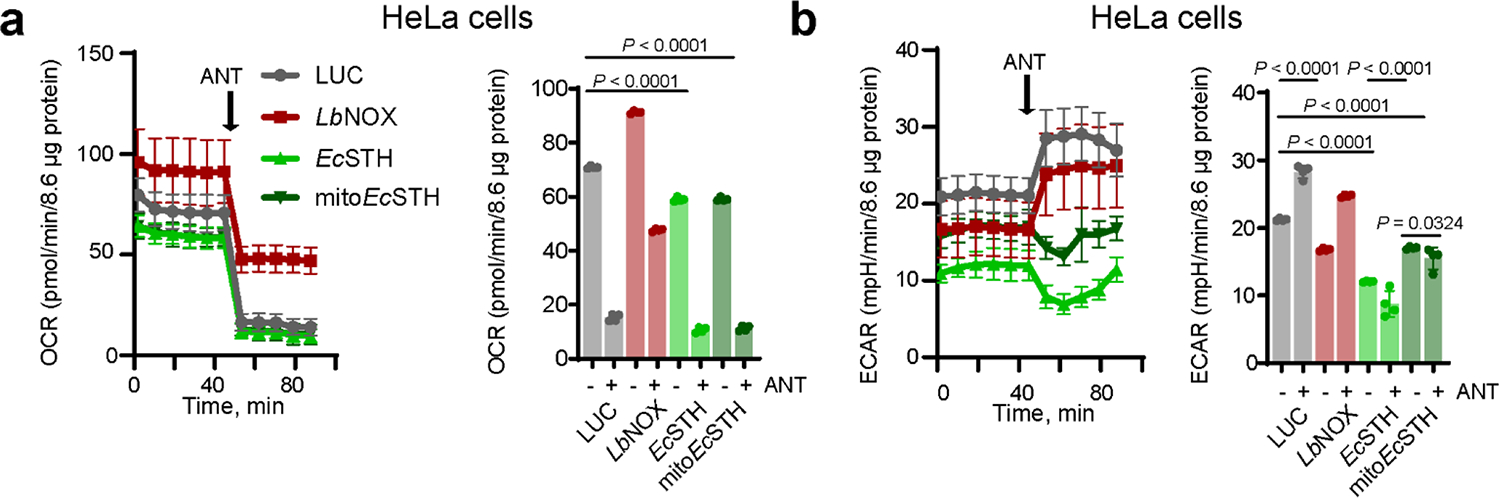
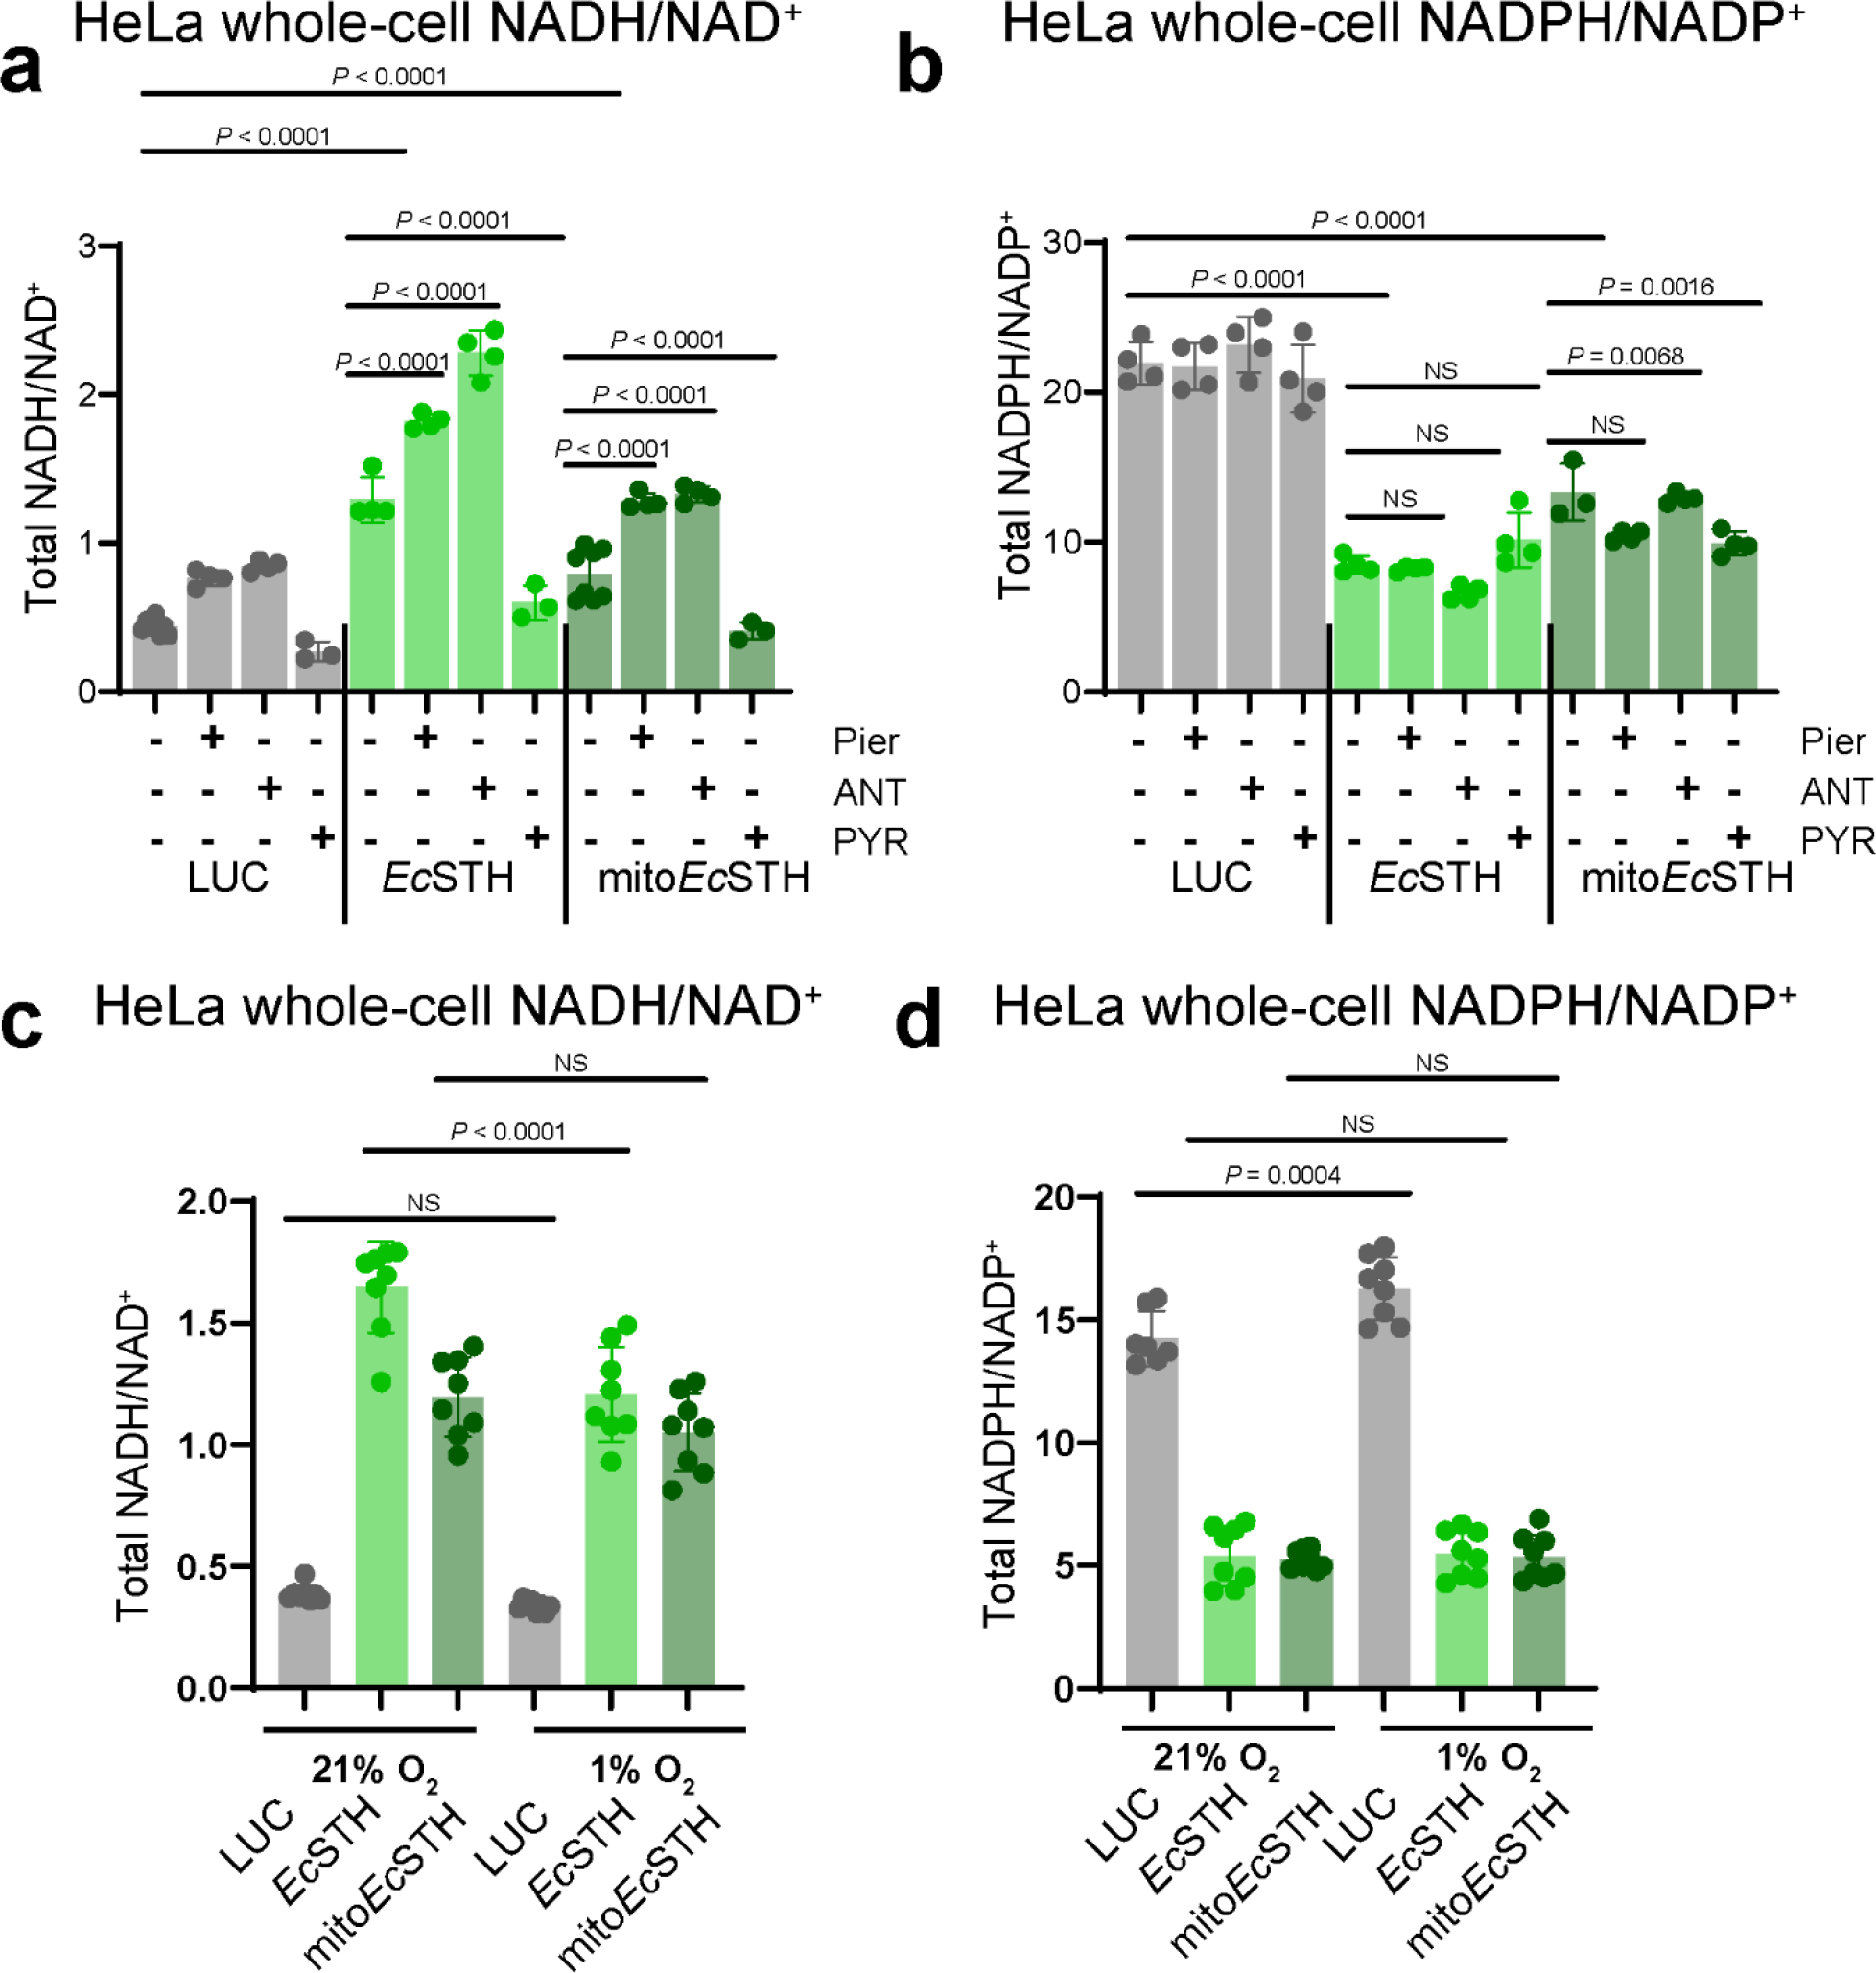
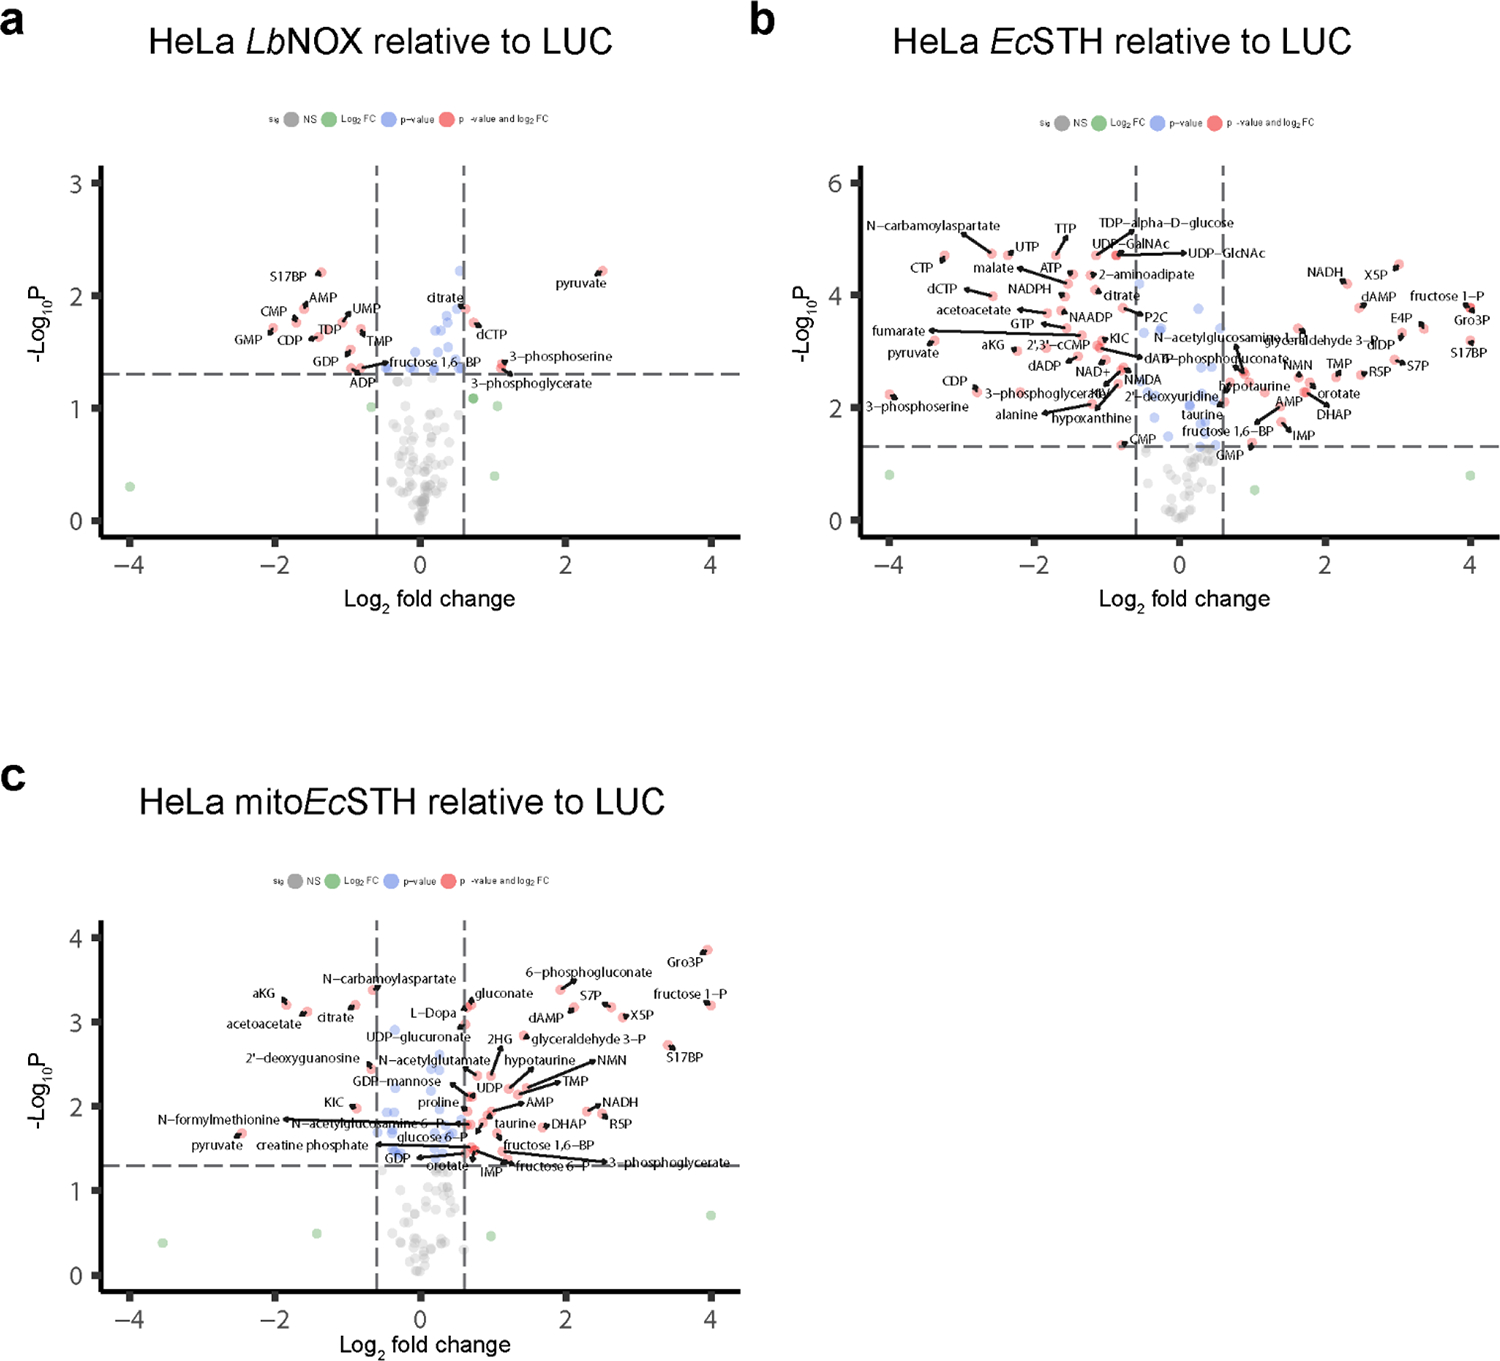
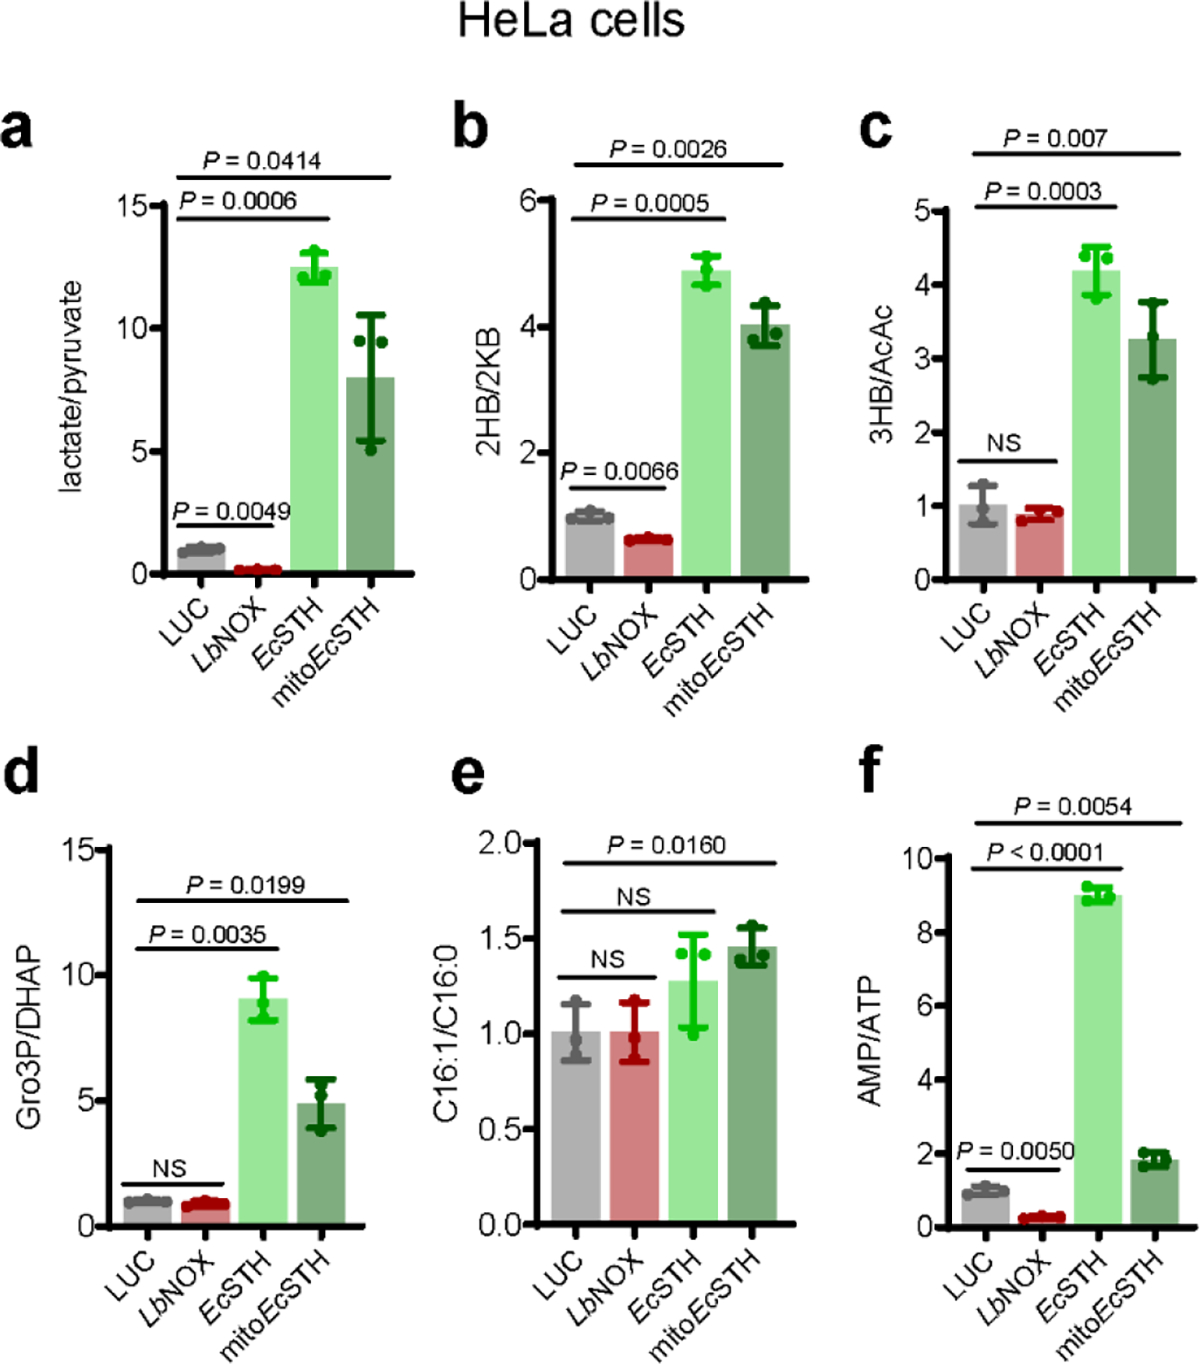
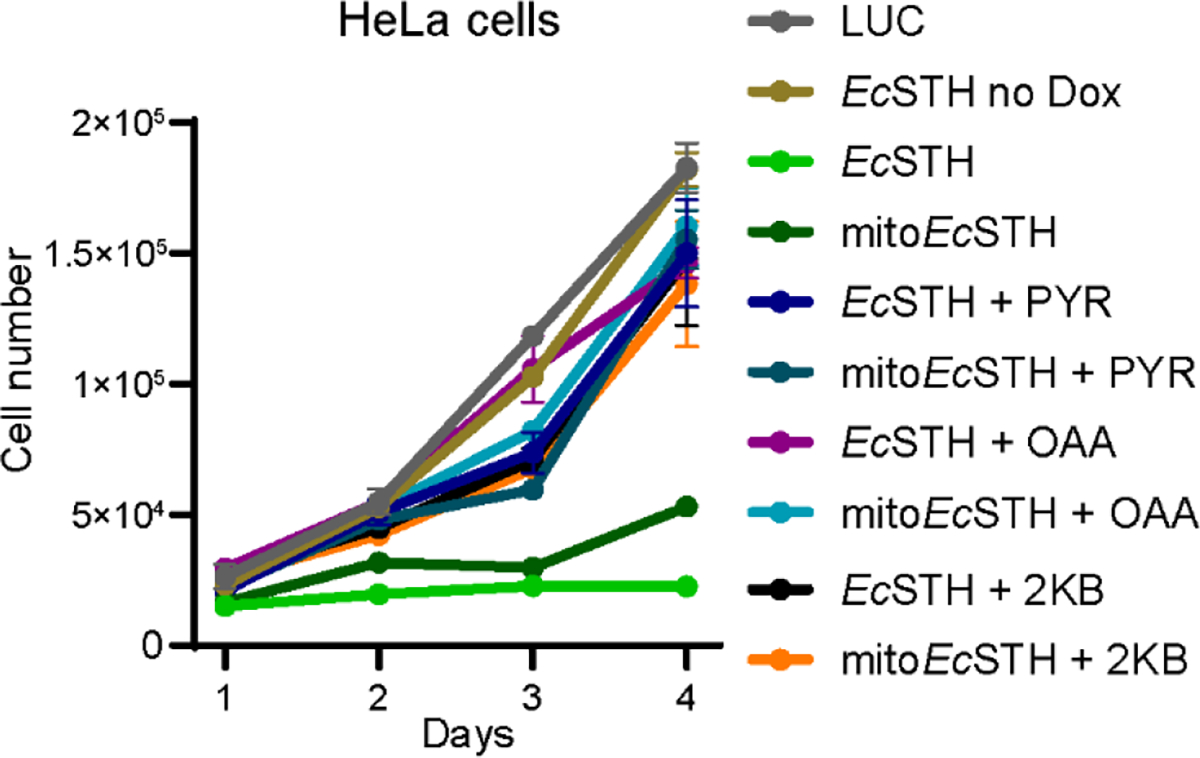
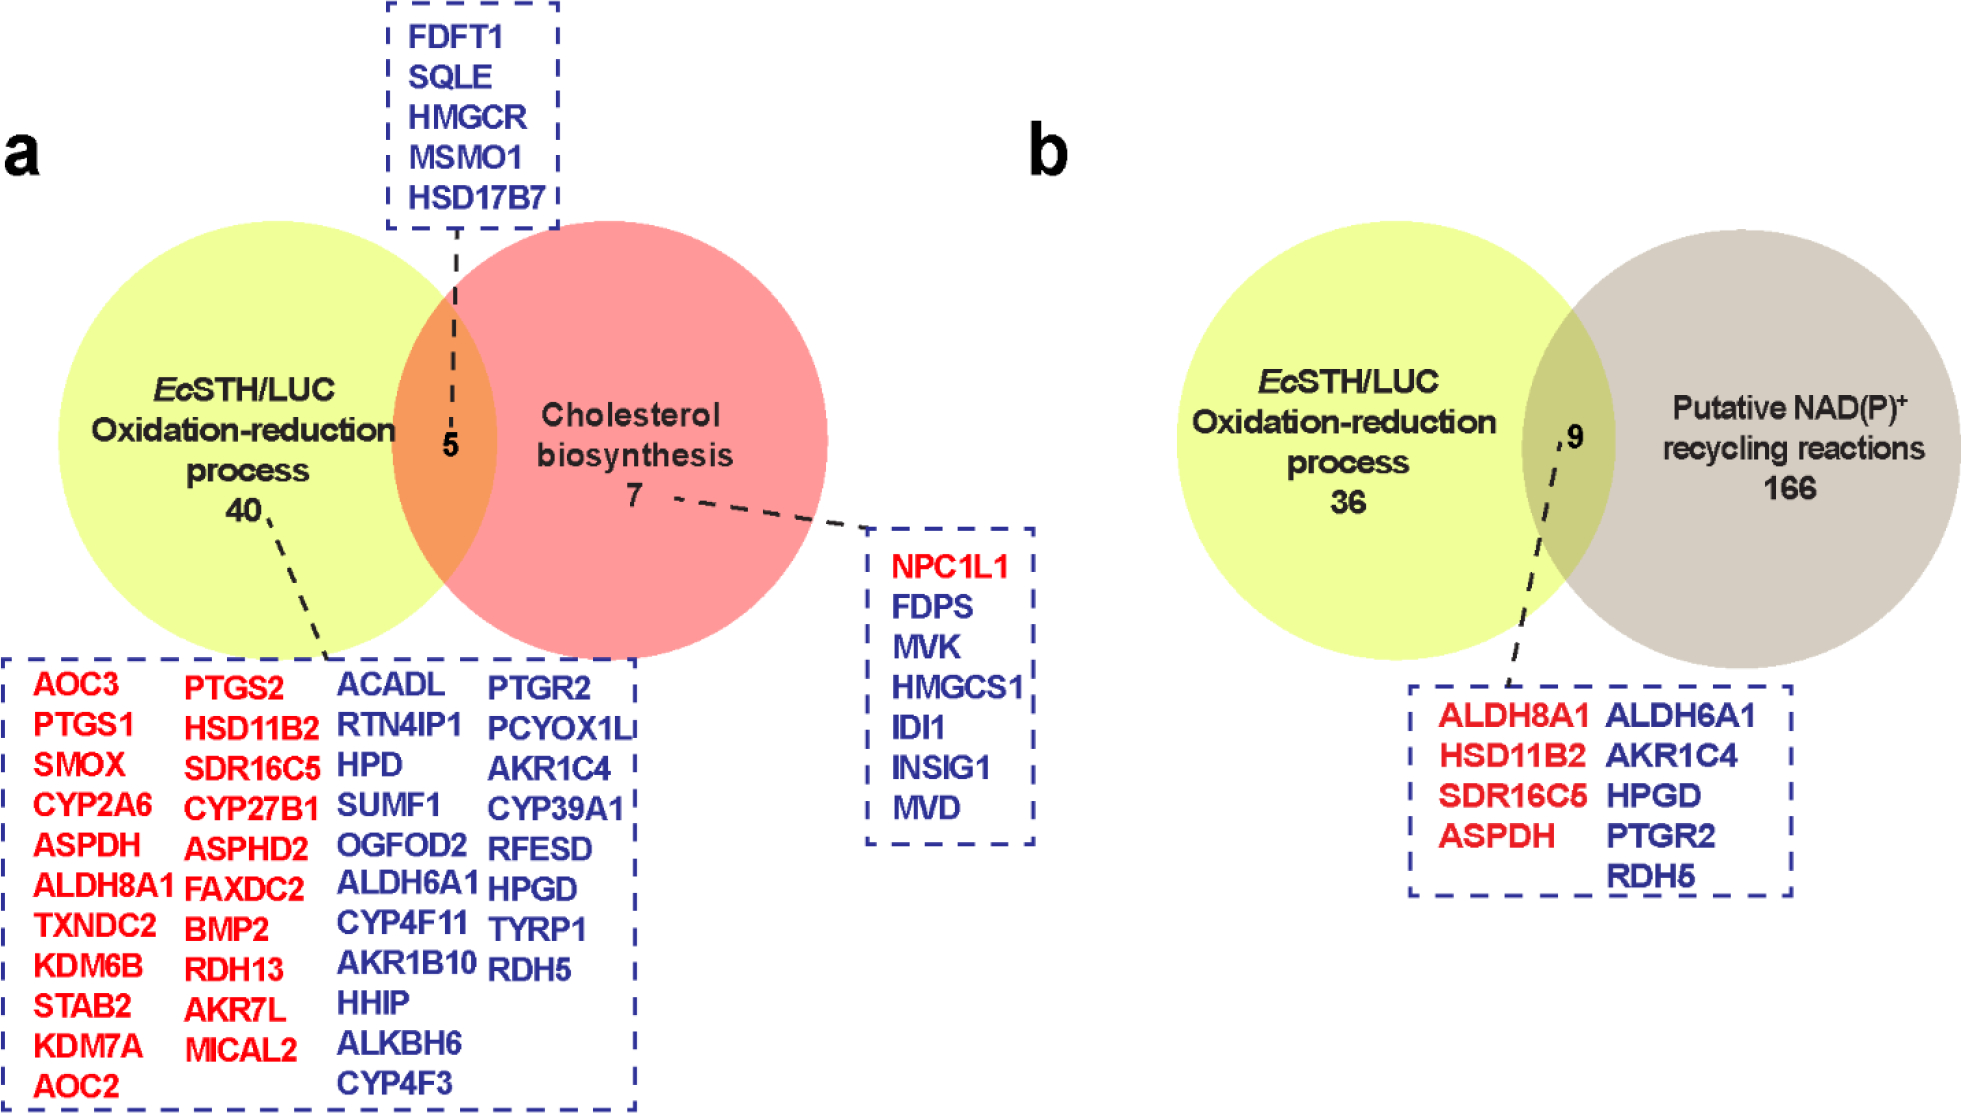
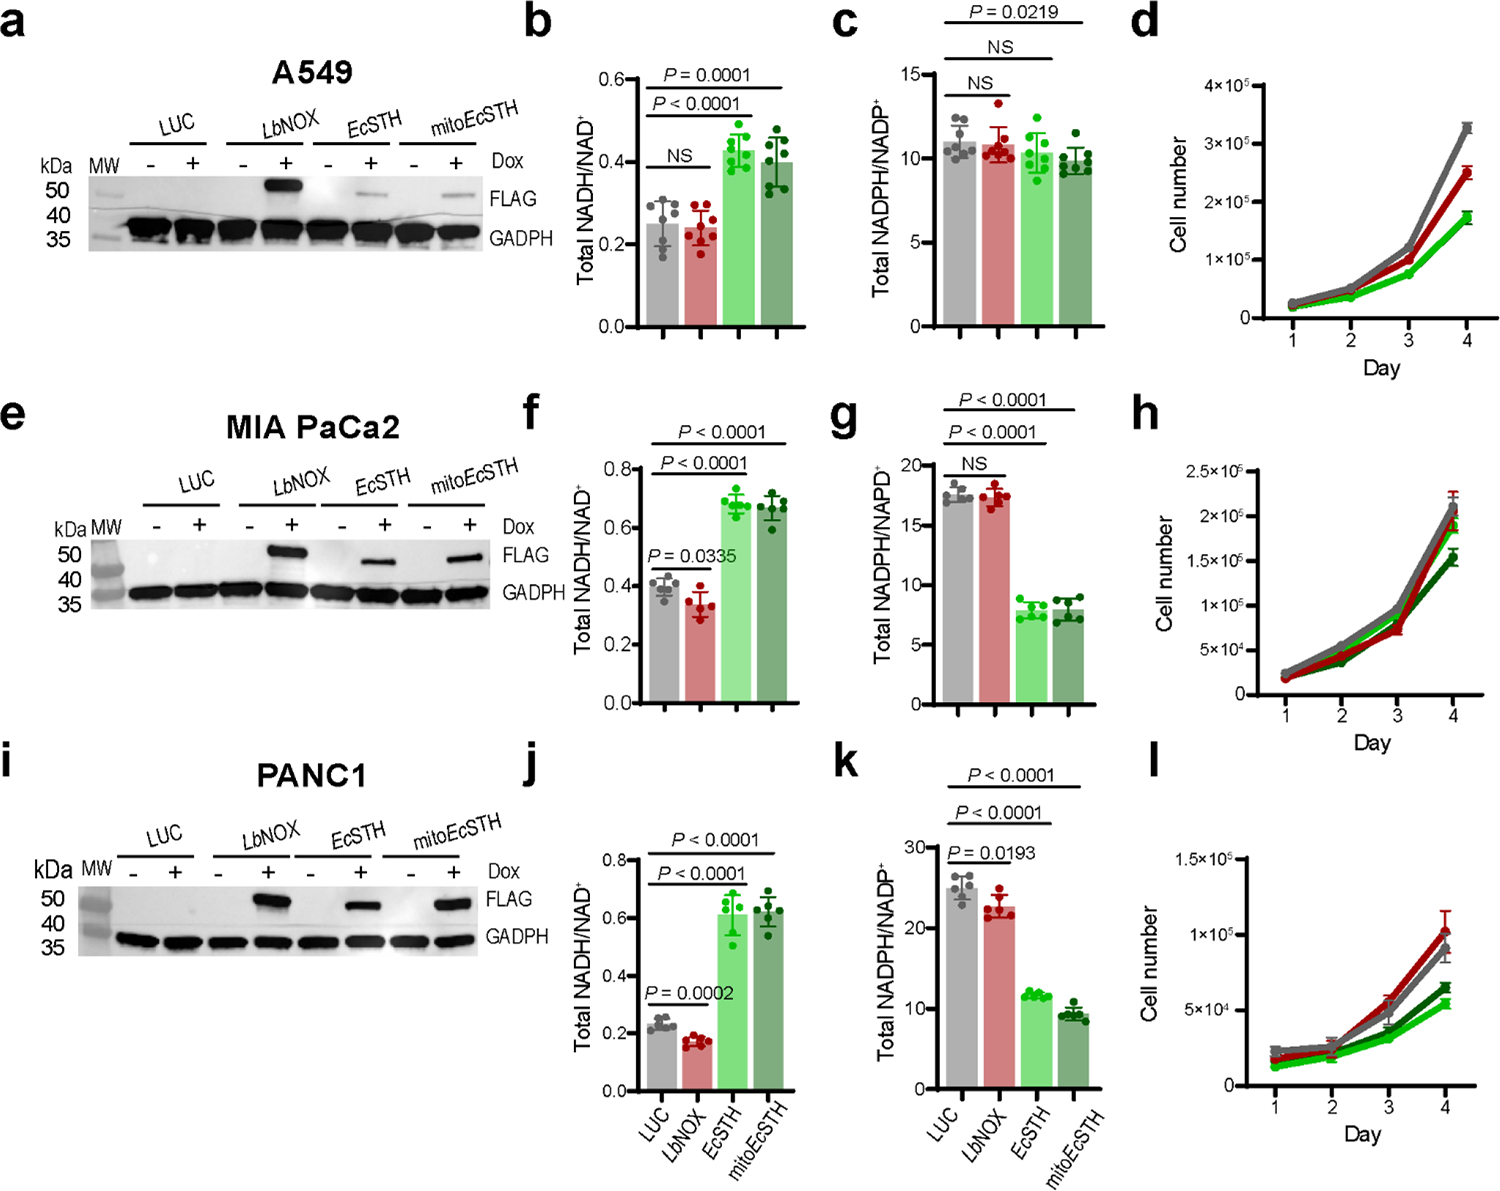
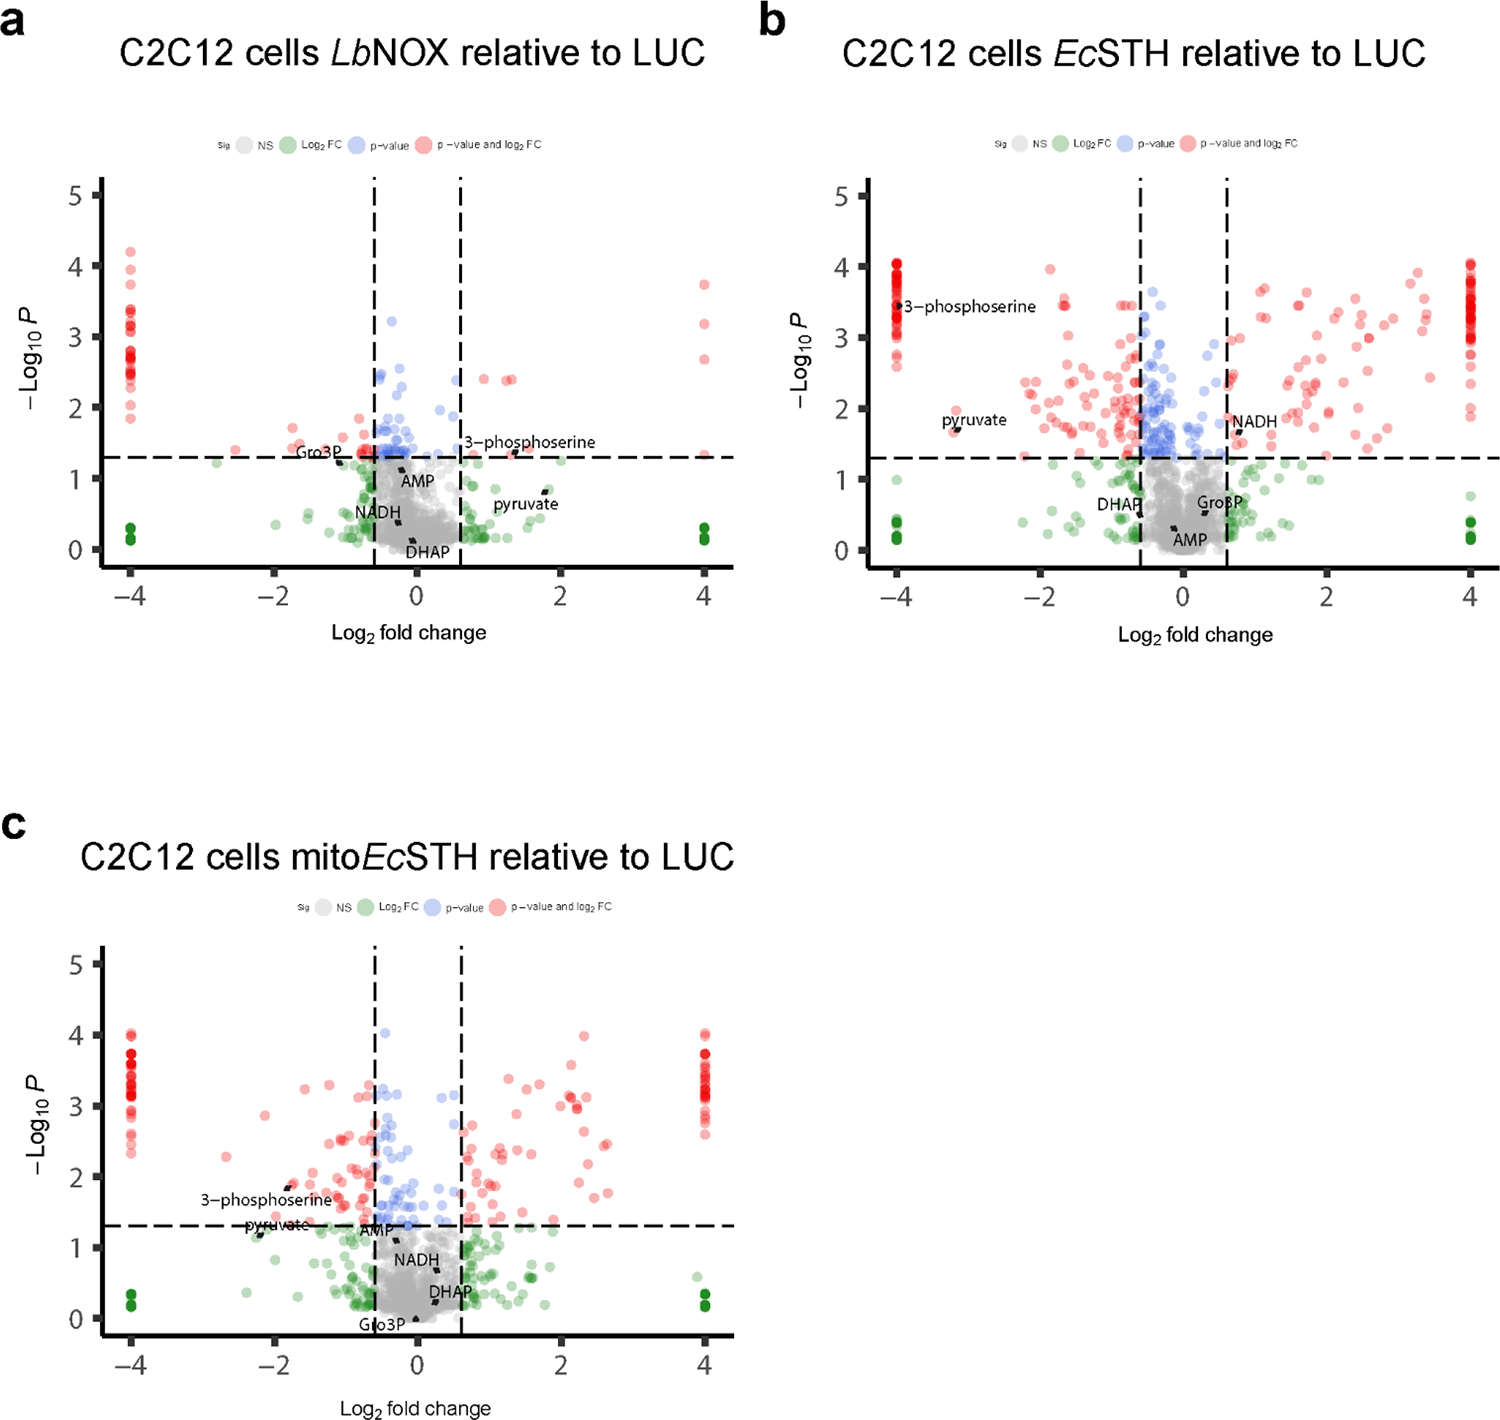
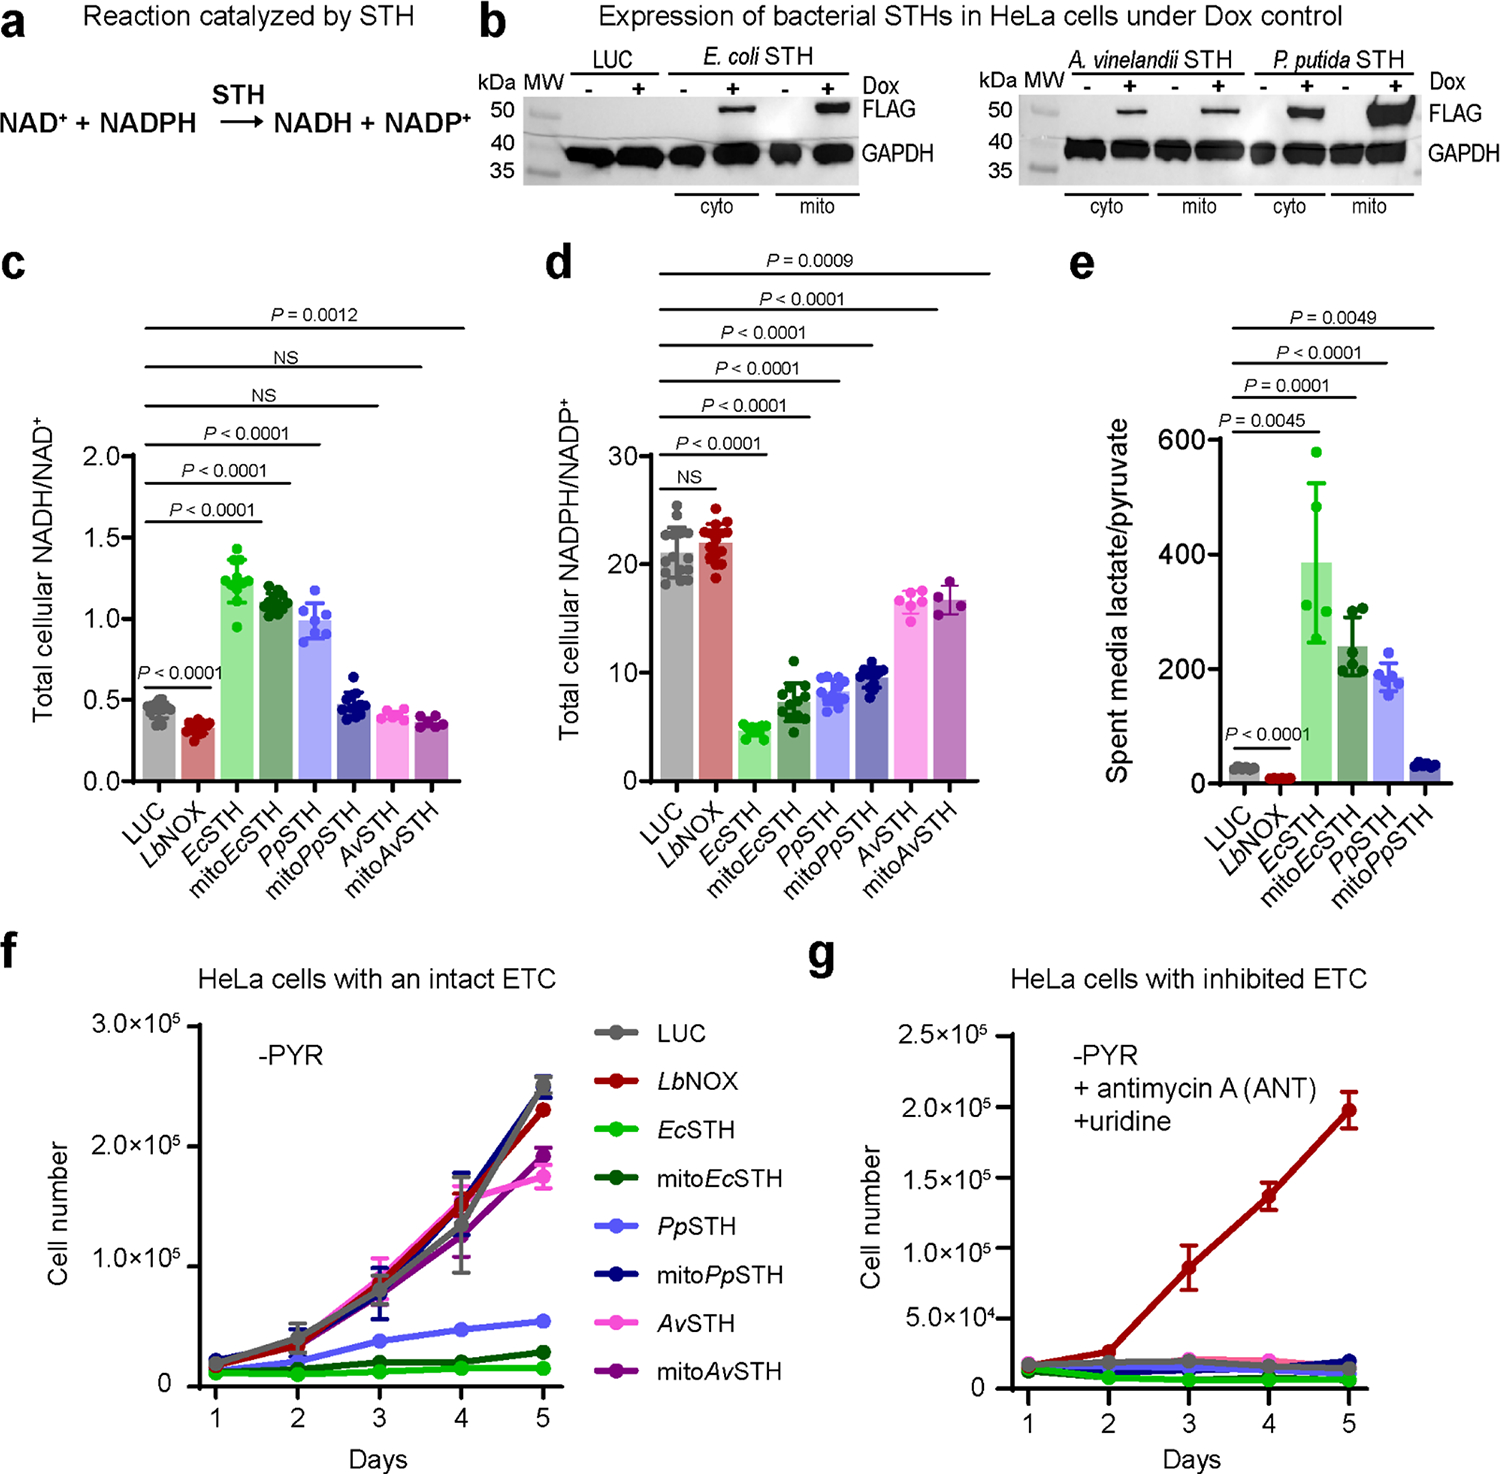
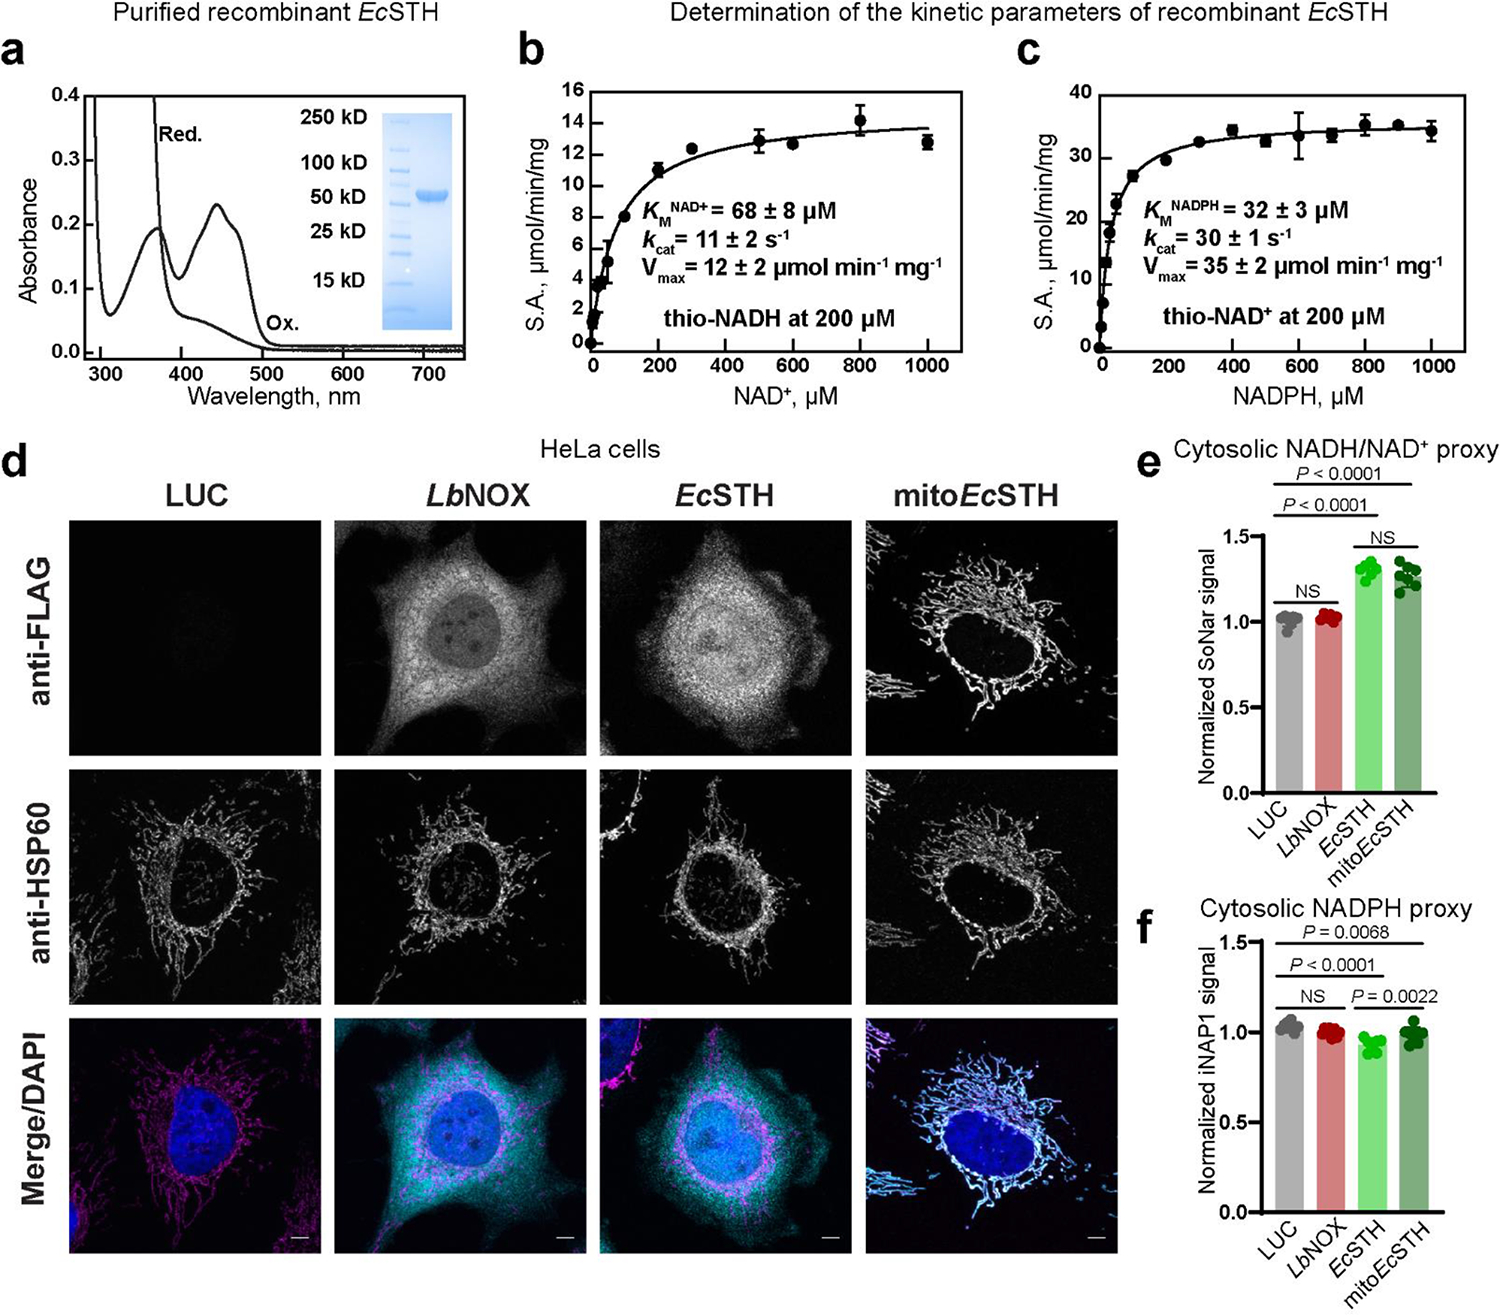
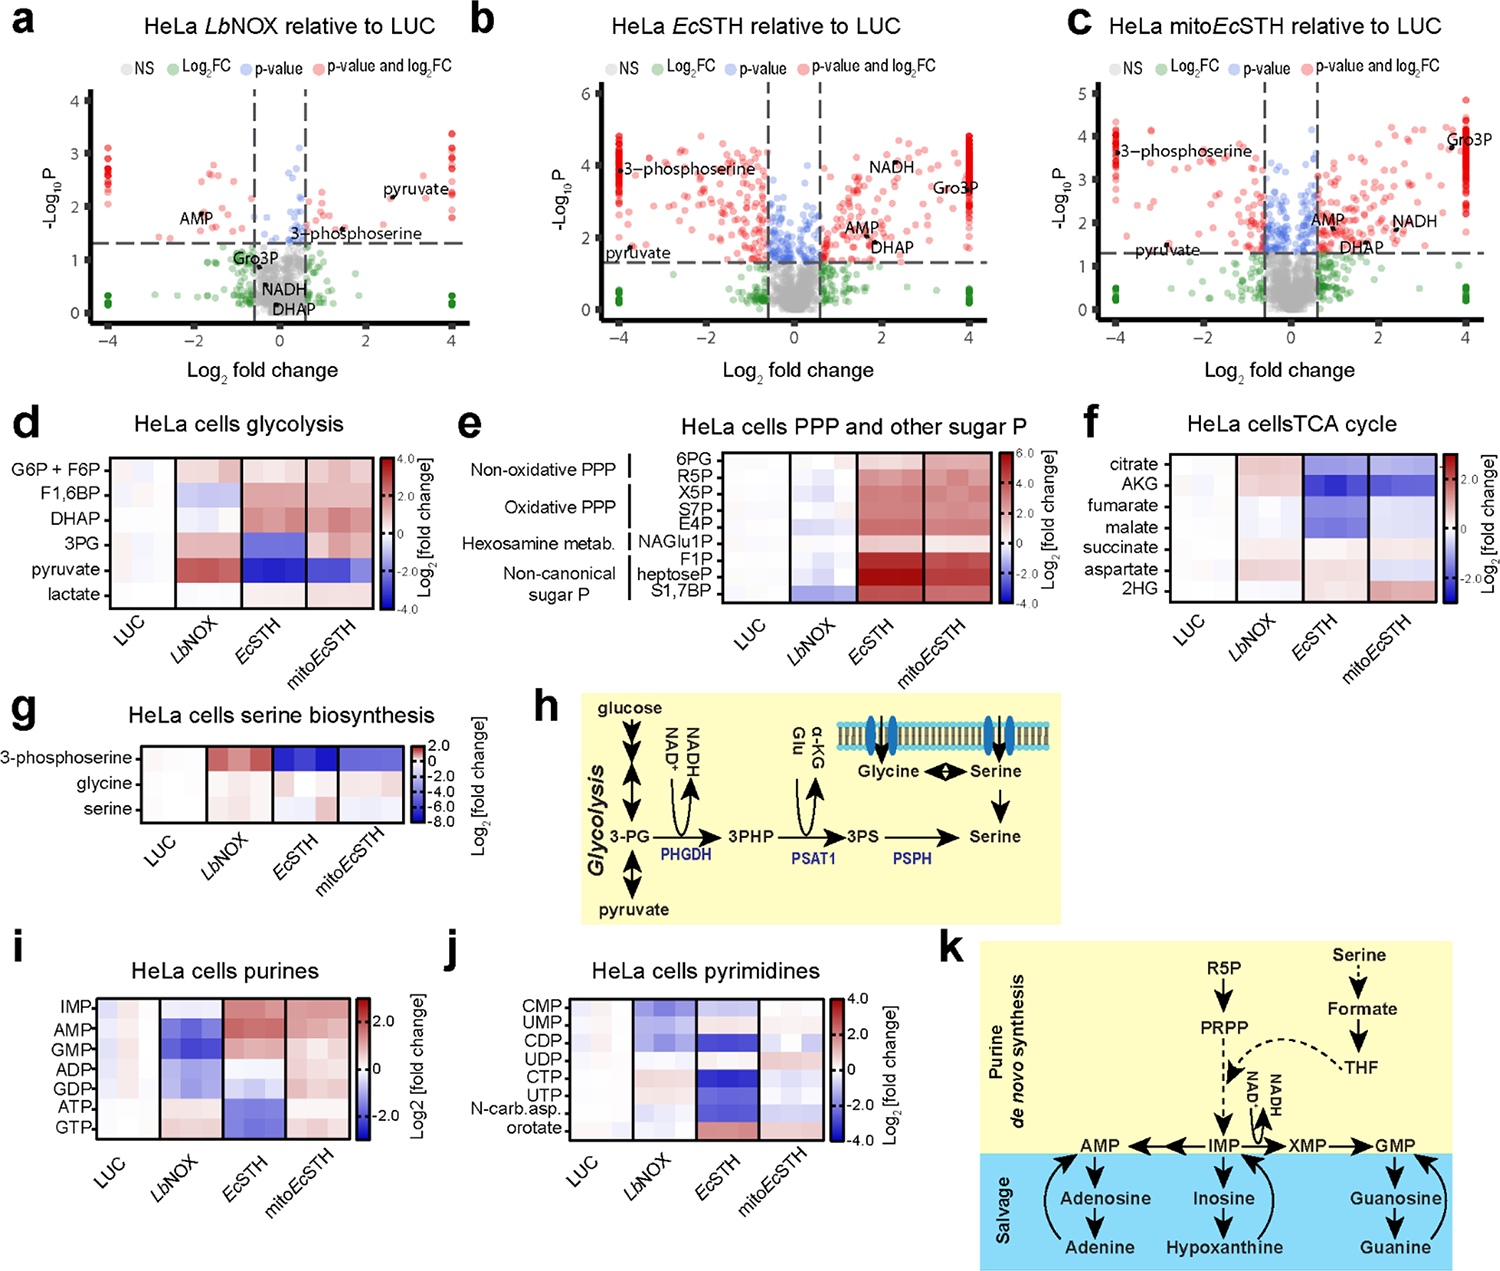
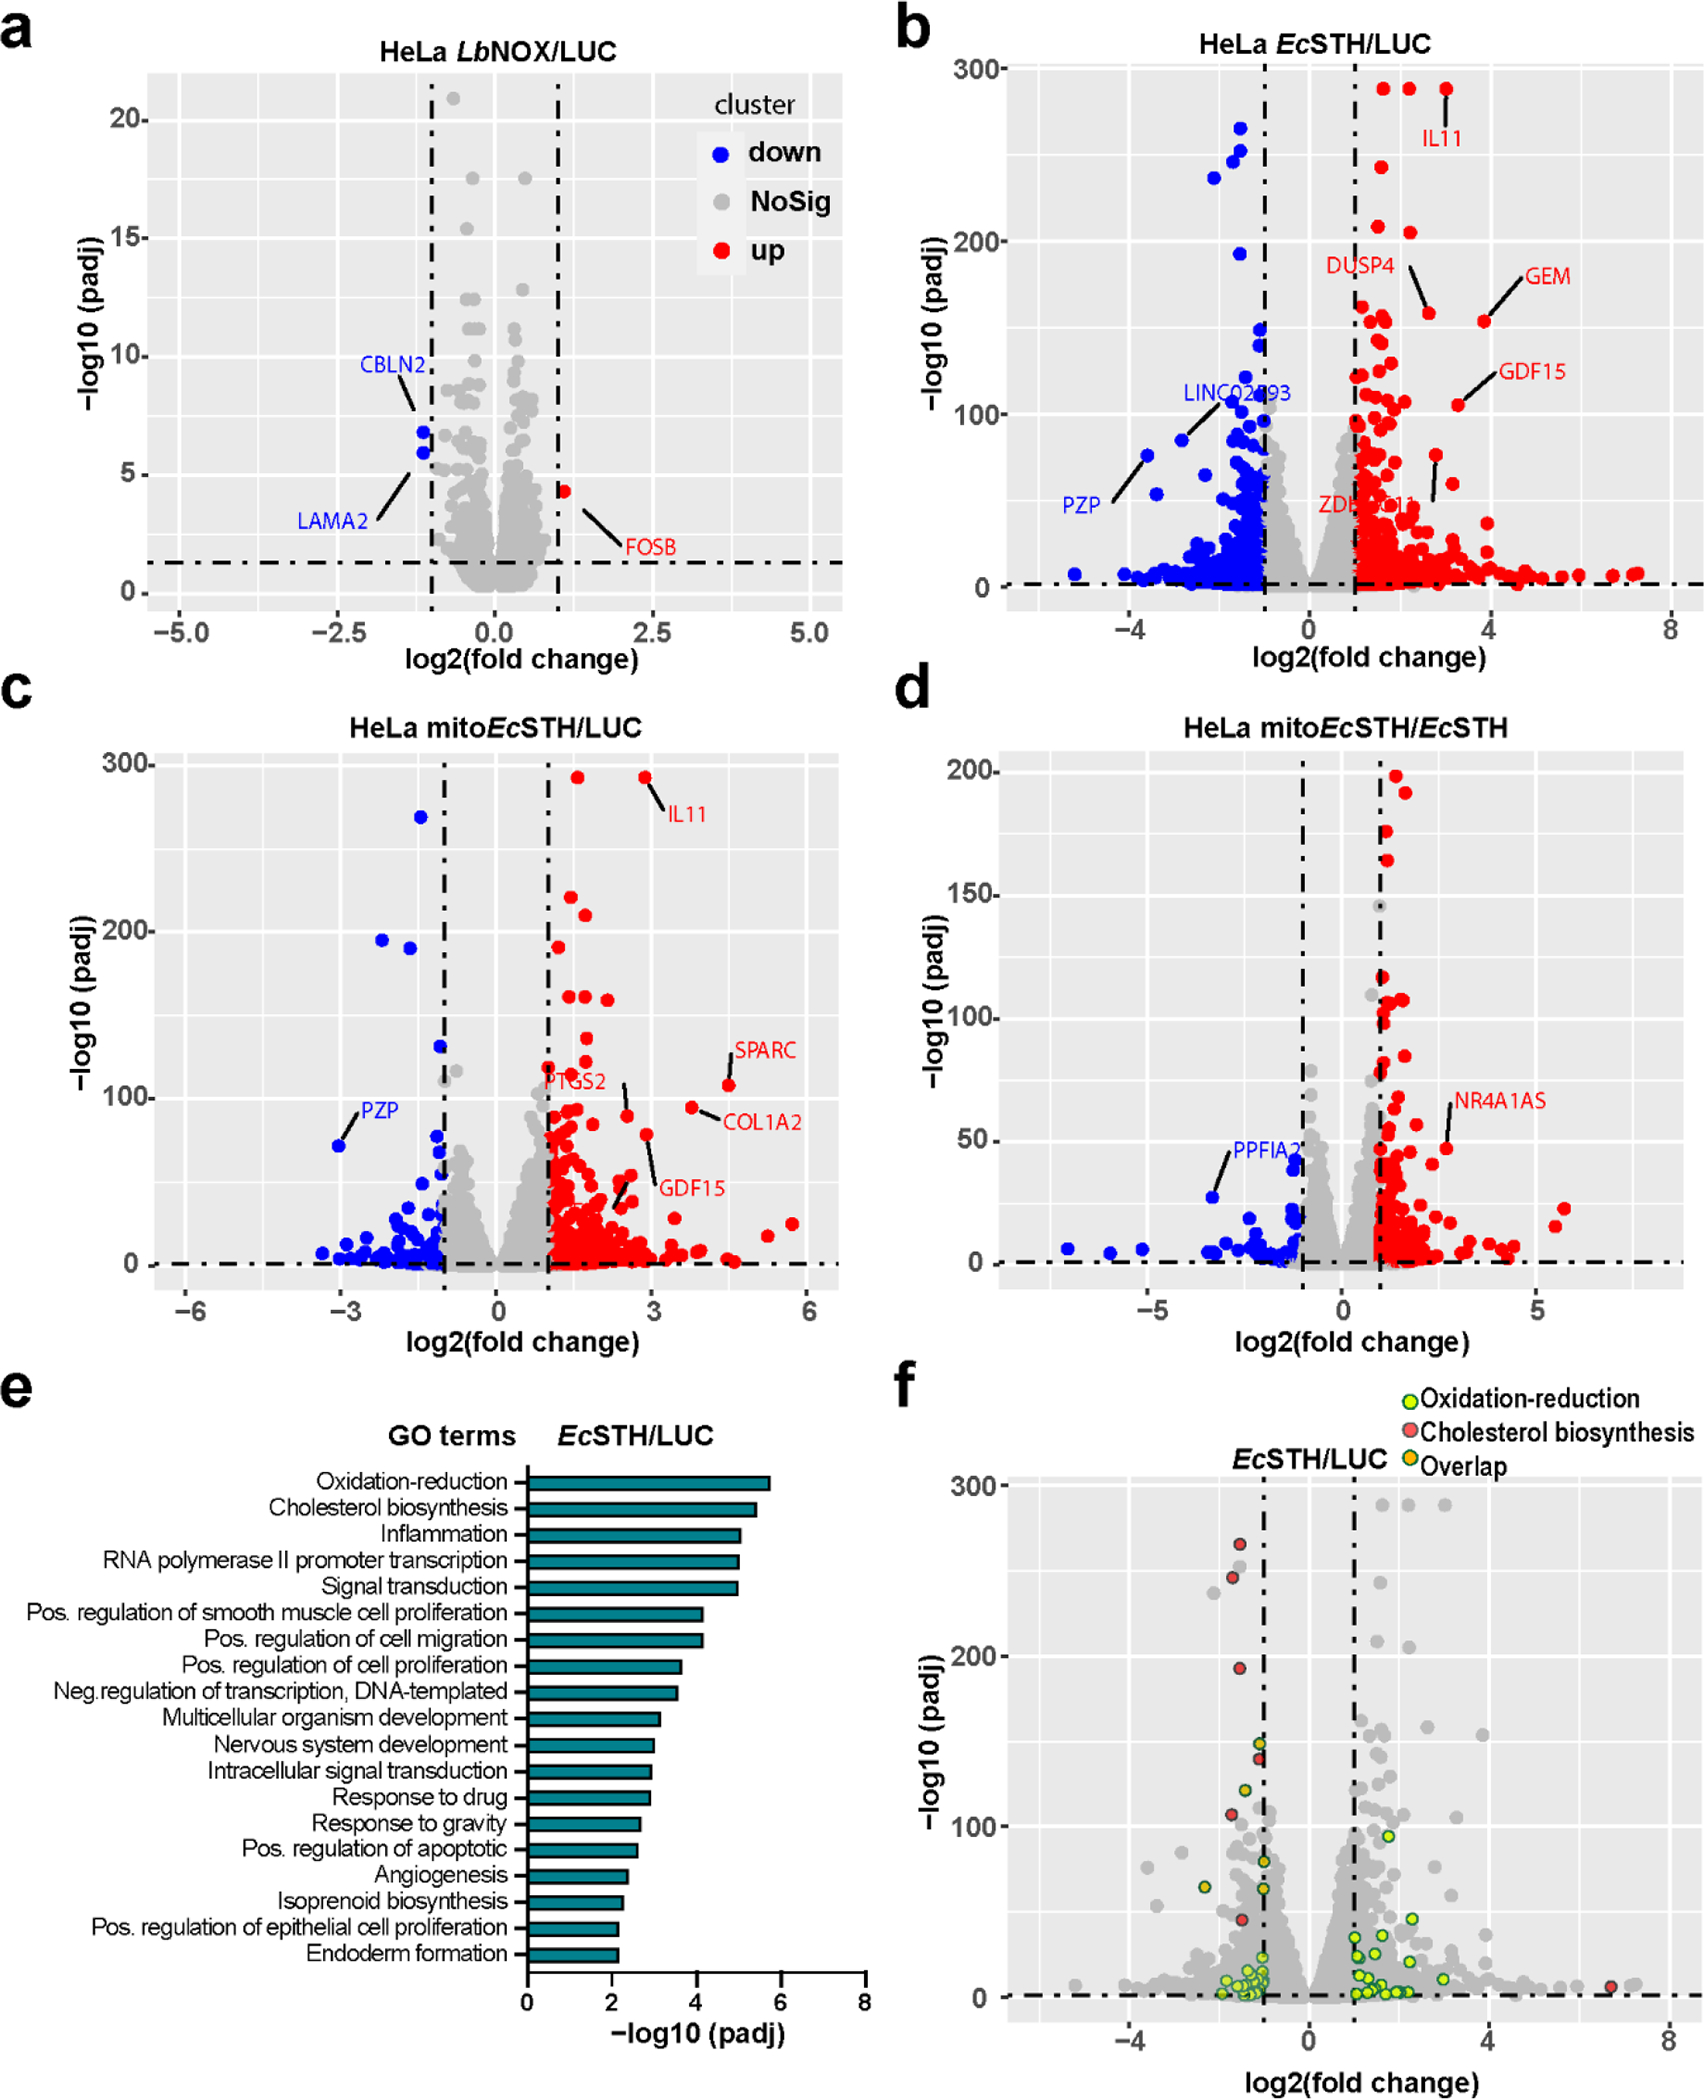
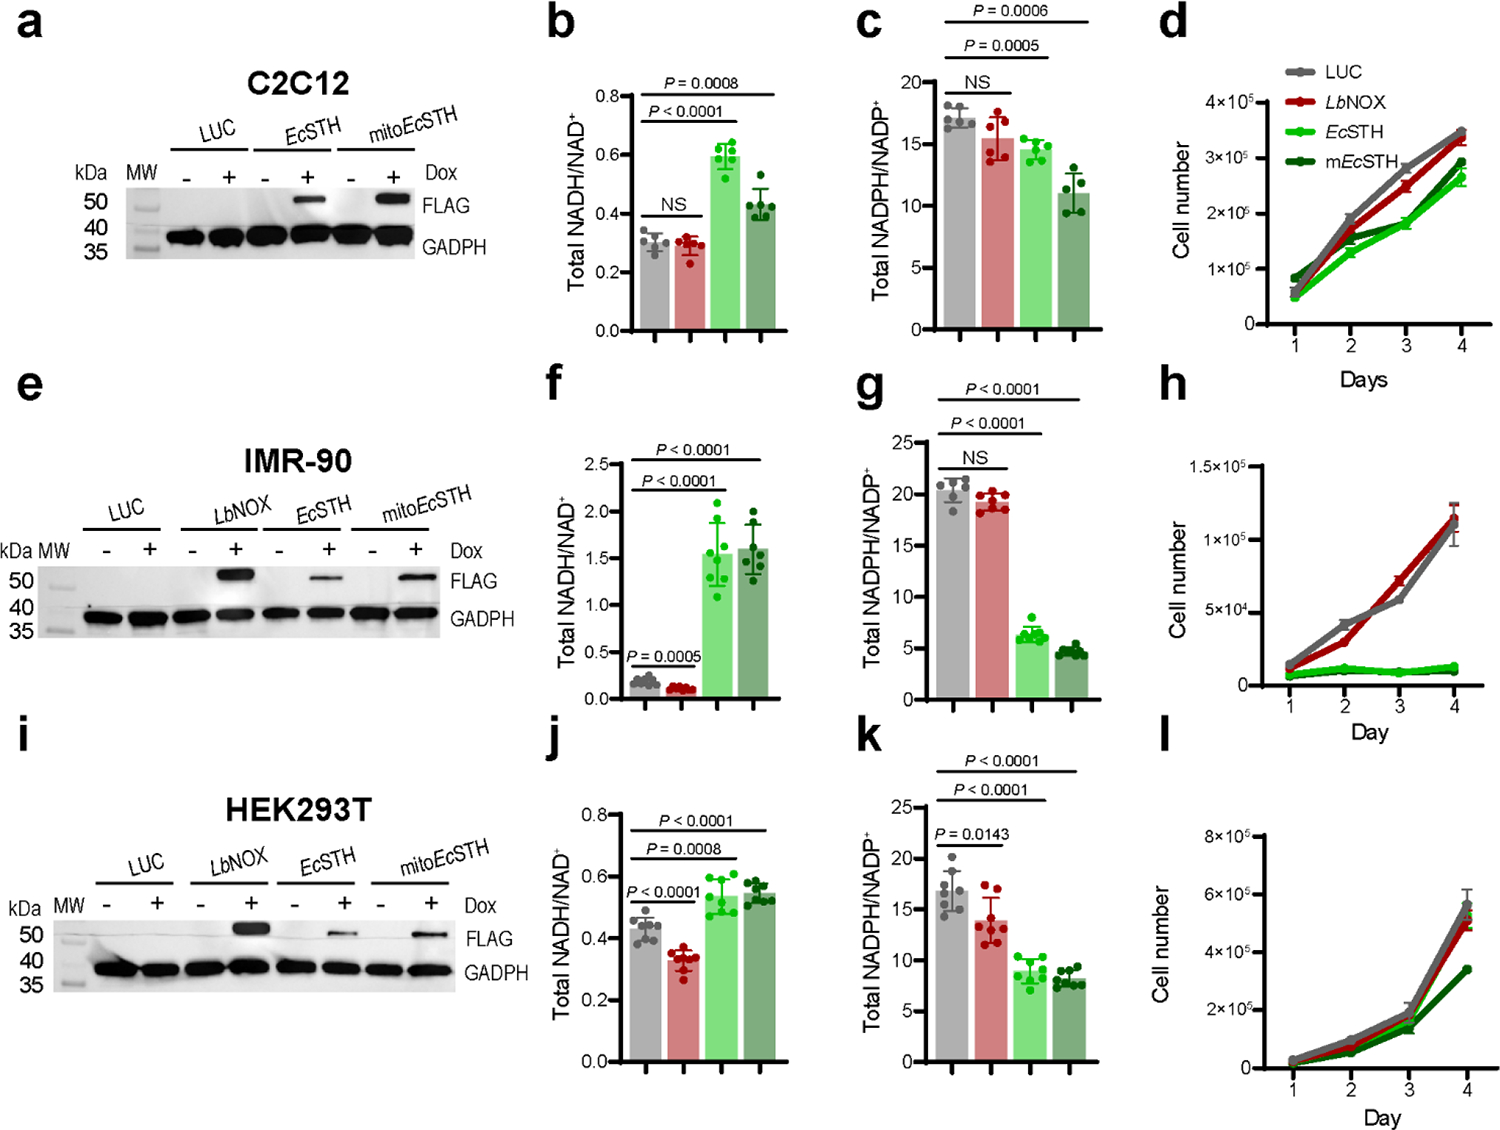
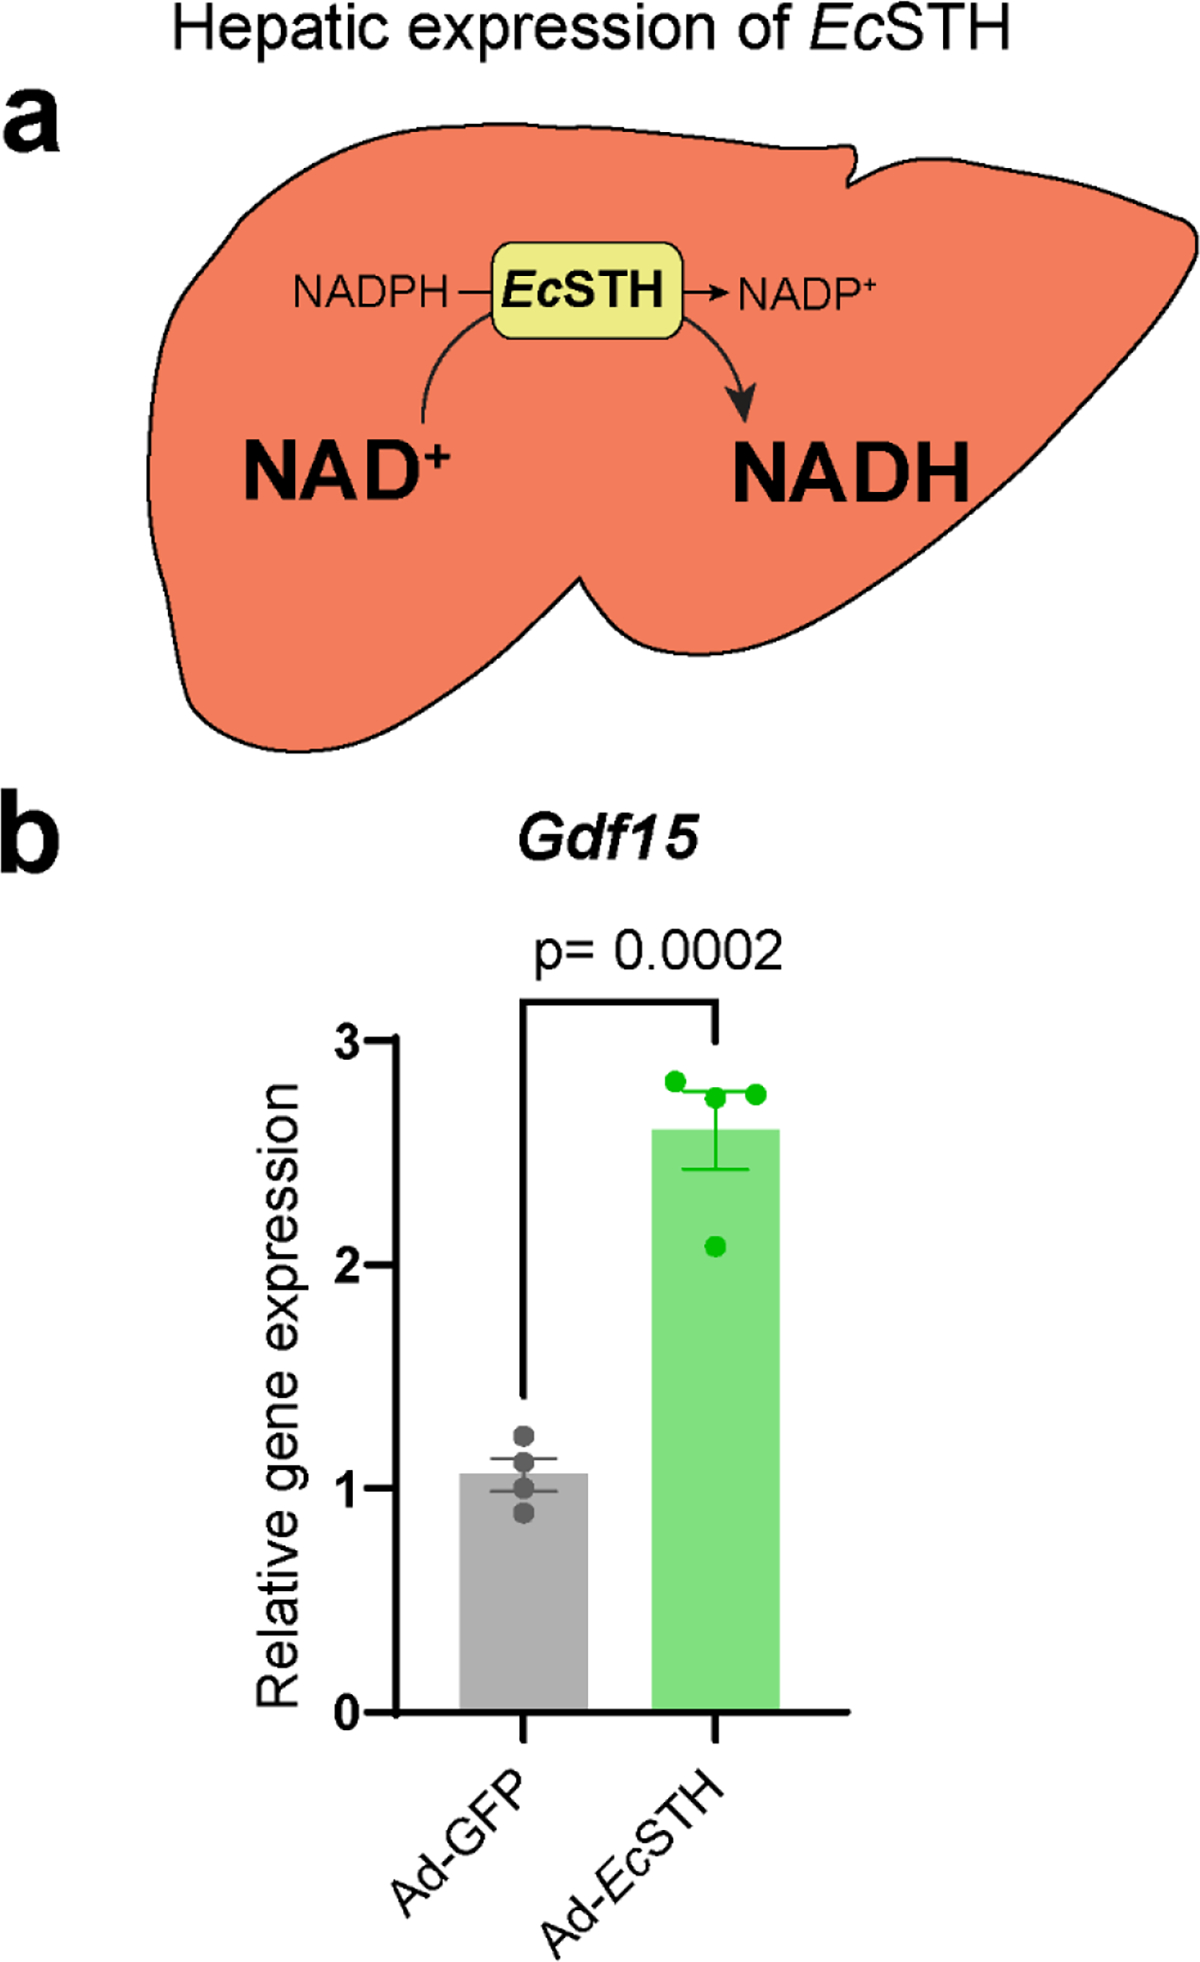
Impaired redox metabolism is a key contributor to the etiology of many diseases, including primary mitochondrial disorders, cancer, neurodegeneration and aging. However, mechanistic studies of redox imbalance remain challenging due to limited strategies that can perturb redox metabolism in various cellular or organismal backgrounds. Most studies involving impaired redox metabolism have focused on oxidative stress; consequently, less is known about the settings where there is an overabundance of NADH reducing equivalents, termed reductive stress. Here we introduce a soluble transhydrogenase from Escherichia coli (EcSTH) as a novel genetically encoded tool to promote reductive stress in living cells. When expressed in mammalian cells, EcSTH, and a mitochondrially targeted version (mitoEcSTH), robustly elevated the NADH/NAD+ ratio in a compartment-specific manner. Using this tool, we determined that metabolic and transcriptomic signatures of the NADH reductive stress are cellular background specific. Collectively, our novel genetically encoded tool represents an orthogonal strategy to promote reductive stress.


Conflict of interest statement

COMPETING INTERESTS:

VC is listed as an inventor on a patent application on the therapeutic uses of LbNOX and TPNOX (US patent application US20190017034A1). The remaining authors declare no competing interests.

Figures

Extended Data Fig. 1.
(a) Left panel is a schematic representation of live cell imaging using genetically encoded biosensor SoNar. The fluorescence intensity of the SoNar channel is represented in pseudocolor. The ratio of fluorescent intensities from excitation at 400 and 488 nm reflects cellular NADH/NAD+ ratio. High F400/488 ratio corresponds to high cellular NADH/NAD+ ratio and vice versa. To the right are widefield images of HeLa cells with lentivirus mediated LUC, LbNOX, EcSTH, mitoEcSTH expression under Dox control transiently expressing SoNar, in basal medium (DMEM without pyruvate, fluorescent vitamins and phenol red with 5 mM glucose, 25 mM HEPES, pH 7.4 and 1% dialyzed FBS), or after addition of 1 μM Ant A, or when cells were switched to the basal medium without glucose but with 10 mM pyruvate. Scale bars: 50 μm. (b-c) Quantification of the time course measurements of the fluorescence ratio (F400/488) for HeLa cells with lentivirus mediated LUC, LbNOX, EcSTH, mitoEcSTH expression under Dox control transiently expressing SoNar for conditions shown in (a). Values are mean ± s.d.; n = 8, 8, 10, 10 in (b), n = 7, 6, 6, 7 in (c) biologically independent samples.
Extended Data Fig. 2.
(a) Left panel is a schematic representation of principle of live cell imaging using genetically encoded biosensor iNAP1. The fluorescence intensity of the iNAP1 channel is represented in pseudocolor. The ratio of fluorescent intensities from excitations at 400 and 488 reflects cellular levels of NADPH. High F400/488 ratio corresponds to high NADPH and vice versa. To the right are widefield images of HeLa cells with lentivirus mediated LUC, LbNOX, EcSTH, mitoEcSTH expression under Dox control transiently expressing iNAP1, in basal medium (DMEM without pyruvate, fluorescent vitamins and phenol red with 5 mM glucose, 25 mM HEPES, pH 7.4 and 1% dialyzed FBS), or when cells were switched to the basal medium without glucose but with 10 mM pyruvate. Scale bars: 50 μm. Quantification of the time course measurements of the fluorescence ratio (F400/488) for HeLa cells with lentivirus mediated LUC, LbNOX, EcSTH, mitoEcSTH expression under Dox control transiently expressing iNAP1 in the basal medium followed by replacement with basal medium without glucose but with 10 mM pyruvate (b), after addition of G6PDi (c), after addition of 6-AN (d), or after addition of diamide (e). Values are mean ± s.d.; n = 9, 8, 8, 8 in (b), n = 8, 8, 8, 8 in (c), n = 8, 8, 8, 8 in (d), n = 8, 9, 7, 8 in (e) biologically independent samples.
Extended Data Fig. 3.
Oxygen consumption rate (OCR) (a) and extracellular acidification rate (ECAR) (b) of HeLa cells expressing EcSTH and mitoEcSTH before and after addition of 1 μM antimycin A (ANT) measured in pyruvate free HEPES/DMEM+dFBS media. Values are mean ± s.d.; n = 12, 12, 12, 10 for OCR traces in (a), n = 4 for bar graphs depicting OCR quantification in (a), n = 12, 12, 12, 10 for ECAR tracers in (b), n = 4 for bar graphs depicting ECAR quantification in (b) biologically independent samples. The statistical significance indicated for (a-b) represents a One-Way ANOVA followed by uncorrected Fisher’s least significant difference test.
Extended Data Fig. 4.
The total NADH/NAD+ (a) and NADPH/NADP+ (b) ratios measured in HeLa cells expressing EcSTH and mitoEcSTH three hours after changing to fresh pyruvate-free DMEM+dFBS with 1 μM antimycin A (ANT), 1 μM piericidin A (Pier), or 1 mM pyruvate (PYR). The total NADH/NAD+ (c) and NADPH/NADP+ (d) ratios measured in HeLa cells expressing EcSTH and mitoEcSTH incubated for 24 hours at 5%CO2/1%O2 hypoxia. Values are mean ± s.d.; n = 8, 4, 4, 3 4, 4, 4, 3, 8, 4, 4, 3 in (a), n = 4 in (b-d) biologically independent samples. The statistical significance indicated for (a-d) represents a One-Way ANOVA followed by uncorrected Fisher’s least significant difference test. NS, no significant difference.
Extended Data Fig. 5.
Targeted metabolomics in HeLa cells expressing LbNOX (a), EcSTH (b) and mitoEcSTH (c). LUC expressing HeLa cells were used as a control in (a-c). The statistical significance indicated for (a-c) represents p value cutoff = 0.05, fold change cutoff = 1.5 and Welch t test (FDR corrected).
Extended Data Fig. 6.
Intracellular lactate/pyruvate (a), 2-hydroxybutyrate/2-ketobutyrate (2HB/2KB) (b), 3-hydroxybutyrate/acetoacetate (3HB/AcAc) (c), glycerol 3-phosphate/dihydroxyacetone phosphate (Gro3P/DHAP) (d), C16:1/C16:0 (e) and AMP/ATP (f) ratios measured in HeLa cells expressing EcSTH and mitoEcSTH. In (a-f) values are mean ± s.d.; n = 3 biologically independent samples. Statistically significant differences were calculated by using a Welch ANOVA followed by unpaired t test. NS, no significant difference.
Extended Data Fig. 7.
Proliferation of HeLa cells with EcSTH and mitoEcSTH expression in DMEM+dFBS when supplemented with exogenous electron acceptors (10 mM pyruvate (PYR), 10 mM oxaloacetate (OAA) or 10 mM α-ketobutyrate (2KB)). Values are mean ± s.d.; n = 3 biologically independent samples.
Extended Data Fig. 8.
(a-b) Venn diagrams displaying the similarities and differences of genes from indicated gene sets. Yellow circles include all genes in the GO term “oxidation-reduction” pathways (see Fig. 4e). The salmon circle contains all genes in the GO term “cholesterol biosynthetic” pathways (see Fig. 4e). The light brown circle indicates the NAD(P)ome (genes in humans that encode NAD+ or NADP+ dependent enzymes as defined in (27)). The up-regulated genes are marked in red and down-regulated genes are marked in blue.
Extended Data Fig. 9.
Western blot analysis of EcSTH and mitoEcSTH expression in A549 lung adenocarcinoma cells (a), MIA PaCa-2 epithelial tumor tissue of the pancreas (e) and PANC-1 pancreatic duct epithelioid carcinoma (i). (a, e, i) Representative blots are shown. The total NADH/NAD+ ratios in A549 (b), MIA PaCa-2 (f) and PANC-1 (j) cells expressing EcSTH and mitoEcSTH. The total NADPH/NADP+ ratios in A549 (c), MIA PaCa-2 (g) and PANC-1 (k) cells expressing EcSTH and mitoEcSTH. Proliferation of A549 (d), MIA PaCa-2 (h) and PANC-1 (l) cells expressing EcSTH and mitoEcSTH in pyruvate-free DMEM+dFBS. LUC and LbNOX expressing HeLa cells were used as controls in (a-l). Values are mean ± s.d.; n = 8 in (b-c), n = 6 in (f, g, j, k) biologically independent samples. The statistical significance indicated for (b, c, f, g, j, k) represents a Welch ANOVA followed by unpaired t test. NS, no significant difference. For growth curves (d, h, l) error bars represent mean ± s.d.; n = 3 biologically independent samples.
Extended Data Fig. 10.
Untargeted metabolomics in C2C12 cells expressing LbNOX (a), EcSTH (b) and mitoEcSTH (c). LUC expressing C2C12 cells were used as a control in (a-c). The statistical significance indicated for (a-c) represents p value cutoff = 0.05, fold change cutoff = 1.5 and Welch t test (FDR corrected).
Figure 1.
Figure 1.. Screening of bacterial soluble transhydrogenases (STHs) for their ability to elevate NADH levels in mammalian cells.
(a) The reaction catalyzed by a soluble transhydrogenase (STH). (b) Western blot analysis of HeLa cells expressing untargeted (cyto) and mitochondrially targeted (mito) bacterial STHs from E. coli, A. vinelandii, and P. putida with a C-terminal FLAG tag under doxycycline (Dox) control. Representative blots are shown. The total cellular NADH/NAD+ (c) and NADPH/NADP+ (d) ratios measured in HeLa cells expressing untargeted and mitochondrially targeted STHs from E. coli, P. putida, and A. vinelandii. (e) The lactate/pyruvate ratio measured in pyruvate-free DMEM+dFBS media, which was incubated for 3 hours with HeLa cells expressing untargeted and mitochondrially targeted STHs from E. coli and P. putida. (f) The effect of expression of untargeted and mitochondrially targeted STHs from E. coli, P. putida, and A. vinelandii on proliferation in pyruvate-free (-PYR) DMEM+dFBS. (g) The same as in (f) but in the presence of 1 μM antimycin A (ANT) and 200 μM uridine. Luciferase (LUC) and L. brevis water-forming NADH oxidase (LbNOX) expressing HeLa cells were used as controls in (b-g). Values are mean ± s.d.; n = 15, 15, 11, 12, 7, 12, 6, 6 in (c), n = 15, 15, 11, 12, 12, 12, 6, 4 in (d), n = 6, 6, 5, 6, 6, 6 in (e) biologically independent samples. Statistically significant differences were calculated by using a Welch ANOVA followed by unpaired t test. NS, no significant difference. For growth curves (f-g), error bars represent mean ± s.d.; n = 3 biologically independent samples.
Figure 2.
Figure 2.. Determination of EcSTH kinetic parameters and visualization of EcSTH activity in live cells using genetically encoded sensors.
(a) UV-Visible spectrum of recombinant STH from E. coli (EcSTH) as purified at 20 μM FAD of active sites (Ox.) and after addition of excess of sodium dithionite (Red.). Insert: the SDS-PAGE of purified EcSTH. A representative SDS-PAGE is shown. Michaelis-Menten analysis of the reaction catalyzed by EcSTH with NAD+ (b) or NADPH (c). Reported values for Vmax, kcat and KM for NAD+ (thio-NADH was fixed at 200 μM) and NADPH (thio-NAD+ was fixed at 200 μM) are from Supplementary Fig. 3d. (d) Subcellular localization of untargeted EcSTH and mitochondrially targeted EcSTH (mitoEcSTH) in HeLa cells determined by fluorescence microscopy. HeLa cells expressing FLAG-tagged LbNOX, EcSTH, and mitoEcSTH proteins were co-stained for FLAG tag, HSP60 (mitochondrial marker) and DAPI (nucleus marker). Scale bars: 5 μm. Cytosolic NADH/NAD+ ratios (e) and NADPH levels (f) measured using genetically encoded sensors SoNar and iNAP1 in HeLa cells expressing EcSTH and mitoEcSTH. Values are mean ± s.d.; n = 2 in (b-c), n = 7, 6, 6, 7 in (e), n = 8, 8, 7, 8 in (f) biologically independent samples. The statistical significance indicated for (e-f) represents a One-Way ANOVA followed by uncorrected Fisher’s least significant difference test. NS, no significant difference.
Figure 3.
Figure 3.. Metabolic features of the NADH reductive stress in HeLa cells.
(a-c) Untargeted metabolomics of HeLa cells expressing LbNOX, EcSTH and mitoEcSTH. Heatmaps of the most impacted glycolysis (d), pentose phosphate pathway, non-canonical sugar phosphates (e), the TCA cycle (f), serine biosynthesis (g) intermediates in HeLa cells expressing EcSTH and mitoEcSTH. G6P: glucose-6-phosphate; F6P: fructose-6-phosphate; F1,6BP: fructose-1,6-biphosphate; DHAP: dihydroxyacetone phosphate; 3PG: 3-phosphoglycerate; 6PG: 6-phosphogluconate; R5P: ribose-5-phosphate; X5P: xylulose-5-phosphate; S7P: sedoheptulose-7-phosphate, E4P: erythrose-4-phosphate; NAGlu1P: N-acetylglucosamine-1-phosphate; F1P: fructose-1-phosphate; heptoseP: a putative heptose with one phosphate; S1,7BP: sedoheptulose-1,7-bisphosphate; AKG: α-ketoglutarate; 2HG: 2-hydroxyglutarate. (h) Schematic of serine cellular biosynthesis. Heatmaps of the most impacted purines (i) and pyrimidines (j) in EcSTH and mitoEcSTH expressing HeLa cells. N-car.asp.: N-carbamoyl-aspartate. (k) Schematic of purine cellular salvage and biosynthesis. Luciferase and LbNOX expressing HeLa cells were used as controls in (a-g, i, j). In heatmaps (d-g, i, j) each column represents biologically independent sample. The statistical significance indicated for (a-c) represents p value cutoff = 0.05, fold change cutoff = 1.5 and Welch t test (FDR corrected).
Figure 4.
Figure 4.. RNA-Seq of HeLa cells expressing LbNOX, EcSTH and mitoEcSTH.
(a-d) Volcano plots that represent the indicated group’s log2 fold change (x-axis) and adjusted P-value for significance (y-axis). Genes significantly different in expression at FDR 5% are indicated in red (up-regulated genes) and blue (down-regulated genes). Gray dots represent genes without significant changes in expression. Selected genes are marked with gene names. (e) Gene ontology enrichment analysis of EcSTH vs LUC control group. (f) Volcano plot representing the top 2 GO terms in (e). Light green dots represent the “oxidation-reduction” and salmon dots represent the “cholesterol biosynthetic” pathways. Overlapping genes are highlighted in orange.
Figure 5.
Figure 5.. The anti-proliferative effect of EcSTH and mitoEcSTH expression is cellular background specific.
Western blot analysis of EcSTH and mitoEcSTH expression in C2C12 mouse myoblasts (a), IMR-90 human fibroblasts (e), embryonic human kidney HEK293T cells (i). (a, e, i) Representative blots are shown. The total NADH/NAD+ ratios in C2C12 myoblasts (b), IMR-90 (f), HEK293T (j) cells expressing EcSTH and mitoEcSTH. The total NADPH/NADP+ ratios in C2C12 myoblasts (c), IMR-90 (g), HEK293T (k) cells expressing EcSTH and mitoEcSTH. Proliferation of C2C12 myoblasts (d), IMR-90 (h), HEK293T (l) cells expressing EcSTH and mitoEcSTH in pyruvate-free DMEM+dFBS. LUC and LbNOX expressing HeLa cells were used as controls in (a-l). Values are mean ± s.d.; n = 6, 6, 6, 6 in (b), n = 6, 6, 6, 5 in (c), n = 8, 8, 8, 7 in (f), n = 6, 7, 8, 8 in (g), n = 8, 8, 8, 8 in (j), n = 8, 8, 8, 8 in (k) biologically independent samples. The statistical significance indicated for (b, c, f, g, j, k) represents a Welch ANOVA followed by unpaired t test. NS, no significant difference. For growth curves (d, h, l) error bars represent mean ± s.d.; n = 3 biologically independent samples.
Figure 6.
Figure 6.. In vivo elevation of the hepatic cytosolic NADH/NAD+ ratio upregulates GDF15 expression.
(a) Schematic representation of the experiment when adenoviral system was used to express GFP or EcSTH in liver. (b) Hepatic expression of GDF15 as quantified by qPCR. Values are mean ± s.d.; n = 4 biologically independent samples. The statistical significance represents a two-tailed unpaired t test.

References

METHODS-ONLY REFERNCES:

    1. Schindelin J, Arganda-Carreras I, Frise E, Kaynig V, Longair M, Pietzsch T et al. (2012) Fiji: an open-source platform for biological-image analysis Nat Methods 9, 676–682 10.1038/nmeth.2019 - DOI - PMC - PubMed
    1. Love MI, Huber W, andAnders S (2014) Moderated estimation of fold change and dispersion for RNA-seq data with DESeq2 Genome Biol 15, 550 10.1186/s13059-014-0550-8 - DOI - PMC - PubMed

References

    1. Veech RL, Todd King M, Pawlosky R, Kashiwaya Y, Bradshaw PC, andCurtis W (2019) The “great” controlling nucleotide coenzymes IUBMB Life 71, 565–579 10.1002/iub.1997 - DOI - PMC - PubMed
    1. Walsh CT, Tu BP, andTang Y (2018) Eight Kinetically Stable but Thermodynamically Activated Molecules that Power Cell Metabolism Chem Rev 118, 1460–1494 10.1021/acs.chemrev.7b00510 - DOI - PMC - PubMed
    1. Xiao W, Wang RS, Handy DE, andLoscalzo J (2018) NAD(H) and NADP(H) Redox Couples and Cellular Energy Metabolism Antioxid Redox Signal 28, 251–272 10.1089/ars.2017.7216 - DOI - PMC - PubMed
    1. Titov DV, Cracan V, Goodman RP, Peng J, Grabarek Z, andMootha VK (2016) Complementation of mitochondrial electron transport chain by manipulation of the NAD+/NADH ratio Science 352, 231–235 10.1126/science.aad4017 - DOI - PMC - PubMed
    1. Cracan V, Titov DV, Shen H, Grabarek Z, andMootha VK (2017) A genetically encoded tool for manipulation of NADP(+)/NADPH in living cells Nat Chem Biol 13, 1088–1095 10.1038/nchembio.2454 - DOI - PMC - PubMed

Publication types