. 2024 Feb;20(2):221-233.
doi: 10.1038/s41589-023-01452-w. Epub 2023 Oct 26.

Mitochondrial matrix RTN4IP1/OPA10 is an oxidoreductase for coenzyme Q synthesis

Affiliations

Mitochondrial matrix RTN4IP1/OPA10 is an oxidoreductase for coenzyme Q synthesis

Isaac Park et al. Nat Chem Biol. 2024 Feb.

Abstract

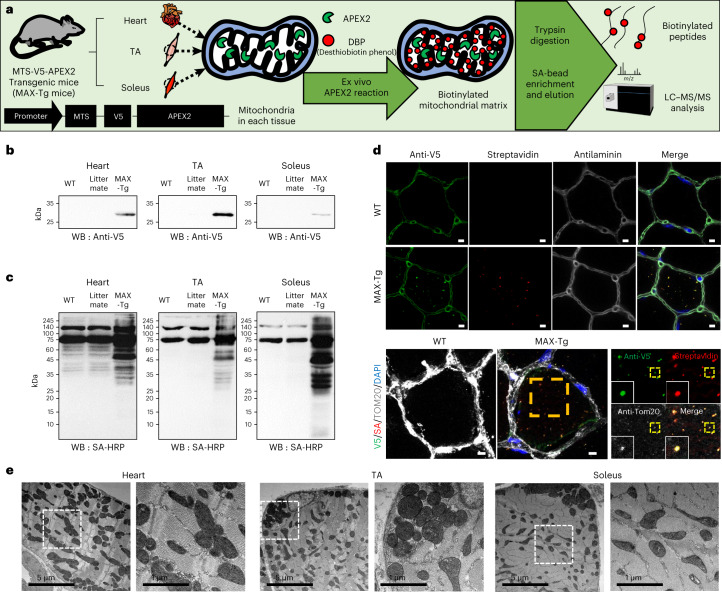
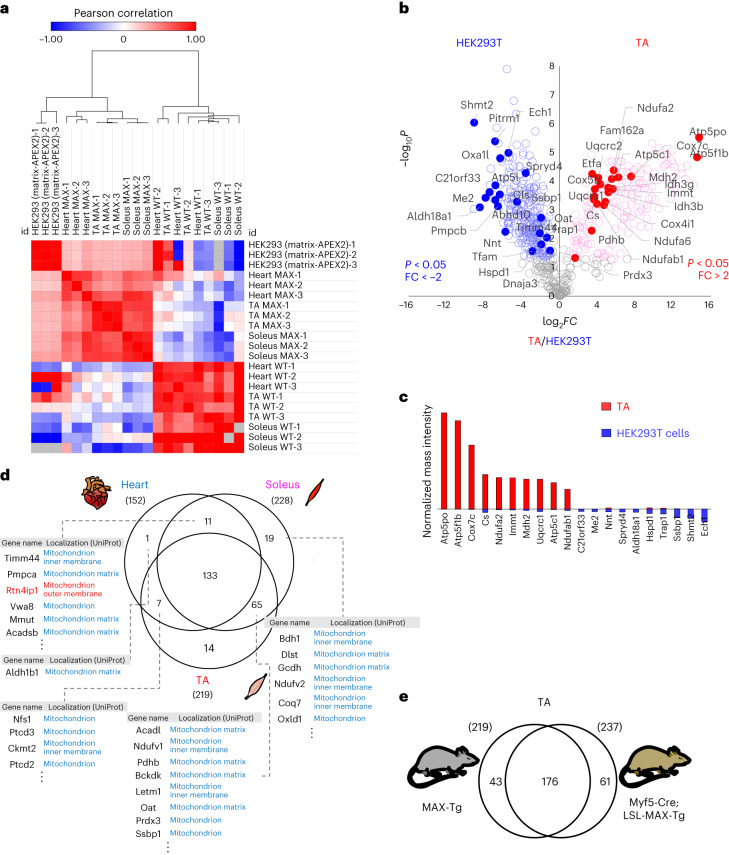
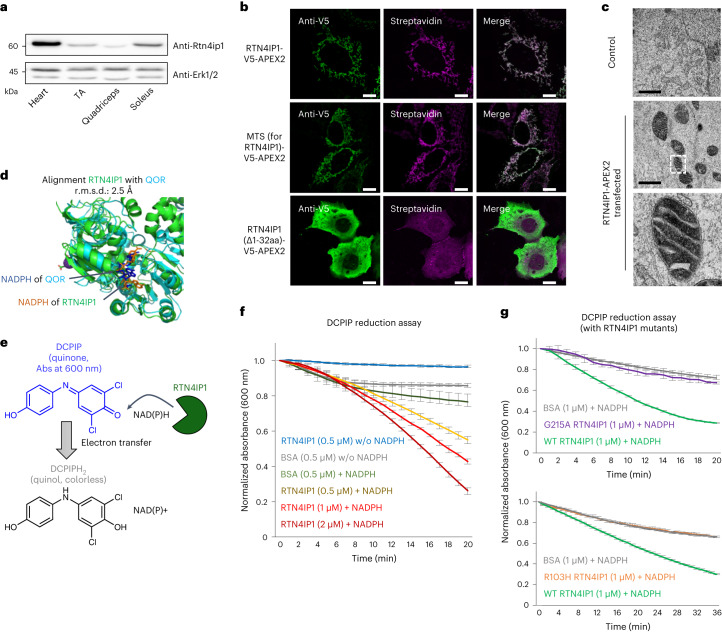
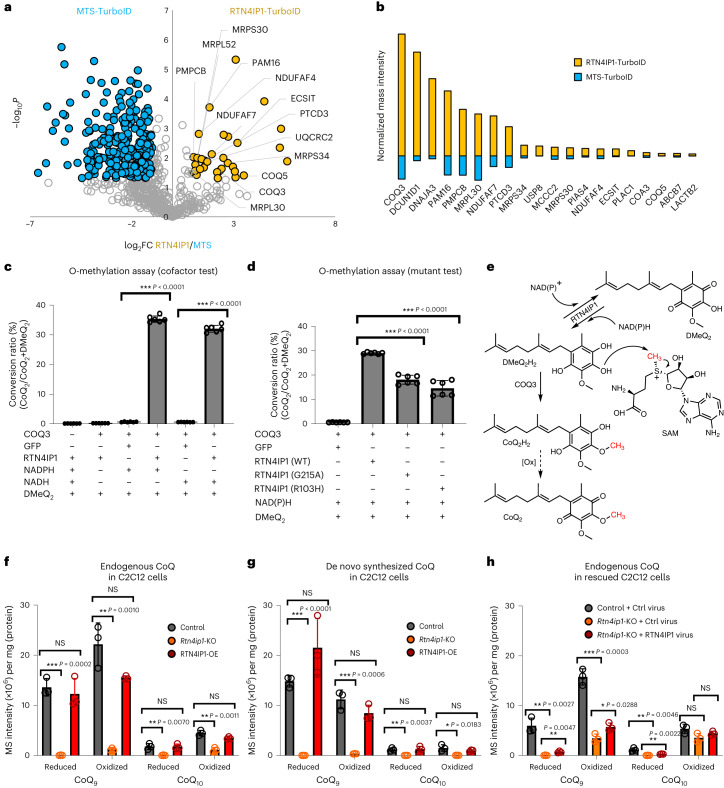
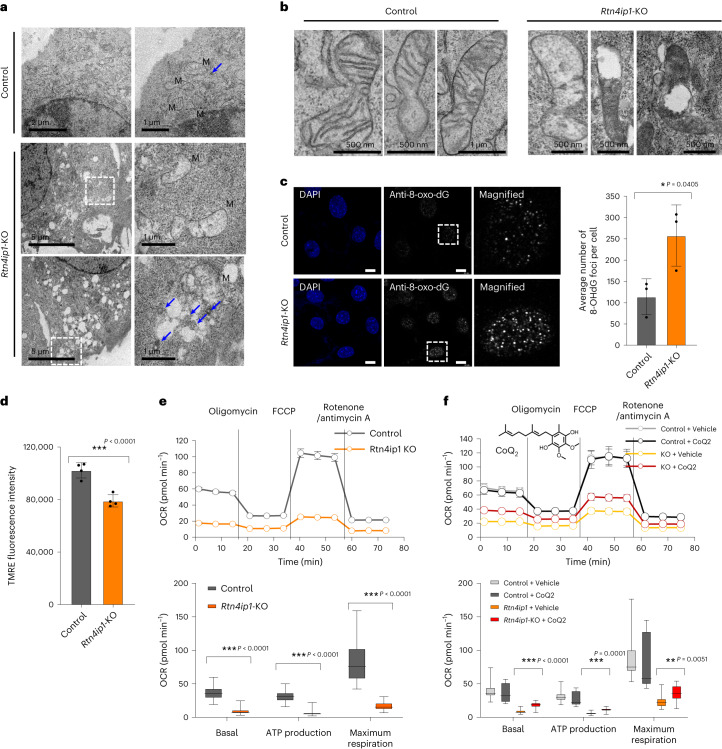
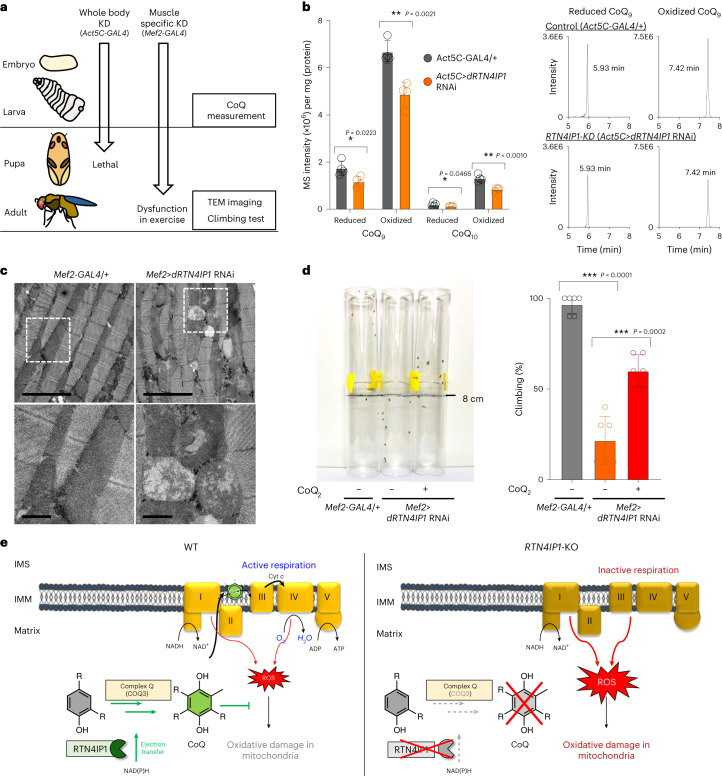
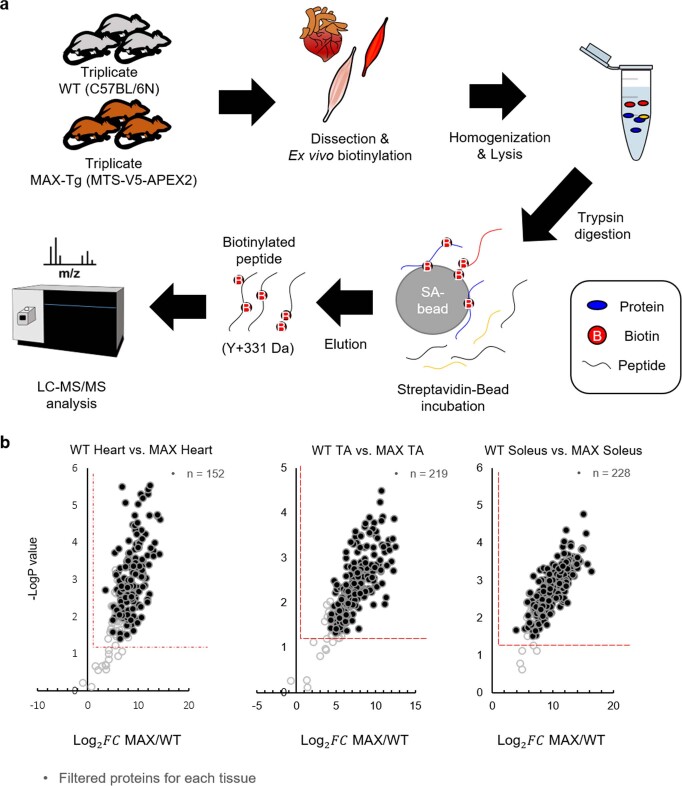
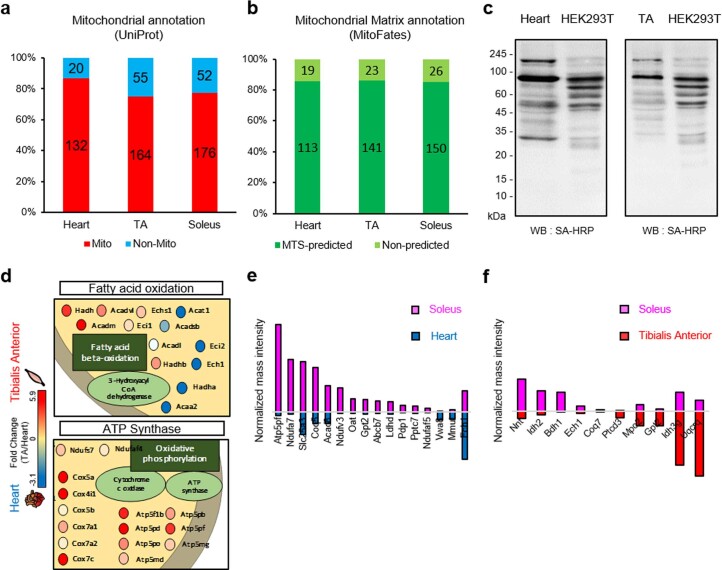
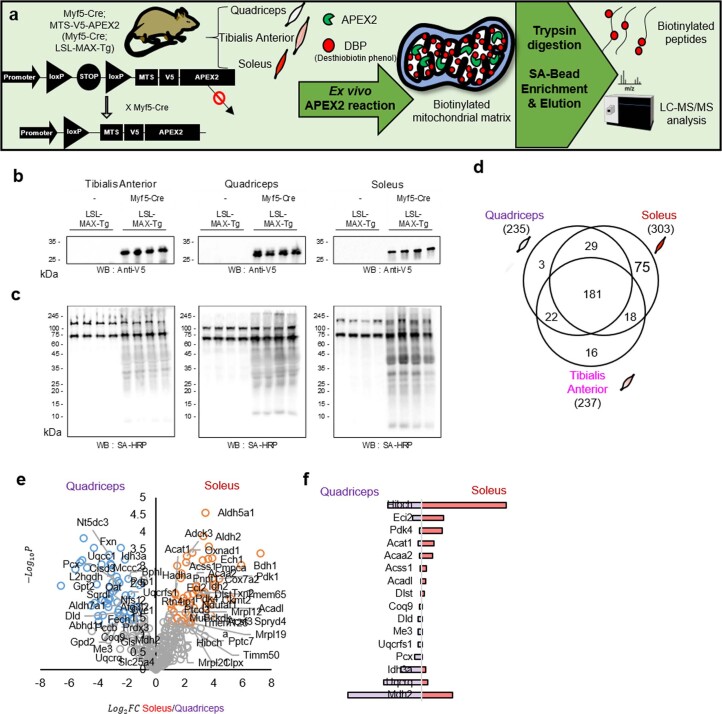
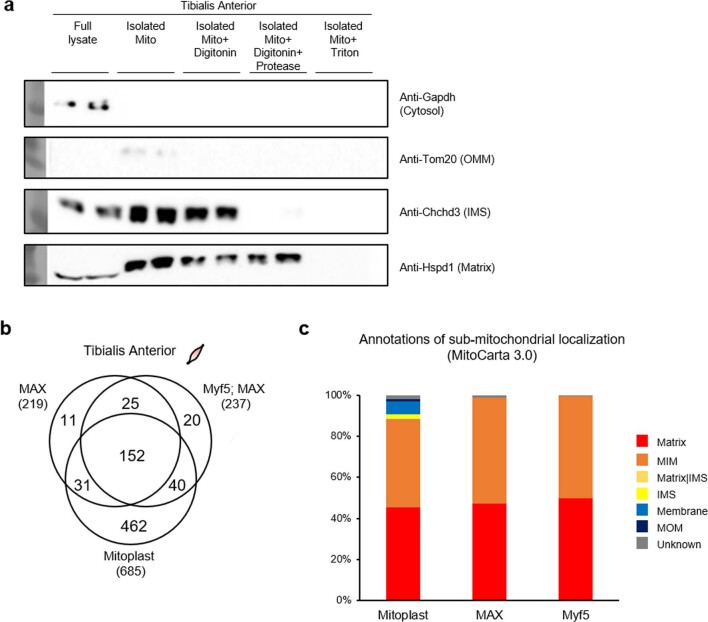
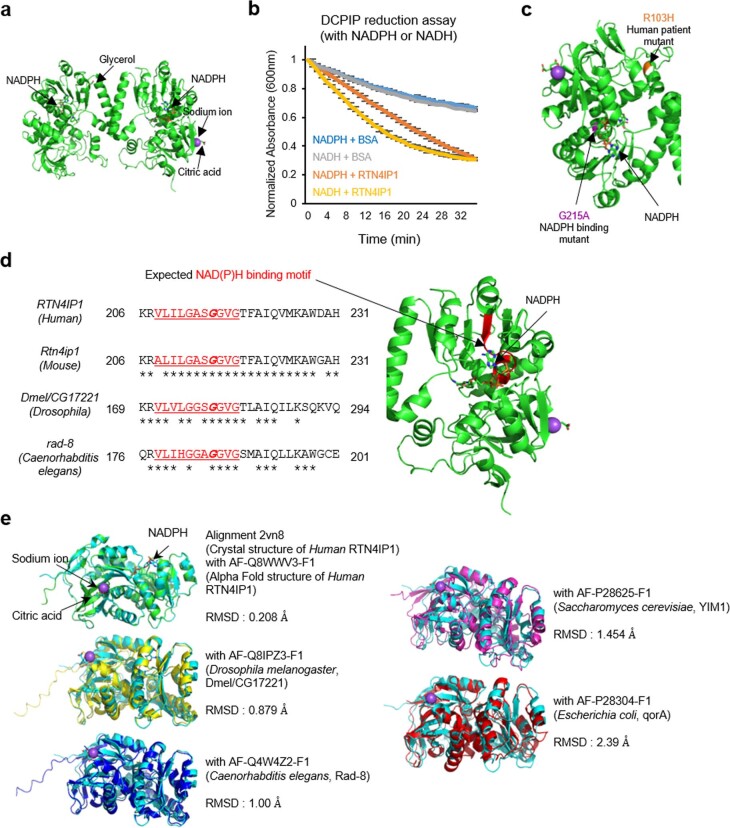
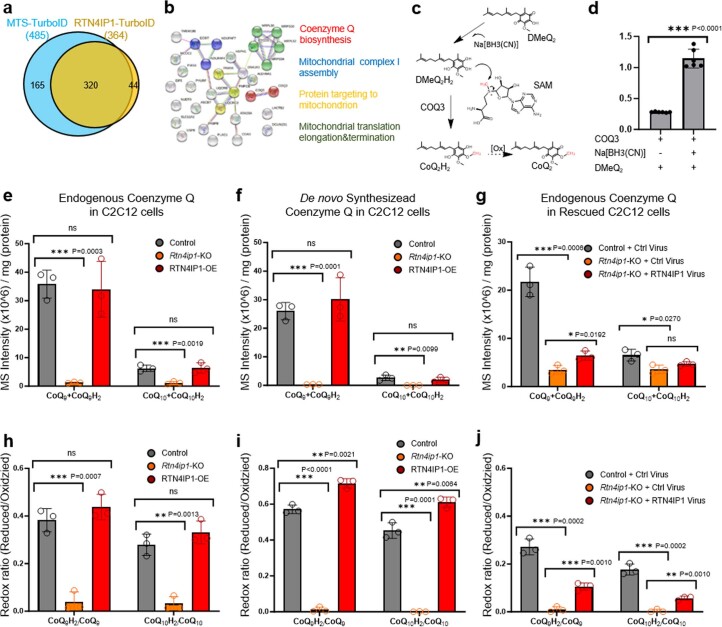
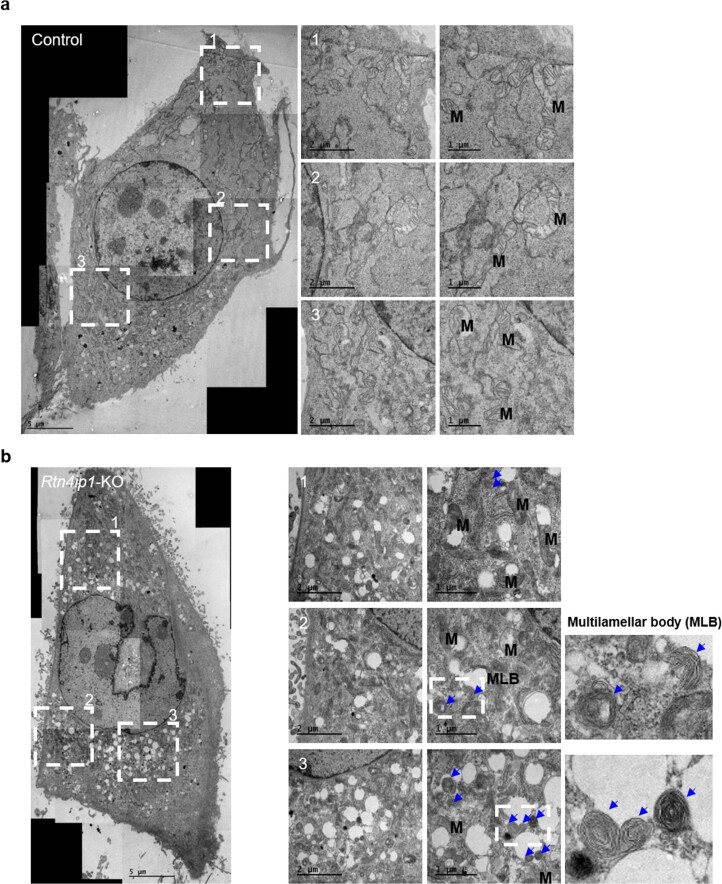
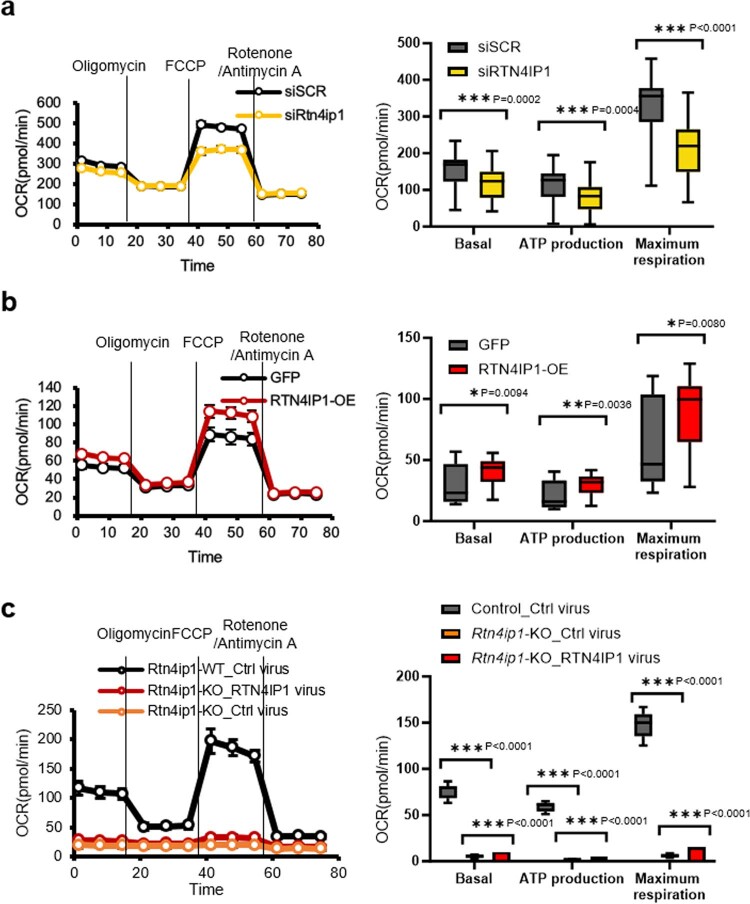
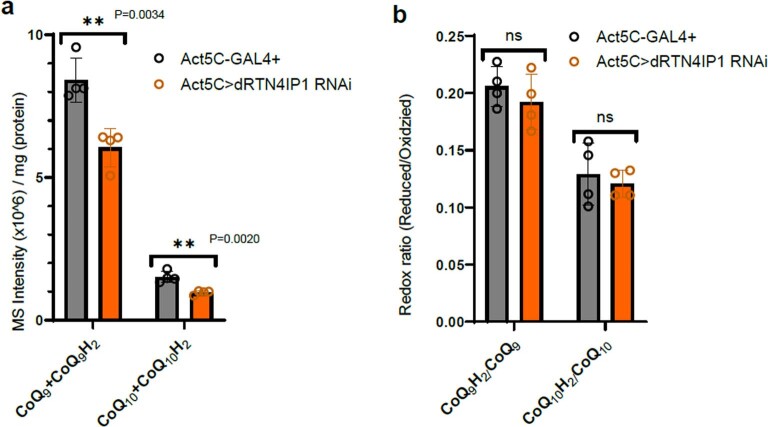
Targeting proximity-labeling enzymes to specific cellular locations is a viable strategy for profiling subcellular proteomes. Here, we generated transgenic mice (MAX-Tg) expressing a mitochondrial matrix-targeted ascorbate peroxidase. Comparative analysis of matrix proteomes from the muscle tissues showed differential enrichment of mitochondrial proteins. We found that reticulon 4-interacting protein 1 (RTN4IP1), also known as optic atrophy-10, is enriched in the mitochondrial matrix of muscle tissues and is an NADPH oxidoreductase. Interactome analysis and in vitro enzymatic assays revealed an essential role for RTN4IP1 in coenzyme Q (CoQ) biosynthesis by regulating the O-methylation activity of COQ3. Rtn4ip1-knockout myoblasts had markedly decreased CoQ9 levels and impaired cellular respiration. Furthermore, muscle-specific knockdown of dRtn4ip1 in flies resulted in impaired muscle function, which was reversed by dietary supplementation with soluble CoQ. Collectively, these results demonstrate that RTN4IP1 is a mitochondrial NAD(P)H oxidoreductase essential for supporting mitochondrial respiration activity in the muscle tissue.


Conflict of interest statement

The authors declare no competing interests.

Figures

Fig. 1
Fig. 1. MTS-APEX2 transgenic (MAX-Tg) mice enable in situ profiling of mitochondrial matrix-specific proteomes.
a, Scheme for tissue-specific mitochondrial matrix proteome mapping using MAX-Tg mice. b, Western blotting of MTS-V5-APEX2 (expected processed molecular weight 28 kDa) in WT, littermate and Tg mice. Representative images from three independent experiments are shown. c, Streptavidin (SA)-horseradish peroxidase western blotting of biotinylated proteins in WT, littermate and Tg mouse tissues after the APEX-mediated in situ biotinylation reaction (that is, DBP and H2O2 treatment). Representative images from three independent experiments are shown. d, Confocal microscopy imaging of MTS-APEX2 in situ biotinylation in the TA muscle of MAX-Tg mice. Scale bars, 5 µm. e, TEM of the mitochondrial matrix expression pattern of MTS-APEX2 in each muscle tissue of MAX-Tg mice. Source data
Fig. 2
Fig. 2. MTS-APEX2 transgenic (MAX-Tg) mice resolve distinct matrix proteomes of different muscle tissues.
a, Heatmap of correlations between mass signal intensities of each replicate sample from WT mice, MAX-Tg mice and HEK293T cells (heart, TA, soleus, HEK293T cells stably expressing MTS-APEX2). Pearson correlation coefficients were calculated from each comparison. Hierarchical clustering was performed based on Pearson correlation coefficients. b, Volcano plot of the DBP-labeled proteome labeled by MTS-APEX2 in HEK293T cells (left) versus the TA muscle (right) from MAX-Tg mice. Statistical significance against the fold change revealed significantly different proteins between the HEK293T and TA muscle proteomes. The top 20 DBP-labeled proteins based on the normalized mass intensities in each sample are marked with filled circles with their gene names (see Supplementary Data 2 for detailed information). c, Top ten abundant DBP-labeled proteins labeled by MTS-APEX2 in TA tissue or HEK293T cells based on the normalized mass intensity. d, Venn diagram of identified mitochondrial matrix proteins from the heart, TA and soleus tissues. Representative proteins are shown with the current subcellular information in UniProt (see Supplementary Data 3 for detailed information). e, Venn diagram showing the overlap in MTS-APEX2-labeled mitochondrial protein identification between genetically different Tg mouse models (MAX-Tg mice and Myf5-Cre;LSL-MAX-Tg mice). See Supplementary Data 5 for detailed information.
Fig. 3
Fig. 3. RTN4IP1 is localized at the mitochondrial matrix and displays NAD(P)H oxidoreductase activity.
a, Western blotting of RTN4IP1 in the heart and three types of skeletal muscle. Anti-ERK1/2 was used as a loading control. Representative images from three independent experiments are shown. b, Confocal microscopy imaging of mitochondrial biotinylation by RTN4IP1-V5-APEX2 in HEK293T cells (anti-V5 imaging with the GFP channel, streptavidin imaging with the Cy5 channel). The N-terminal MTS (~R32) of RTN4IP1 was predicted by MitoFates. Scale bars, 10 µm. c, TEM images of RTN4IP1-APEX2-transfected HEK293T cells (right) and nontransfected HEK293T cells (left). Scale bars, 1 μm. Both samples were treated with DAB and H2O2, followed by OsO4 staining. Mitochondrial matrix DAB/OsO4 staining of RTN4IP1-APEX2 is highlighted in the magnified images of the white boxed region. d, Comparison of the crystal structure between RTN4IP1 and quinone NADPH oxidoreductase (QOR) (PDB ID 1QOR, blue). The molecular structure of cocrystalized NADPH is shown in the structure of RTN4IP1 and QOR. r.m.s.d., root mean-squared deviation. e, Scheme for the DCPIP assay of the QOR activity of RTN4IP1. f, Real-time monitoring results using blue-colored oxidized DCPIP as the quinone substrate (n = 3 independent experiments). DCPIP turns colorless when it accepts an electron from NADPH. BSA was used as a control. g, Real-time monitoring of oxidoreductase activity of mutated RTN4IP1 (G215A or R103H) with DCPIP and NADPH (n = 3 independent experiments). w/o, without. Source data
Fig. 4
Fig. 4. RTN4IP1 is required for CoQ synthesis.
a, Volcano plot of MTS-TurboID (left) versus RTN4IP1-TurboID (right) biotinylated proteins (Supplementary Data 6). Statistical significance against FC revealed significantly different proteins between MTS-TurboID-labeled and RTN4IP1-TurboID-labeled samples. A total of 32 proteins were significantly biotinylated by RTN4IP1-TurboID (RTN4IP1 interactome) (P < 0.05, FC > 2). The proteins clustered by each function are highlighted. See Extended Data Fig. 6b for details. b, Normalized mass signal intensities of the top 20 biotinylated proteins labeled by RTN4IP1-TurboID among the 32 significantly biotinylated proteins. c,d, LC–PRM analysis of RTN4IP1-assisted O-methyltransferase activity of COQ3 using DMeQ2 as a substrate. All samples were incubated with S-adenosyl-methionine (SAM). The measured conversion ratio (that is (CoQ2)/(DMeQ2 and CoQ2)) is shown (n = 6 independent experiments): cofactor test (c) and mutant test (d). e, Proposed scheme for the O-methylation conversion of DMeQ2 to CoQ2 with COQ3/RTN4IP1. fh, Histograms of LC–PRM measurement results for endogenous CoQs (f) and de novo-synthesized heavy CoQs (g) from heavy 4-HB (13C6) treatment in various C2C12 cells: Rtn4ip1-knockout (KO) cells (f), RTN4IP1-OE C2C12 cells (g) and Rtn4ip1-knockout (KO) and RTN4IP1-rescued C2C12 cells (h) (n = 3 biological replicates). The y axis is the normalized mass intensity unit per the sample’s protein mass; representative samples are shown. All precursor ions were cationized and detected as a form of ammonium adduct (NH4+) of the respective CoQ9 and CoQ9H2 molecules. Mean values are shown with error bars representing the standard deviation. Statistical significance was determined using a two-tailed Student’s t-test: *P < 0.05, **P < 0.01, ***P < 0.001; NS, not significant. Source data can be found in the Source Data file. Ctrl, Control. Source data
Fig. 5
Fig. 5. RTN4IP1/OPA10 regulates oxidative stress and mitochondrial respiration.
a, TEM images of control (upper panel) and Rtn4ip1-knockout (KO) (lower panel) C2C12 cells. Mitochondrial structures are marked with ‘M’ and multilamella body structures are marked with blue arrows. b, Magnified TEM images of control (left panel) and Rtn4ip1-KO (right panel) C2C12 cells focusing on the mitochondria. c, Confocal microscopy images of control and Rtn4ip1-KO C2C12 cells. Scale bars, 10 µm. DNA regions oxidized by intracellular ROS were stained with an anti-8-oxo-dG monoclonal antibody and total DNA was stained with 4,6-diamidino-2-phenylindole (DAPI). The average number of 8-OHdG foci per cell was counted in images from control and Rtn4ip1-KO C2C12 cells (n = 3 biological replicates). d, Mitochondrial membrane potential measurement of control and Rtn4ip1-KO C2C12 cells by TMRE fluorescence. Mean fluorescence of the C2C12 cells in each sample was measured by a microplate reader (n = 4 biological replicates). e, Measurement of OCR, basal respiration, maximal respiration and ATP production in control and Rtn4ip1-KO C2C12 cells (n = 45 biological replicates). f, Rescued OCR of Rtn4ip1-KO cells by CoQ2. Basal respiration, ATP production and maximal respiration of CoQ2-treated Rtn4ip1-KO cells (n = 14 biological replicates). Mean values are shown with error bars representing the standard deviation. Statistical significance was determined using a two-tailed Student’s t-test: *P < 0.05, **P < 0.01, ***P < 0.001. Source data can be found in the Source Data file. Source data
Fig. 6
Fig. 6. dRTN4IP1, a Drosophila ortholog of RTN4IP1, is required for CoQ biogenesis and mitochondrial function in Drosophila.
a, Scheme of experiments using Act-GAL4 (whole body) and Mef2-GAL4 (muscle) drivers in dRTN4IP1-knockdown (KD) flies and their phenotypes. b, Histograms of LC–PRM assay results and representative LC–PRM chromatograms of endogenous CoQ9, CoQ9H2, CoQ10 and CoQ10H2, which were all detected as a form of ammonium adduct (NH4+), in control and whole-body Dmel/CG17221-KD fruit fly larvae (n = 4 biological replicates). c, TEM images of the mitochondrial morphology of indirect flight muscle in muscle-specific dRTN4IP1-KD flies. Scale bars, 5 µm (upper) and 1 µm (lower). d, Climbing assay for muscle-specific dRTN4IP1-KD (left), control (middle) and CoQ2-treated flies of muscle-specific dRTN4IP-KD (right). In the negative geotaxis assay, flies climbing over 8 cm were counted over 10 s. For CoQ2 treatment, CoQ2-containing foods (50 μg g−1) were treated to 3–5-day male flies for 24 h (n = 6 biological replicates). e, Proposed model of the RTN4IP1–CoQ axis and its function in the mitochondria. Mean values are shown with error bars representing the standard deviation. Statistical significance was determined using a two-tailed Student’s t-test: *P < 0.05, **P < 0.01, ***P < 0.001. Source data can be found in the Source Data file. Source data
Extended Data Fig. 1
Extended Data Fig. 1. Experimental scheme to profile the mitochondrial matrix proteomes using mouse muscle tissues of MAX-Tg mice.
(a) Scheme of LC-MS/MS analysis using MAX-Tg mice and Spot-ID methodology. (b) Volcano plot for the DBP-labeled proteome of each muscle tissue from WT mice (left) vs. MAX-Tg mice (right). Both samples were treated with the same amount of DBP and H2O2 prior to mass sampling. The cut-off for the mitochondrial matrix proteins was P < 0.05 and fold change (FC) > 2. See Supplementary Data 3 for detailed information.
Extended Data Fig. 2
Extended Data Fig. 2. Asymmetrical DBP-labeled mitochondrial matrix proteins detected by MTS-V5-APEX2 in the TA and heart muscles of MAX-Tg.
(a) Mitochondrial distribution or matrix of the DBP-labeled proteins by MTS-APEX2 in each muscle tissue of MAX-Tg mice. Mitochondrial proteins were classified by annotation of their subcellular localization in UniProt. (b) Mitochondrial matrix distribution of the DBP-labeled proteins by MTS-APEX2 among mitochondrial annotated proteins in indicated muscle tissues of MAX-Tg mice. Mitochondrial matrix proteins were classified with MitoFates prediction. (c) Western blots of biotinylated proteins in MAX-Tg mouse tissues and HEK293T cells expressing MTS-V5-APEX2 after the APEX-mediated in situ biotinylation reaction (that is, DBP and H2O2 treatment). Representative images from three independent experiments are shown. (d) Schematic representation of tissue-enriched mitochondrial proteins with similar metabolic functions in the TA muscle and heart. Heart- and TA-enriched proteins are colored in light blue and pink, respectively. All proteins are color-coded to reflect the fold change of the normalized mass intensity of DBP-labeled peptides in the TA muscle and the heart. Annotations with function and complex are based on the UniProt and CORUM databases. An expanded figure of tissue-enriched mitochondrial proteins (TA vs. heart) is shown in Extended Data Fig. 2f. See Supplementary Data 3 for detailed information. (e) Normalized mass intensities of asymmetrically DBP-labeled mitochondrial matrix proteins by MTS-APEX2 in the heart and soleus muscle. (f) Normalized mass intensities of asymmetrically DBP-labeled mitochondrial matrix proteins by MTS-APEX2 in the TA and soleus muscles. Source data
Extended Data Fig. 3
Extended Data Fig. 3. Muscle cell-type specific mitochondrial proteome mapping using ‘floxed’ LSL-MAX-Tg results (Myf5-Cre; LSL-MAX-Tg).
(a) Scheme for muscle cell-specific mitochondrial matrix proteome mapping using LoxP-Stop-LoxP-MAX-Tg (LSL-MAX-Tg) mouse crossed with Myf5-Cre driver mouse. (b) Western blotting of MTS-V5-APEX2 (expected processed molecular weight: 28 kDa). Representative images from three independent experiments. (c) Streptavidin (SA)-HRP western blotting of biotinylated proteins. Representative images from three independent experiments are shown. (d) Venn diagram of identified mitochondrial matrix proteins from the tibialis anterior, quadriceps, and soleus tissues from Myf5-Cre; LSL-MAX-Tg mice. (see Supplementary Data 4 for detailed information) (e) Volcano plot of the DBP-labeled proteome labeled by MTS-APEX2 in quadriceps (left) vs. soleus (right) from Myf5-Cre; LSL-MAX-Tg mice. Analysis of statistically significant fold change revealed significantly different proteins between the quadriceps proteome and soleus proteome of Myf5-Cre; LSL-MAX-Tg mice. (f) Normalized mass intensities of asymmetrically DBP-labeled mitochondrial matrix proteins by MTS-APEX2 in the quadriceps and soleus muscle of Myf5-Cre; LSL-MAX-Tg mice. Source data
Extended Data Fig. 4
Extended Data Fig. 4. Comparison of sub-mitochondrial protein population in the mitoplast sample and APEX-labeled proteome of MAX-Tg mice (whole body expressed MAX-Tg mice and Myf5-Cre; LSL-MAX-Tg mice).
(a) Validation of mitoplast with western blot using antibodies for sub-mitochondrial marker proteins. Representative images from three independent experiments. (b) Comparison of identified proteins in the mitoplast sample from TA muscle (WT mice), APEX-labeled proteins in TA muscle of MAX-Tg sample and APEX-labeled proteins in TA muscle of Myf5-Cre; MAX-Tg mice (c) Sub-mitochondrial protein population of mitochondria-annotated proteins in the mitoplast, APEX-labeled proteins of MAX-Tg (MAX), APEX-labeled proteins of Myf5-Cre; LSL-MAX-Tg (Myf5-MAX) in TA muscle samples. Sub-mitochondrial protein annotations were generated using Mitocarta3.0 (see Supplementary Data 5 for detailed information). Source data
Extended Data Fig. 5
Extended Data Fig. 5. Structural similarity of human RTN4IP1 and RTN4IP1 orthologs in other organisms.
(a) Crystal structure of RTN4IP1 (dimer form) from Protein Data Bank (PDB ID: 2VN8). (b) Real-time monitoring of the QOR activity of RTN4IP1 with DCPIP and NADPH or NADH (n = 3 independent experiments). (c) Position of mutated amino acid residues (R103H, G215A) in the crystal structure of RTN4IP1. (d) Sequence homology of G125 site at the NAD(P) binding region of RTN4IP1 in other organisms. (e) Structural similarity between the crystal structure of human RTN4IP1 (Uniprot ID: Q8WWV3, PDB ID: 2VN8) and the AlphaFold-predicted structure of human RTN4IP1 (AF-Q8WWV3-F1, https://alphafold.ebi.ac.uk/). Structural similarity between human RTN4IP1 crystal structure (PDB ID: 2VN8) and AlphaFold-predicted structures of RTN4IP1 orthologs in other organisms: CG17221 (Drosophila, AF-Q8IPZ3-F1), Rad-8 (C. elegans, AF-P28625-F1), Yim1p (Yeast, AF-P28625-F1), and qorA(E. coli, AF-P28304-F1) from AlphaFold database.
Extended Data Fig. 6
Extended Data Fig. 6. RTN4IP1 is required for CoQ synthesis.
(a) Number of identified biotinylated proteins by MTS-TurboID or RTN4IP1-TurboID in HEK293T cells via Spot-ID workflow. See Supplementary Data 6 for detailed information. (b) Functional clustering with the RTN4IP1 interactome using STRING analysis. Molecular interaction network of 32 significant proteins biotinylated by RTN4IP1-TurboID (RTN4IP1 interactome) were analyzed by STRING analysis (https://string-db.org/). The clustered molecular functions are marked with different colors: red, coenzyme Q biosynthesis; blue, mitochondrial complex I assembly; green, mitochondrial translation elongation and termination; yellow, protein targeting the mitochondrion. (c) Proposed scheme for the O-methylation conversion of DMeQ2 to CoQ2 with COQ3 and Na[BH3(CN)]. (d) LC-PRM analysis of O-methyltransferase activity of COQ3 using DMeQ2 as a substrate. All samples were incubated with S-adenosyl-methionine (SAM). Measured conversion ratio (that is [CoQ2] / [DMeQ2 and CoQ2]) is shown. (n = 3 independent experiments) (e, f, g) Histograms of LC-PRM assay results of endogenous CoQ9 + CoQ9H2 and CoQ10 + CoQ10H2 (e, g) and de novo synthesized heavy CoQ9 + CoQ9H2 and CoQ10 + CoQ10H2 from heavy 4-HB (13C6) (f) in Rtn4ip1-knockout (KO), control, RTN4IP1-OE, RTN4IP1-rescued C2C12 cells. (n = 3 biological replicates) Y-axis is a normalized mass intensity unit per sample’s mass of protein. (h, i, j) Histogram of LC-PRM assay results representing CoQ9H2 %, CoQ10H2 % in Rtn4ip1-knockout (KO), control, RTN4IP1-OE, RTN4IP1-rescued C2C12 cells. Y-axis of histogram indicates the measured redox state ratio (that is [CoQ9H2]/[CoQ9 and CoQ9H2]). (n = 3 biological replicates) Mean values are shown with error bars representing the standard deviation. Statistical significance was determined using a two-tailed Student’s t-test: *p < 0.05, **p < 0.01, ***p < 0.001. Source data can be found in the Source Data file. Source data
Extended Data Fig. 7
Extended Data Fig. 7. Additional TEM images of control (upper panel) and Rtn4ip1-KO (lower panel) C2C12 cells.
Transmission electron microscopy (TEM) images of control (a) and Rtn4ip1-knockout (KO) (b) C2C12 cells. Mitochondrial structures are marked with ‘M’ and multilamella body (MLB) structures are marked with blue arrows.
Extended Data Fig. 8
Extended Data Fig. 8. Oxygen consumption rate (OCR) and OXPHOS complex expression levels in RTN4IP1-KD C2C12 and RTN4IP1-overexpressed (RTN4IP1-OE) C2C12 cells.
(a) Measurement of oxygen consumption rate (OCR), basal respiration, maximal respiration, and ATP production in control (siSCR) and Rtn4ip1 knockdown C2C12 cells (siRtn4ip1). (n = 46 biological replicates) (b) Oxygen consumption rate (OCR) and basal respiration, ATP production, and maximal respiration of RTN4IP1-overexpressed (RTN4IP1-OE) C2C12 cells. GFP-overexpressed cells were used as a control. (n = 30 biological replicates) (c) Oxygen consumption rate (OCR) and basal respiration, ATP production, and maximal respiration of RTN4IP1-rescued C2C12 cells. GFP-overexpressed cells were used as a control. (n = 30 biological replicates) Mean values are shown with error bars representing the standard deviation. Statistical significance was determined using a two-tailed Student’s t-test: *p < 0.05, **p < 0.01, ***p < 0.001. Source data can be found in the Source Data file. Source data
Extended Data Fig. 9
Extended Data Fig. 9. Coenzyme Q level in whole body Dmel/CG17221-KD fruit fly larvae and control.
(a) Histograms of LC-PRM assay results of endogenous CoQ9 + CoQ9H2 and CoQ10 + CoQ10H2 in control and whole body Dmel/CG17221-KD fruit fly larvae. (n = 4 biological replicates) Y-axis is a normalized mass intensity unit per sample’s mass of protein. (b) Histogram of LC-PRM assay results representing CoQ9H2%, CoQ10H2% in control and whole body Dmel/CG17221-KD fruit fly larvae. Y-axis of the histogram indicates the measured redox state ratio (that is, [CoQ9H2]/[CoQ9 and CoQ9H2]). (n = 4 biological replicates) Mean values are shown with error bars representing the standard deviation. Statistical significance was determined using a two-tailed Student’s t-test: *p < 0.05, **p < 0.01, ***p < 0.001. Source data can be found in the Source Data file. Source data

References

    1. Uhlen M, et al. Tissue-based map of the human proteome. Science. 2015;347:1260419. doi: 10.1126/science.1260419. - DOI - PubMed
    1. Uhlen M, et al. A genome-wide transcriptomic analysis of protein-coding genes in human blood cells. Science. 2019;366:eaax9198. doi: 10.1126/science.aax9198. - DOI - PubMed
    1. Zick M, Rabl R, Reichert AS. Cristae formation-linking ultrastructure and function of mitochondria. Biochim. Biophys. Acta. 2009;1793:5–19. doi: 10.1016/j.bbamcr.2008.06.013. - DOI - PubMed
    1. Pette D, Vrbová G. What does chronic electrical stimulation teach us about muscle plasticity. Muscle Nerve. 1999;22:666–677. doi: 10.1002/(SICI)1097-4598(199906)22:6<666::AID-MUS3>3.0.CO;2-Z. - DOI - PubMed
    1. Williams EG, et al. Quantifying and localizing the mitochondrial proteome across five tissues in a mouse population. Mol. Cell Proteom. 2018;17:1766–1777. doi: 10.1074/mcp.RA118.000554. - DOI - PMC - PubMed

Publication types