. 2023 Oct 26;24(1):644.
doi: 10.1186/s12864-023-09756-w.

Transcriptomic analysis reveals a tissue-specific loss of identity during ageing and cancer

Affiliations

Transcriptomic analysis reveals a tissue-specific loss of identity during ageing and cancer

Gabriel Arantes Dos Santos et al. BMC Genomics. .

Abstract

Introduction: Understanding changes in cell identity in cancer and ageing is of great importance. In this work, we analyzed how gene expression changes in human tissues are associated with tissue specificity during cancer and ageing using transcriptome data from TCGA and GTEx.

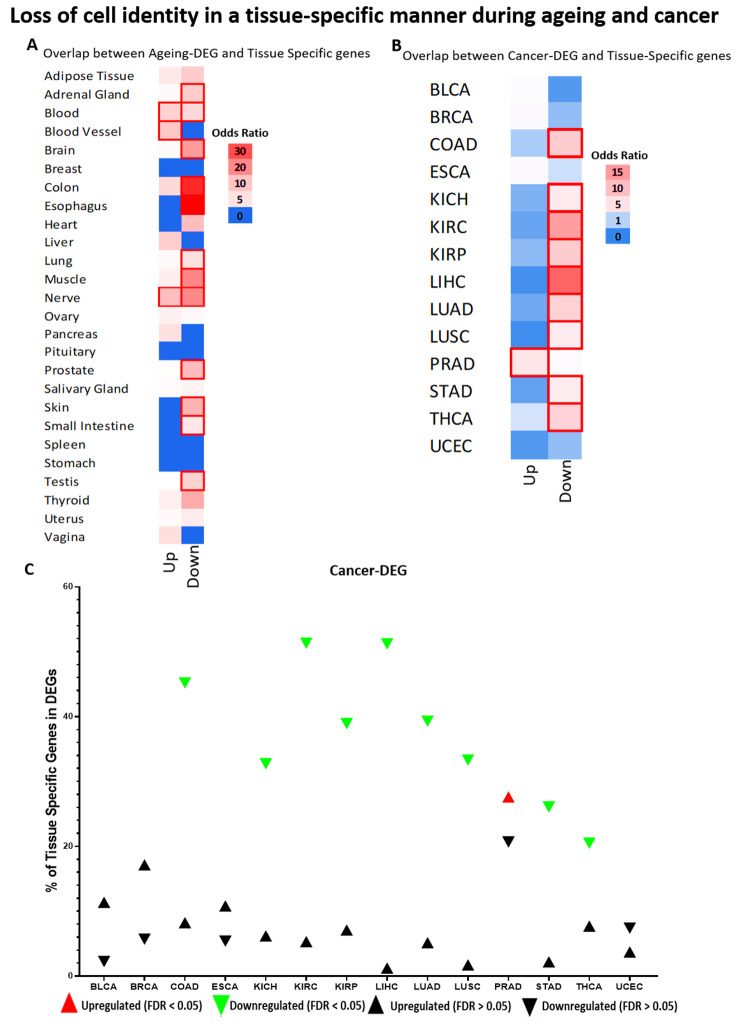
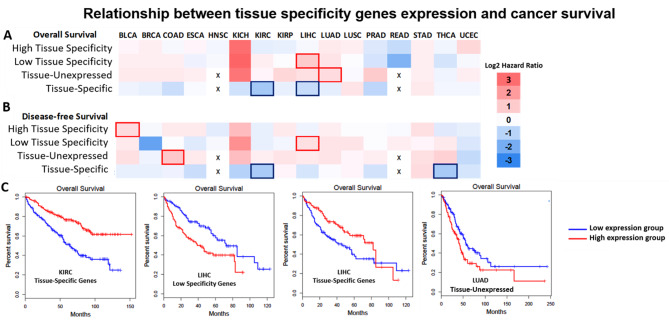
Results: We found significant downregulation of tissue-specific genes during ageing in 40% of the tissues analyzed, which suggests loss of tissue identity with age. For most cancer types, we have noted a consistent pattern of downregulation in genes that are specific to the tissue from which the tumor originated. Moreover, we observed in cancer an activation of genes not usually expressed in the tissue of origin as well as an upregulation of genes specific to other tissues. These patterns in cancer were associated with patient survival. The age of the patient, however, did not influence these patterns.

Conclusion: We identified loss of cellular identity in 40% of the tissues analysed during human ageing, and a clear pattern in cancer, where during tumorigenesis cells express genes specific to other organs while suppressing the expression of genes from their original tissue. The loss of cellular identity observed in cancer is associated with prognosis and is not influenced by age, suggesting that it is a crucial stage in carcinogenesis.

Keywords: Functional genomics; Geriatric oncology; Geroscience; Oncogenomics.


Conflict of interest statement

JPM is an advisor/consultant for the Longevity Vision Fund, NOVOS, YouthBio Therapeutics and the founder of Magellan Science Ltd, a company providing consulting services in longevity science. GAS, KC and, RAA have no conflicts to declare.

Figures

Fig. 1
Fig. 1
Overlap between DEGs and Tissue-Specific genes in ageing (A) and cancer (B, C). A-B Heatmap of odds ratio on the chance of the overlap. Red borders represent significant results (FDR < 0.05). A Ageing-DEGs, B Cancer-DEGs. “Up” and “Down” represent whether genes are upregulated or downregulated. C Percentages of tissue specific-genes for each tissue that are differentially expressed in cancer. Each triangle represents the percentage of genes and the direction of expression. Coloured triangles are the statistically significant results
Fig. 2
Fig. 2
Overlap between DEGs and tissue specificity categories. Heatmap of odds ratio on the chance of the overlap. Red borders represent significant results (FDR < 0.05). A-B Ageing-DEGs; C-D Cancer-DEGs. Inf = Odds ratio tends to infinity due to the low number of downregulated DEGs, but the result is not significant. “Up” and “Down” represent whether genes are upregulated or downregulated. “High” an “Low” represents Pan-Tissue group of genes with overall high or low tissue-specific expression across tissues
Fig. 3
Fig. 3
Relationship between tissue specificity genes and cancer survival. A and B Heat map of hazard ratio of overall and disease-free survival, respectively, statistically significant results (Mantel-Cox test, FDR < 0.1) are highlighted with blue or red borders, according to the direction of the expression signature and the worst survival. The x represents where analysis cannot be done in a tissue-specific manner. C) Kaplan-Meier curves of the significant overall survival results from the previous heatmap
Fig. 4
Fig. 4
Overlap between cancer-DEGs and tissue specificity categories considering patient age groups. A-C, heatmap of odds ratio on the chance of the overlap. Red borders represent significant results (FDR < 0.05). D-G, plots comparing the expression level (Fold Change) of the overlap genes between DEGs and specificity categories in the two age groups (red = old and blue = young) significant results are represented with * (FDR < 0.05). Error bars represent the maximum and minimum values. Number of genes in each group is in parentheses on the x-axis. “Up” and “Down” represent whether genes are upregulated or downregulated. The “Old” is composed of DEGs resulting from the comparison between the 30% oldest cancer samples and the 30% oldest non-cancer tissue samples. The “Young” is obtained in a similar manner, but using the 30% youngest samples

Similar articles

Cited by

References

    1. Sul JY, Wu CW, Zeng F, Jochems J, Lee MT, Kim TK, et al. Transcriptome transfer produces a predictable cellular phenotype. Proc Natl Acad Sci U S A. 2009;106(18):7624–9. doi: 10.1073/pnas.0902161106. - DOI - PMC - PubMed
    1. Fang H, Yang Y, Li C, Fu S, Yang Z, Jin G, et al. Transcriptome analysis of early organogenesis in human embryos. Dev Cell. 2010;19(1):174–84. doi: 10.1016/j.devcel.2010.06.014. - DOI - PubMed
    1. Chatsirisupachai K, Palmer D, Ferreira S, de Magalhães JP. A human tissue-specific transcriptomic analysis reveals a complex relationship between aging, cancer, and cellular senescence. Aging Cell. 2019;18(6):e13041. doi: 10.1111/acel.13041. - DOI - PMC - PubMed
    1. Izgi H, Han D, Isildak U, Huang S, Kocabiyik E, Khaitovich P et al. Inter-tissue convergence of gene expression during ageing suggests age-related loss of tissue and cellular identity. Elife. 2022;11. - PMC - PubMed
    1. Dönertaş HM, İzgi H, Kamacıoğlu A, He Z, Khaitovich P, Somel M. Gene expression reversal toward pre-adult levels in the aging human brain and age-related loss of cellular identity. Sci Rep. 2017;7(1):5894. doi: 10.1038/s41598-017-05927-4. - DOI - PMC - PubMed