. 2023 Oct 26;21(1):756.
doi: 10.1186/s12967-023-04622-5.

Mitochondrial modulation with leriglitazone as a potential treatment for Rett syndrome

Affiliations

Mitochondrial modulation with leriglitazone as a potential treatment for Rett syndrome

Uliana Musokhranova et al. J Transl Med. .

Abstract

Background: Rett syndrome is a neuropediatric disease occurring due to mutations in MECP2 and characterized by a regression in the neuronal development following a normal postnatal growth, which results in the loss of acquired capabilities such as speech or purposeful usage of hands. While altered neurotransmission and brain development are the center of its pathophysiology, alterations in mitochondrial performance have been previously outlined, shaping it as an attractive target for the disease treatment.

Methods: We have thoroughly described mitochondrial performance in two Rett models, patients' primary fibroblasts and female Mecp2tm1.1Bird-/+ mice brain, discriminating between different brain areas. The characterization was made according to their bioenergetics function, oxidative stress, network dynamics or ultrastructure. Building on that, we have studied the effect of leriglitazone, a PPARγ agonist, in the modulation of mitochondrial performance. For that, we treated Rett female mice with 75 mg/kg/day leriglitazone from weaning until sacrifice at 7 months, studying both the mitochondrial performance changes and their consequences on the mice phenotype. Finally, we studied its effect on neuroinflammation based on the presence of reactive glia by immunohistochemistry and through a cytokine panel.

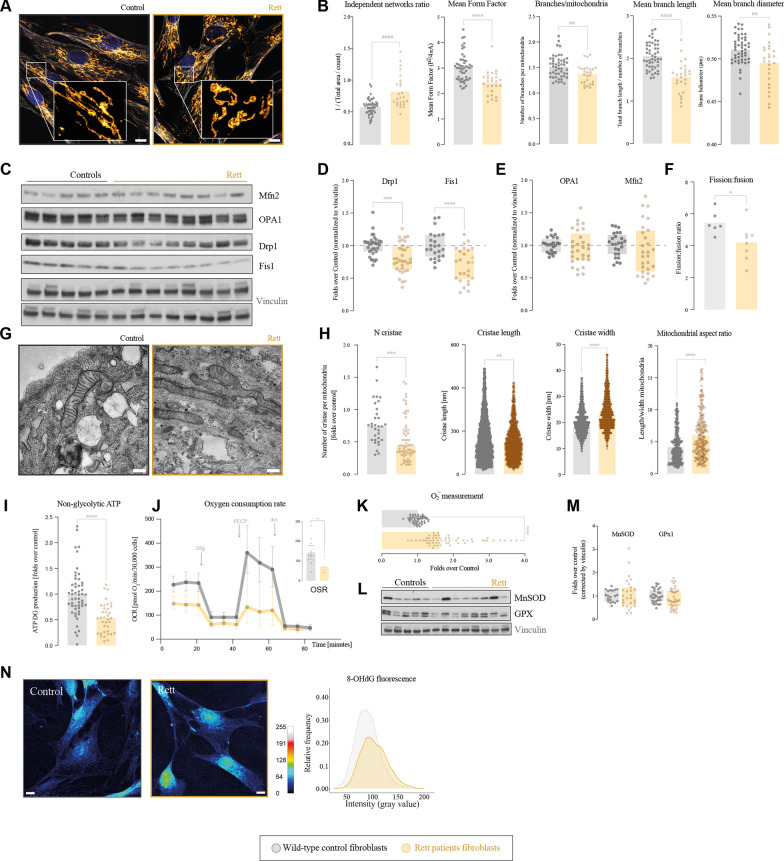
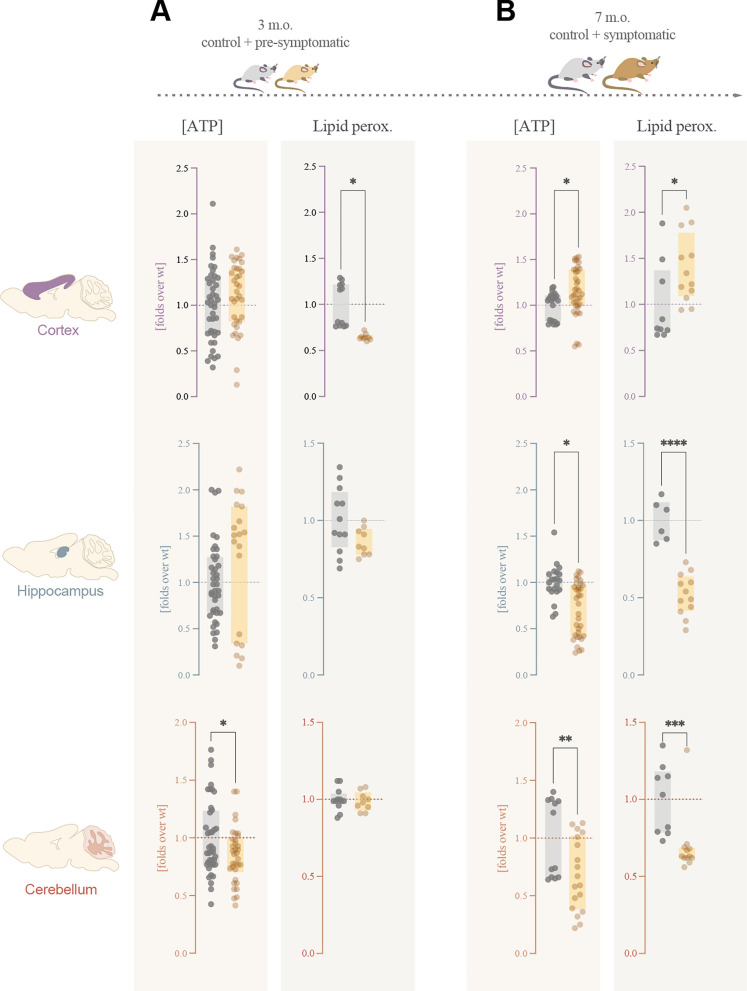
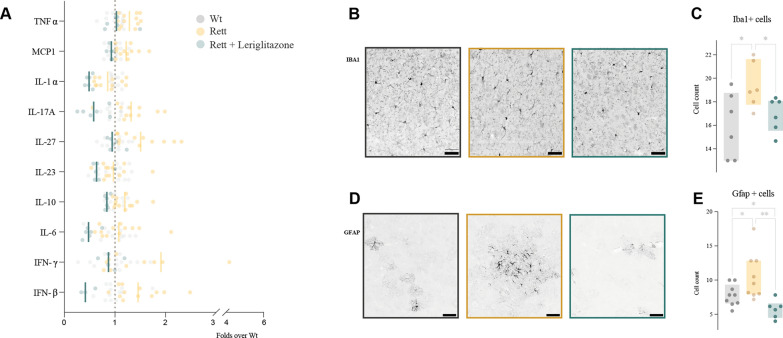
Results: We have described mitochondrial alterations in Rett fibroblasts regarding both shape and bioenergetic functions, as they displayed less interconnected and shorter mitochondria and reduced ATP production along with increased oxidative stress. The bioenergetic alterations were recalled in Rett mice models, being especially significant in cerebellum, already detectable in pre-symptomatic stages. Treatment with leriglitazone recovered the bioenergetic alterations both in Rett fibroblasts and female mice and exerted an anti-inflammatory effect in the latest, resulting in the amelioration of the mice phenotype both in general condition and exploratory activity.

Conclusions: Our studies confirm the mitochondrial dysfunction in Rett syndrome, setting the differences through brain areas and disease stages. Its modulation through leriglitazone is a potential treatment for this disorder, along with other diseases with mitochondrial involvement. This work constitutes the preclinical necessary evidence to lead to a clinical trial.

Keywords: Bioenergetics; Leriglitazone; Metabolic modulation; Mitochondria; Neuroinflammation; Rett syndrome.


Conflict of interest statement

Pilar Pizcueta, Cristina Vergara, Laura Rodríguez-Pascau and Marc Martinell are staff from the pharmaceutic company Minoryx Therapeutics. Marc Martinell and Pilar Pizcueta report a patent application (10198126) issued on January 15th 2019 for the use of leriglitazone described in this paper. The patent will be owned by those authors. Marc Martinell is the cofounder of Minoryx Threapeutics, focused on the development of therapies for rare neurodegenerative diseases. The rest of the authors declare no competing interests.

Figures

Fig. 1
Fig. 1
Rett syndrome primary fibroblasts recapitulate alterations in mitochondrial homeostasis. We have focused the analysis on mitochondrial shape (AH) and energy production (IN). Mitochondrial network shape was studied by immunofluorescence of mitochondrial marker TOMM20 and parametrization with “Mitochondria Analyzer” plugin; A representative image of mitochondrial network IF (TOMM20 in yellow, nuclei in blue, and tubulin in grey; scale bar 10 µm; 6× zoomed section included in the white box) and (B) parametrization of number of independent networks corrected by area and mean form factor (a shape measure given by: P^2/(4piA): 1 indicates round object and increases with elongation, expressed as mean FF of objects in image), number of branches per mitochondrial network, and mean branch length and diameter. CE Analysis and densitometry quantification of mitochondrial dynamics associated proteins Mfn2, OPA1, Drp1 and Fis1 by Western blot and corrected by vinculin. F Quantification of the fission and fusion events from in vivo imaging of mitochondrial network. Analysis of mitochondrial ultrastructure was performed by transmission electron microscopy; G representative images (scale bar 300 nm) and H parametrization of number of cristae per mitochondria, cristae length and width, and mitochondrial major:minor axis ratio. I Non-glycolytic ATP production –assumed as mitochondrial ATP– measured by luciferin-luciferase luminescence upon incubation with 2-deoxyglucose. J Mitochondrial respiration profile was measured by Seahorse in the presence of oligomycin, FCCP and Antimycin A. Oligomycin Sensitive Respiration (OSR) was calculated as the difference of oxygen consumption before and after adding oligomycin (considered as ATP-linked respiration). K O2.− production measured by flow cytometry with the MitoSOX probe L Expression of antioxidant enzymes MnSOD and GPX by Western blot, and M quantification of densitometry corrected by vinculin. N Oxidative damage was detected based on the fluorescence of RNA oxidative damage marker 8-OHdG, showed with the intensity-revealing LUT “royal” (calibration bar shown at the lower right corner of the panel), at 63× magnification; scale bar represents 10 µm, and represented as relative frequency of intensity values, calculated with Fiji software. All experiments were done in at least two different Rett and control cell lines, with three technical replicates and each experiment was done in triplicates. Statistical analyses were performed as described in Materials and Methods. *p < 0.05, **p < 0.01, ***p < 0.001, ****p < 0.0001. Absence of asterisk means no statistically significant difference. Control fibroblasts in grey; Rett patients’ fibroblasts in yellow
Fig. 2
Fig. 2
Bioenergetic characterization of pre-symptomatic (3 m.o.) and symptomatic (7 m.o.) Rett mice. Given the time-dependent character of Rett syndrome, we studied both wild-type and Rett mice at two development time points: A pre-symptomatic (3 months) and B post-symptomatic (7 months) brains. At the time points, mice brains were dissected and subjected to analysis. ATP concentration by luciferin-luciferase luminescence and lipid peroxidation by TBARS were analysed in three brain areas: cortex, hippocampus and cerebellum. All experiments were done in at least three different mice, with three technical replicates. The ATP production experiment was done in triplicates, while lipid peroxidation was a unique experiment. Statistical analyses were performed as described in Materials and Methods. *p < 0.05, **p < 0.01, ***p < 0.001, ****p < 0.0001. Absence of asterisk means no statistically significant difference. Wild-type female mice in grey; Rett female mice in yellow
Fig. 3
Fig. 3
Correction by leriglitazone of both bioenergetics and oxidative stress in Rett fibroblasts. A Schematic representation of leriglizatone (LGZ) and its activity as a PPARγ agonist in a cell. LGZ binds to PPARγ, activating the expression of the genes under its regulation through interaction with PGC1α. B LGZ effect was evaluated first on Rett fibroblasts at two concentrations, 100 nM and 500 nM for 48 h. C PPARγ pathway activation has an effect on the detection of all electron-transport chain complexes, detected by Western blot and densitometry quantification corrected by vinculin. The ultimate goal of LGZ treatment was to correct the previously described alterations, observing significant corrections in ATP (D), ROS production (E) and (F) oxidative damage measured in terms of 8-OHdG detection. Images are shown with the intensity-revealing LUT “royal”, at a 63× magnification; scale bar represents 10 µm. Images were quantified and statistical significance of corrections was evaluated (G). All experiments were done in at least two different control and Rett cell lines, with three technical replicates and each experiment was done in triplicates. Statistical analysis was performed as described in Materials and Methods. *p < 0.05, **p < 0.01, ***p < 0.001, ****p < 0.0001. Absence of asterisk means no statistically significant difference. Control fibroblasts in grey; Rett patients’ fibroblasts in yellow; LGZ-treated Rett patients’ fibroblasts in green
Fig. 4
Fig. 4
Correction by LGZ of the bioenergetic component in hippocampus and cerebellum, together with a phenotypic amelioration in symptomatic Rett mice. A Treatment with LGZ was assayed in Rett mice, treating them from weaning until sacrifice at the symptomatic stage (7 m.o.). Both ATP concentration (detected by bioluminescence) and lipid peroxidation (detected by TBARS) were assayed in untreated and LGZ-treated Rett mice in B cortex, C hippocampus and D cerebellum. E to G show results regarding oxidative stress and antioxidant markers in the brain areas of interest. E Detection of the RNA oxidative damage marker 8-OHdG in cerebellum by immunofluorescence. 8-OHdG staining is shown in magenta and calbindin in yellow for Purkinje cells in the upper images at 10× magnification; in the lower images 8-OHdG is shown with the intensity-revealing LUT “Green Fire Blue”, with a 2× electronic zoom; scale bar represents 50 µm in both images. F Antioxidant markers MnSOD and GPX in cortex, hippocampus and cerebellum detected by western blot, and their respective densitometry quantification, normalized by tubulin (G). Phenotypical characterization of the treated mice, registering an improvement in the General Health Score (H), which was maintained until the endpoint (I) and a recovery of the explorative behaviour of Rett mice upon treatment in the NOR-test (J). All experiments were done in at least three different mice, with three technical replicates and each experiment was done in triplicated (except for lipid peroxidation). Statistical analysis was performed as described in Materials and Methods. *p < 0.05, **p < 0.01, ***p < 0.001, ****p < 0.0001. Absence of asterisk means no statistically significant difference. Wild-type female mice in grey; Rett female mice in yellow; LGZ-treated Rett female mice in green
Fig. 5
Fig. 5
Neuroinflammatory component in cerebral cortex of symptomatic Rett mice is corrected after leriglitazone treatment. A Rett cerebral cortex at 7 m.o. showed a pattern of increased cytokines expression detected by flow cytometry, that was corrected in leriglitazone-treated mice (Nested one-way ANOVA analysis; p-value Rett vs wt = ** 0.0016; Rett vs Rett + leriglitazone = **** < 0.0001) B Iba1 and D GFAP cell-positive number were appraised, as microglia and astrocytic specific markers, respectively. C, E Quantifications of Iba1- and GFAP-positive cells revealed an increase in microglia and active astrocytes in symptomatic Rett mice cortex compatible with neuroinflammation, that was corrected with LGZ for both markers. Images were taken at a 10 × magnification (and 2.5 × electronic zoom for Iba1 images). Scale bar represents 50 µm. Statistical analyses were performed as described in Materials and Methods. *p < 0.05, **p < 0.01. Absence of asterisk means no statistically significant difference. Wild-type female mice in grey; Rett female mice in yellow; LGZ-treated Rett female mice in green
Fig. 6
Fig. 6
Effect of leriglitazone in fibroblasts from primary mitochondrial diseases. Given LGZ mechanism of action we investigated its potential effect on the treatment of mitochondrial diseases. For that, we selected fibroblasts from a patient bearing mutations in NDUFS1, which affect the bioenergetic function. A Non-glycolytic ATP concentration detected by luciferin-luciferase luminescence upon incubation with 2-deoxyglucose, and B O2 generation—detected with MitoSOX probe by flow cytometry—were evaluated, confirming the effect of leriglitazone in mitochondrial patients. All experiments were done in at least two technical replicates and each experiment was done in triplicates. Statistical analyses were performed as described in Materials and Methods. *p < 0.05, **p < 0.01, ****p < 0.0001. Absence of asterisk means no statistically significant difference. Control fibroblasts in grey; NDUFS1-patient’s fibroblasts in blue; LGZ-treated NDUFS1-patient’s fibroblasts in rouge

References

    1. Feldman D, Banerjee A, Sur M. Developmental dynamics of Rett syndrome. Neural Plast. 2016;2016:6154080. - PMC - PubMed
    1. Leonard H, Cobb S, Downs J. Clinical and biological progress over 50 years in Rett syndrome. Nat Rev Neurol. 2017;13(1):37–51. - PubMed
    1. Ure K, Lu H, Wang W, Ito-Ishida A, Wu Z, He L-J, et al. Restoration of Mecp2 expression in GABAergic neurons is sufficient to rescue multiple disease features in a mouse model of Rett syndrome. Elife. 2016;5:e14198. - PMC - PubMed
    1. Guy J, Gan J, Selfridge J, Cobb S, Bird A. Reversal of neurological defects in a mouse model of Rett syndrome. Science. 2007;315(5815):1143–1147. - PMC - PubMed
    1. Panayotis N, Ehinger Y, Felix MS, Roux J-C. State-of-the-art therapies for Rett syndrome. Dev Med Child Neurol. 2023;65(2):162–170. - PMC - PubMed

Publication types