

Intra-individual qualitative and quantitative comparison of [68Ga]Ga-DOTATATE PET/CT and PET/MRI
- PMID: 37885461
- PMCID: PMC10599114
- DOI: 10.1177/17588359231189133
Intra-individual qualitative and quantitative comparison of [68Ga]Ga-DOTATATE PET/CT and PET/MRI
Abstract
Background: Somatostatin receptor (SSTR) positron emission tomography (PET) is a cornerstone of neuroendocrine tumor (NET) management. Hybrid PET/magnetic resonance imaging (MRI) is now available for NET-imaging, next to PET/computed tomography (CT).
Objectives: To determine whether CT or MRI is the best hybrid partner for [68Ga]Ga-DOTATATE PET.
Design: Monocentric, prospective study.
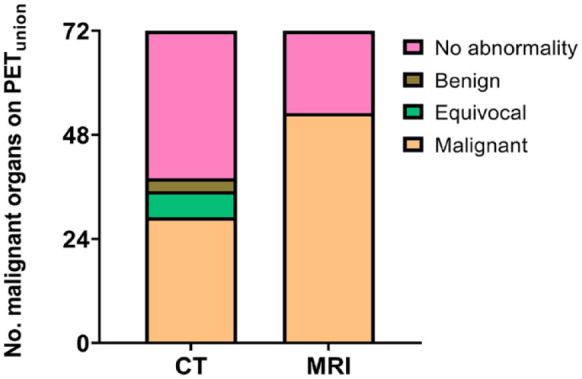
Methods: Patients received a same-day [68Ga]Ga-DOTATATE PET/CT and subsequent PET/MRI, for suspicion of NET, (re)staging or peptide receptor radionuclide therapy-selection. The union (PETunion) of malignant lesions detected on PETCT and PETMRI was the reference standard. Concordance of detection of malignant lesions in an organ was measured between PETunion and CT and PETunion and MRI. Seven bins were used to categorize the number of malignant lesions, containing following ordinal variables: 0, 1, 2-5, 6-10, 11-20, >20 countable and diffuse/uncountable. The difference in number of malignant lesions was obtained as the difference in bin level ('Δbin') between PETunion and CT and PETunion and MRI with a Δbin closer to zero implying a higher concordance rate.
Results: Twenty-nine patients were included. Primary tumors included 17 gastroenteropancreatic-NETs, 1 colon neuroendocrine carcinoma, 7 lung-NETs and 2 meningiomas. Patient level concordance with PETunion was 96% for MRI and 67% for CT (p = 0.039). Organ level concordance with PETunion was 74% for MRI and 40% for CT (p < 0.0001). In bone, there was a higher concordance rate for MRI compared to CT, 92% and 33%, respectively (p = 0.016). Overall, a mean Δbin of 0.5 ± 1.1 for PETunion/MRI and 1.4 ± 1.2 for PETunion/CT (p < 0.0001) was noted. In liver, a mean Δbin of 0.0 ± 1.1 for PETunion/MRI and 1.7 ± 1.2 for PETunion/CT was observed (p = 0.0078). In bone, a mean Δbin closer to zero was observed for PETunion/MRI compared to PETunion/CT, 0.6 ± 1.4 and 2.0 ± 1.5, respectively (p = 0.0098).
Conclusions: Compared to SSTR PET/CT, SSTR PET/MRI had a higher patient and organ level concordance for malignant tumoral involvement and number of malignant lesions, with a clear added value in bone and liver specifically.
Keywords: Krenning score; PET/CT; PET/MRI; SSTR; [68Ga]Ga-DOTATATE; neuroendocrine tumor.
© The Author(s), 2023.
Conflict of interest statement
No conflicts of interest relevant to this work exist. CMD has been a consultant for Terumo, Ipsen, Sirtex, Bayer and PSI CRO. KVL has received speaker fees from GE Healthcare.
Figures


References
-
- Weckbecker G, Lewis I, Albert R, et al.. Opportunities in somatostatin research: biological, chemical and therapeutic aspects. Nat Rev Drug Discov 2003; 2: 999–1017. - PubMed
-
- Sundin A, Arnold R, Baudin E, et al.. ENETS consensus guidelines for the standards of care in neuroendocrine tumors: radiological, nuclear medicine & hybrid imaging. Neuroendocrinology 2017; 105: 212–244. - PubMed
-
- Papotti M, Bongiovanni M, Volante M, et al.. Expression of somatostatin receptor types 1–5 in 81 cases of gastrointestinal and pancreatic endocrine tumors. A correlative immunohistochemical and reverse-transcriptase polymerase chain reaction analysis. Virchows Arch 2002; 440: 461–475. - PubMed
-
- Zahel T, Krysa S, Herpel E, et al.. Phenotyping of pulmonary carcinoids and a Ki-67-based grading approach. Virchows Arch 2012; 460: 299–308. - PubMed
LinkOut - more resources
Full Text Sources
