[Preprint]. 2023 Oct 9:rs.3.rs-3399145.
doi: 10.21203/rs.3.rs-3399145/v1.

Multi-ancestry Polygenic Mechanisms of Type 2 Diabetes Elucidate Disease Processes and Clinical Heterogeneity

Affiliations

Multi-ancestry Polygenic Mechanisms of Type 2 Diabetes Elucidate Disease Processes and Clinical Heterogeneity

Kirk Smith et al. Res Sq. .

Update in

  • Multi-ancestry polygenic mechanisms of type 2 diabetes.
    Smith K, Deutsch AJ, McGrail C, Kim H, Hsu S, Huerta-Chagoya A, Mandla R, Schroeder PH, Westerman KE, Szczerbinski L, Majarian TD, Kaur V, Williamson A, Zaitlen N, Claussnitzer M, Florez JC, Manning AK, Mercader JM, Gaulton KJ, Udler MS. Smith K, et al. Nat Med. 2024 Apr;30(4):1065-1074. doi: 10.1038/s41591-024-02865-3. Epub 2024 Mar 5. Nat Med. 2024. PMID: 38443691 Free PMC article.

Abstract

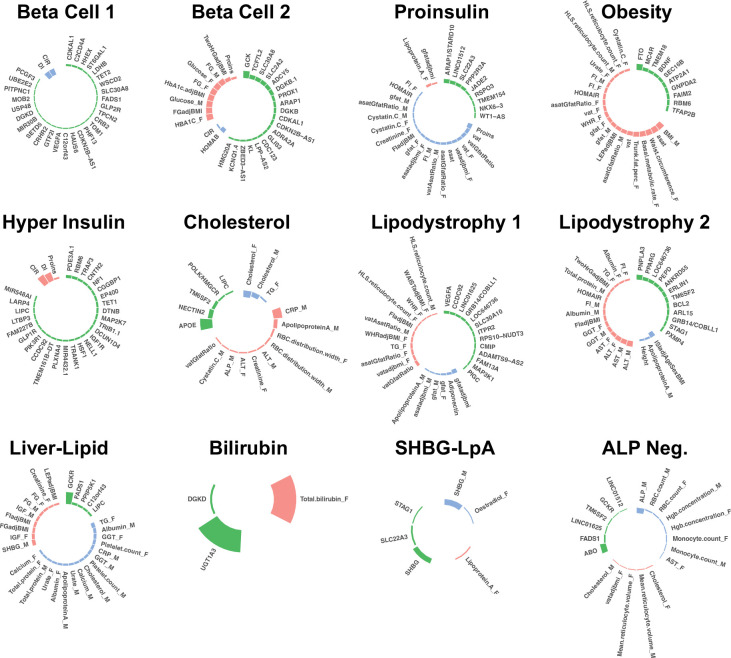
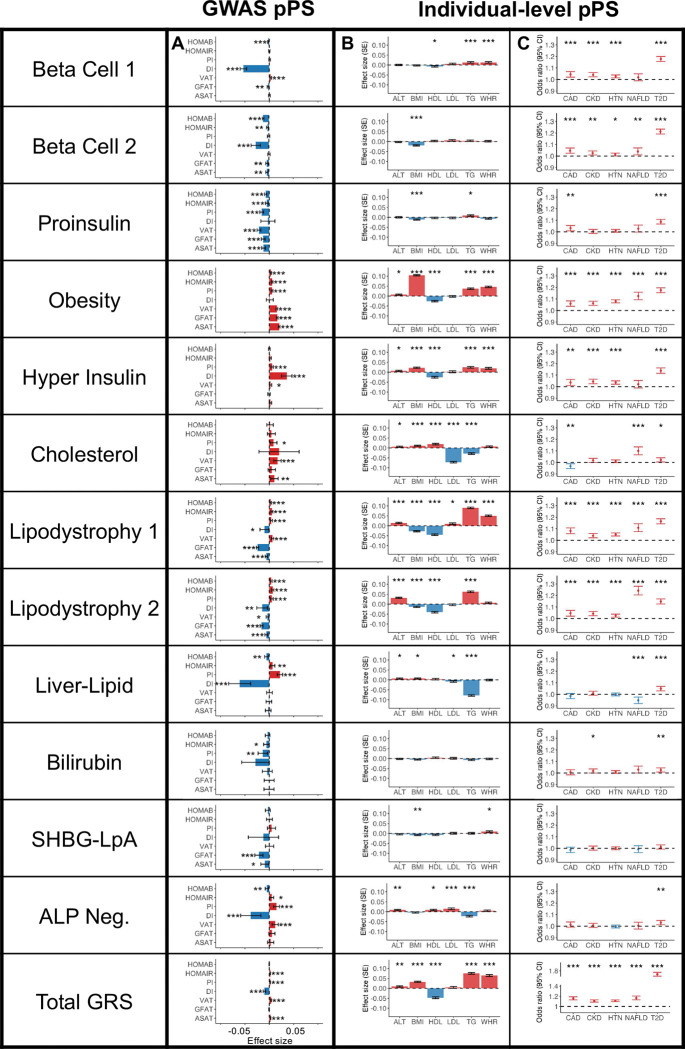
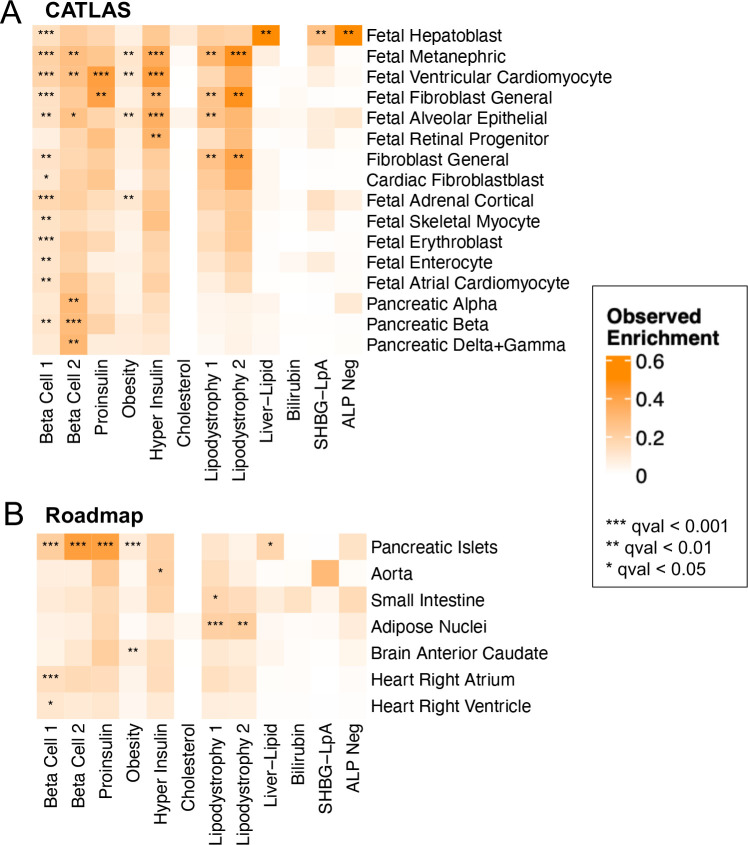
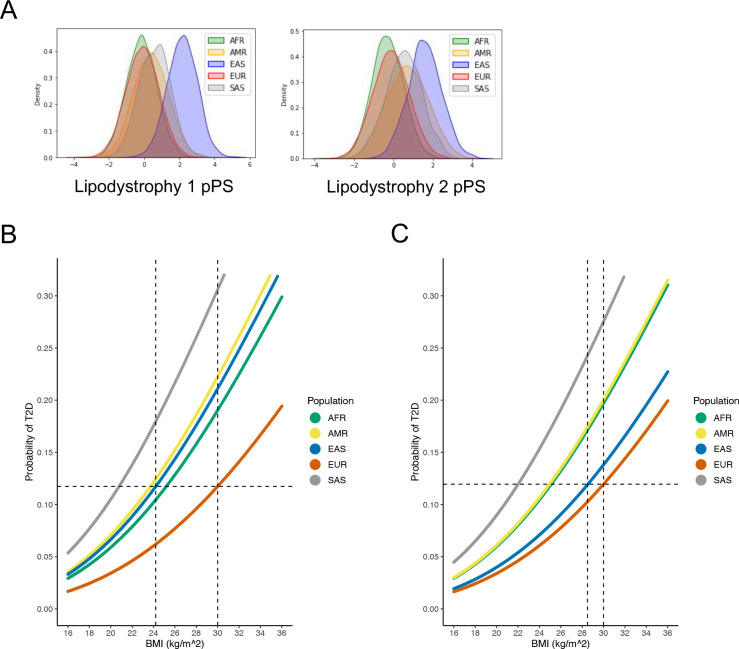
We identified genetic subtypes of type 2 diabetes (T2D) by analyzing genetic data from diverse groups, including non-European populations. We implemented soft clustering with 650 T2D-associated genetic variants, capturing known and novel T2D subtypes with distinct cardiometabolic trait associations. The twelve genetic clusters were distinctively enriched for single-cell regulatory regions. Polygenic scores derived from the clusters differed in distribution between ancestry groups, including a significantly higher proportion of lipodystrophy-related polygenic risk in East Asian ancestry. T2D risk was equivalent at a BMI of 30 kg/m2 in the European subpopulation and 24.2 (22.9-25.5) kg/m2 in the East Asian subpopulation; after adjusting for cluster-specific genetic risk, the equivalent BMI threshold increased to 28.5 (27.1-30.0) kg/m2 in the East Asian group, explaining about 75% of the difference in BMI thresholds. Thus, these multi-ancestry T2D genetic subtypes encompass a broader range of biological mechanisms and help explain ancestry-associated differences in T2D risk profiles.


Figures

Fig. 1.
Fig. 1.. Key loci and traits of multi-ancestry T2D genetic clusters
Each plot displays the top-weighted loci and traits within each multi-ancestry T2D genetic cluster. The length of the bars corresponds to the cluster weight determined by the bNMF algorithm. Green bars represent genetic loci, red bars represent traits with increased values, and blue bars represent traits with decreased values within each cluster. Female- and male-specific traits are appended with “_F” and “_M”, respectively. A maximum of 30 elements (loci and traits) with the highest weights are displayed in each cluster.
Fig. 2.
Fig. 2.. Multi-ancestry T2D genetic cluster associations with continuous traits and clinical phenotypes
(A) Each plot displays associations between selected multi-ancestry T2D genetic clusters and selected continuous outcomes, based on GWAS-partitioned pPS. The effect size indicates the beta coefficient from a meta-analysis of GWAS summary statistics. Error bars represent the 95% confidence interval. (B) Each plot displays cluster associations with selected continuous outcomes, based on individual-level pPS obtained from a meta-analysis of MGB Biobank and All of Us. Each outcome was normalized to a standard normal distribution. Effect sizes indicate the effect per one standard deviation increase in the pPS. Error bars represent the standard error from a linear regression model. (C) Each plot displays cluster-specific odds ratios of selected clinical phenotypes, based on individual-level pPS obtained from a meta-analysis of MGB Biobank and All of Us. Odds ratios are calculated per one standard deviation increase in the pPS. Error bars represent the 95% confidence interval. For all components, positive associations are colored in red, negative associations are colored in blue, and P values are indicated with asterisks (* P < 0.05, ** P < 0.01, *** P < 0.001).
Fig. 3.
Fig. 3.. Enrichment for cell type specific enhancers in multi-ancestry type 2 diabetes clusters.
Heatmaps display the significant cluster-specific enrichment of genomic annotations, represented by cumulative posterior probability, in (A) CATLAS single cell accessible chromatin data from 222 cell types and (B) Epigenomic Roadmap chromatin state calls from 28 cell types. Q values were corrected for false discovery rate (FDR). For both analyses, only cell types with at least one association of FDR < 0.1 are included in the figure, with additional data in Supplementary Table 17.
Fig. 4.
Fig. 4.. Ancestry-specific relationship between T2D genetic clusters, BMI, and T2D risk
(A) Ancestry-specific distribution of Lipodystrophy 1 and Lipodystrophy 2 pPS (normalized to a standard normal distribution). (B) Relationship between BMI and T2D risk (unadjusted), classified by genetic ancestry. The horizontal dashed line represents the T2D risk for participants with European genetic ancestry and a BMI of 30 kg/m2 (typically used to define obesity). The vertical dashed lines indicate the BMI thresholds needed to develop an equivalent risk of T2D in the European and East Asian ancestry groups. (C) Relationship between BMI and T2D risk, adjusted for Lipodystrophy 1 pPS and Lipodystrophy 2 pPS. All analyses were performed in a meta-analysis of MGB Biobank and All of Us.

References

    1. Nolan J. J. et al. ADA/EASD Precision Medicine in Diabetes Initiative: An International Perspective and Future Vision for Precision Medicine in Diabetes. Diabetes Care 45, 261–266 (2022). - PMC - PubMed
    1. Misra S. et al. Systematic review of precision subclassification of type 2 diabetes. medRxiv (2023) doi:10.1101/2023.04.19.23288577. - DOI - PMC - PubMed
    1. Udler M. S. et al. Type 2 diabetes genetic loci informed by multi-trait associations point to disease mechanisms and subtypes: A soft clustering analysis. PLoS Med. 15, e1002654 (2018). - PMC - PubMed
    1. Kim H. et al. High-throughput genetic clustering of type 2 diabetes loci reveals heterogeneous mechanistic pathways of metabolic disease. Diabetologia 66, 495–507 (2023). - PMC - PubMed
    1. Martin A. R. et al. Clinical use of current polygenic risk scores may exacerbate health disparities. Nat. Genet. 51, 584–591 (2019). - PMC - PubMed

Publication types

LinkOut - more resources