[Preprint]. 2023 Oct 10:rs.3.rs-3411693.
doi: 10.21203/rs.3.rs-3411693/v1.

Ancient origin of the rod bipolar cell pathway in the vertebrate retina

Affiliations

Ancient origin of the rod bipolar cell pathway in the vertebrate retina

Ayana M Hellevik et al. Res Sq. .

Update in

  • Ancient origin of the rod bipolar cell pathway in the vertebrate retina.
    Hellevik AM, Mardoum P, Hahn J, Kölsch Y, D'Orazi FD, Suzuki SC, Godinho L, Lawrence O, Rieke F, Shekhar K, Sanes JR, Baier H, Baden T, Wong RO, Yoshimatsu T. Hellevik AM, et al. Nat Ecol Evol. 2024 Jun;8(6):1165-1179. doi: 10.1038/s41559-024-02404-w. Epub 2024 Apr 16. Nat Ecol Evol. 2024. PMID: 38627529

Abstract

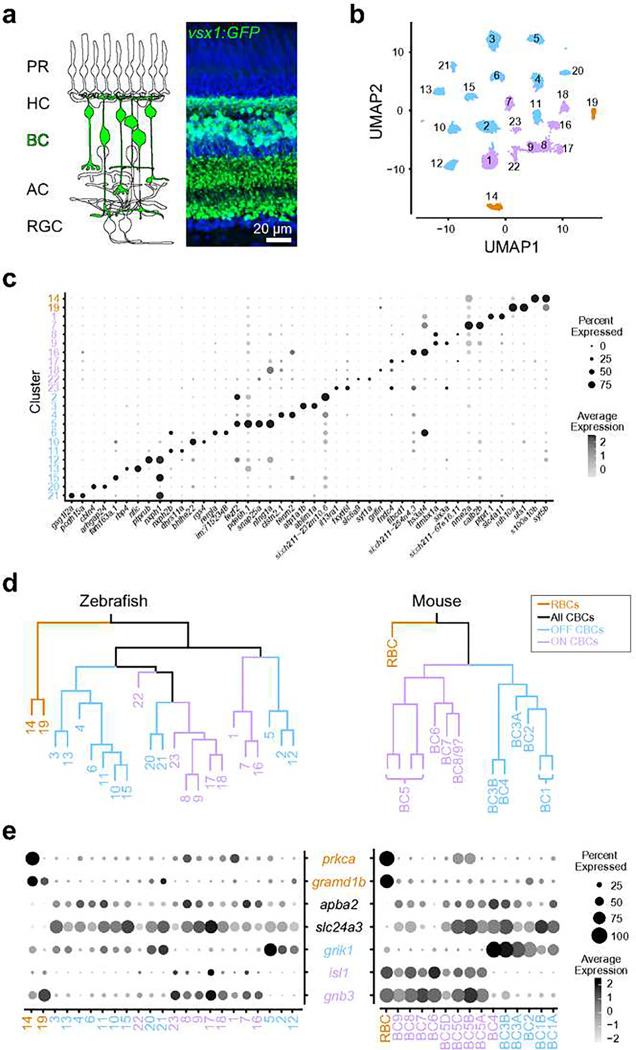
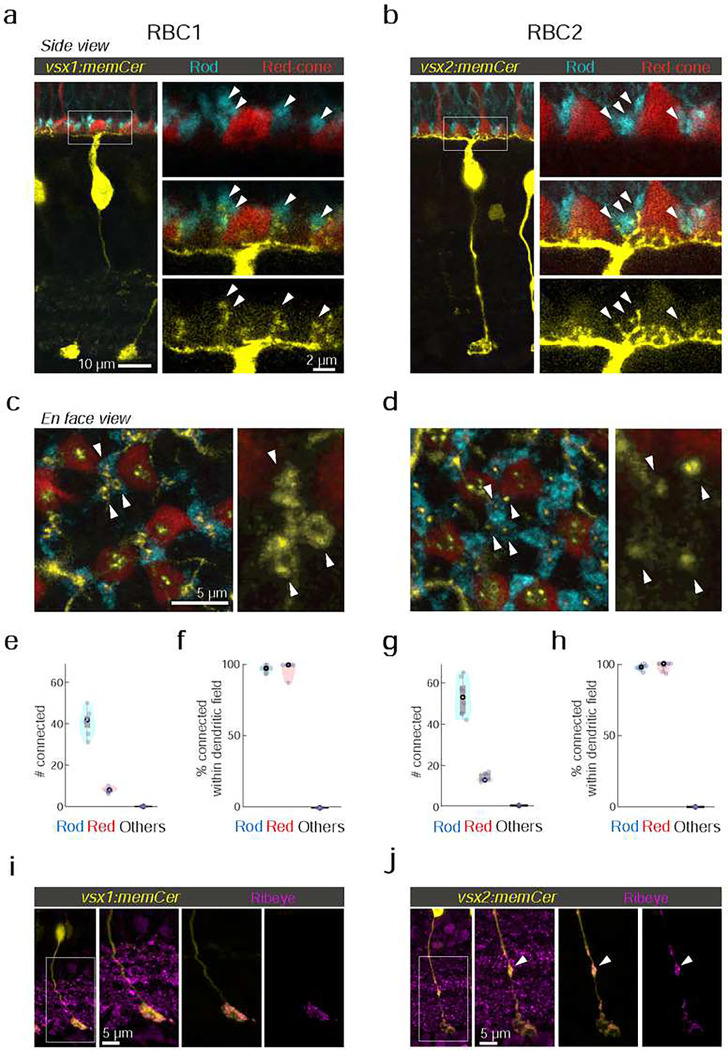
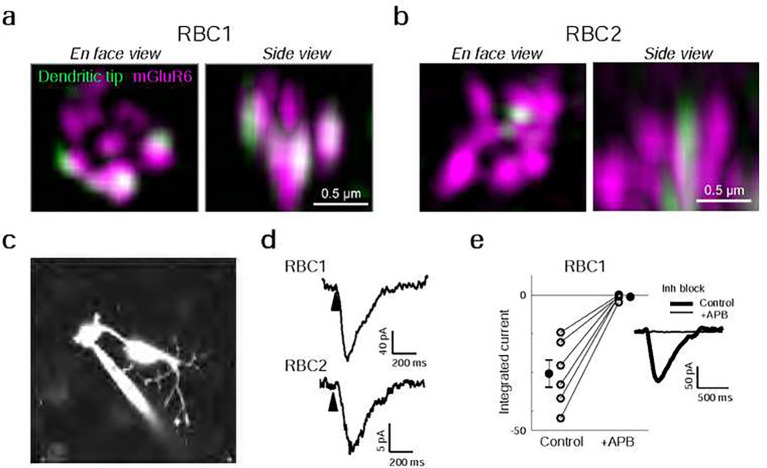
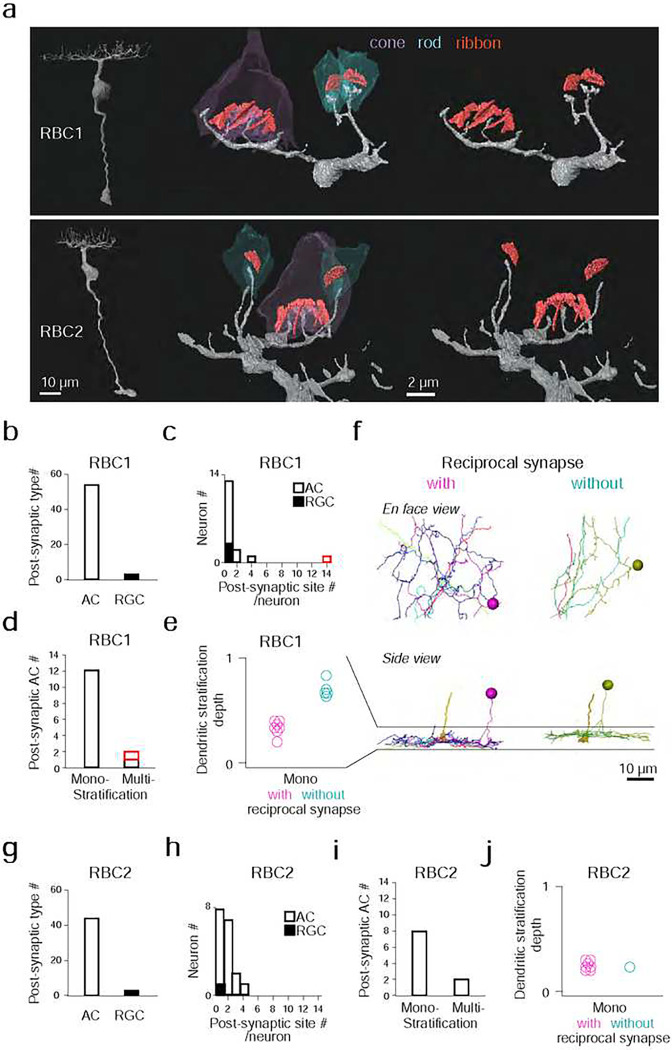
Vertebrates rely on rod photoreceptors for vision in low-light conditions. Mammals have a specialized downstream circuit for rod signaling called the primary rod pathway, which comprises specific cell types and wiring patterns that are thought to be unique to this lineage. Thus, it has been long assumed that the primary rod pathway evolved in mammals. Here, we challenge this view by demonstrating that the mammalian primary rod pathway is conserved in zebrafish, which diverged from extant mammals ~400 million years ago. Using single-cell RNA-sequencing, we identified two bipolar cell (BC) types in zebrafish that are related to mammalian rod BCs (RBCs) of the primary rod pathway. By combining electrophysiology, histology, and ultrastructural reconstruction of the zebrafish RBCs, we found that, like mammalian RBCs, both zebrafish RBC types connect with all rods in their dendritic territory, and provide output largely onto amacrine cells. The wiring pattern of the amacrine cells post-synaptic to one RBC type is strikingly similar to that of mammalian RBCs, suggesting that the cell types and circuit design of the primary rod pathway have emerged before the divergence of teleost fish and amniotes. The second RBC type, which forms separate pathways, is either lost in mammals or emerged in fish.

Keywords: Evolution; Retina; Rod; Rod bipolar cells.


Conflict of interest statement

DECLARATION OF INTERESTS The authors declare no competing interests.

Figures

Figure 1
Figure 1. Comparison of single-cell gene expressions identified two possible rod bipolar cells in zebrafish
a, Schematic representation of retinal circuits (left) and an image of a retinal slice from Tg(vsx1:GFP)nns5 transgenic adult zebrafish (right). GFP expression in all bipolar cells (BCs). Nuclei was stained by DAPI. PR: photoreceptor, HC: horizontal cell, AC: amacrine cell, RGC: retinal ganglion cell. b, 2D visualization of single-cell clusters using Uniform Manifold Approximation (UMAP). Individual points correspond to single cells colored according to cluster identity. c, Marker genes for each cluster. d, Agglomerative hierarchical clustering of average gene signatures of clusters using the correlation metric and complete linkage. BC subclasses (colors) were assigned based on the known marker expressions shown in e. e, Gene expression patterns of known BC subclass markers in BC clusters. The size of each circle depicts the percentage of cells in the cluster in which the marker was detected (≥1 UMI), and its contrast depicts the scaled average expression level of cells within the cluster in c,e. Data for mouse is from Shekhar K, et al., 2016, Cell
Figure 2
Figure 2. Transgenic labeling of cluster 14 and 19 revealed morphological features of these BCs
a,b, En face view of retinal at mount at the inner nucleus layer level. Cerulean fluorescent expression (colored yellow) transgenic lines, Tg(vsx1:memCerulean)q19 (vsx1:memCer) in a and Tg(vsx2:memCerulean)wst01 (vsx2:memCer) in b. vsx1:memCer and vsx2:memCer BCs are positive for cluster specific genes, s100a10b and uts1, respectively, which are detected using in situ hybridization chain reaction . c,d, Side views of the labeled cells and the distribution patterns of their axon terminals in en face views of retinal at mounts for RBC1 (c) and RBC2 (d) BCs. Immunolabeling for PKCα is in magenta. IPL: inner plexiform layer. Note that not all PKC immunoreactive cells are apparent in this image of the vsx1:memCer line, due to the incomplete labeling of this line. e,f, Dendritic tiling of RBC1 (e) and RBC2 (f) in en face view of retinal at mounts at the outer plexiform layer level. Dendritic territories are marked by the red boundaries. g-j, Mean cell densities of RBC1 (g, n=3 and 4 for D and VT, respectively) and RBC2 (I, n=3 for both D and VT) BCs in different regions of the retina. Box and violin plots of dendritic field sizes of RBC1 (h, n=37 and 33 or D and VT, respectively) and RBC2 (j, n=40 and 41 or D and VT, respectively) BCs. White filled circles are medians. Grey circles indicate individual cells. D: dorsal, VT: ventrotemporal.
Figure 3
Figure 3. RBC1 and RBC2 connect to rods and red cones but differ in dendritic and axonal synaptic arrangements
a,b, Dendritic tips invaginating the rod and red cone axon terminals, visualized in retinal slices from (a) Tg(vsx1:memCerulean:trb2:tdtomato)q19,q22 and (b) Tg(vsx2:memCerulean:trb2:tdtomato)wst01,q22 adult zebrafish. Rods were immunolabeled using 4C12 antibody. c,d, Doughnut and simple dendritic tip structures at rod terminals (arrow heads) in RBC1 and RBC2, respectively. e-h, Box and violin plots of RBC1 (e,f, n=7) and RBC2 (g,h, n=8) connectivity with photoreceptors. i,j, Distribution of ribbon synapses in the RBC1 (i) and 2 (j) axons. Ribbons were immunolabeled by anti-ribeye antibody. Ribeye signals outside the axons were digitally masked out in the right two images. RBC2 axon harbors a ribbon containing distal bouton in the OFF layer (arrow head).
Figure 4
Figure 4. Rod input to RBC1 is mediated by mGluR6 receptors.
a,b, Colocalization of mGluR6 and RBC1 (a) and RBC2 (b) dendritic tips at rod terminals visualized by structured illumination microcopy. c, Whole-cell patch clamping of a RBC1 axon terminal, visualized by dye-filling Alexa Fluor 594). d, Voltage responses of RBC1 and RBC2 after a cone activating light ash (arrow heads). e, Population data of RBC1 responses to rod activating light ashes with and without the group III metabotropic glutamate receptor agonist, APB (6-(2- aminopropyl)benzofuran). Filled circles: mean; error bars, S.D.; open circles, individual cells. Traces on the right are an example of the cell’s light evoked response before and during APB bath application. Inhibitory neurotransmitter receptors were blocked (inh lock) by a bath application of gabazine, strychnine, and TPMPA ((1,2,5,6-Tetrahydropyridin-4- yl)methylphosphinic acid).
Figure 5
Figure 5. Identification of RBC1 and RBC2, and their post-synaptic neuron types in a SBFSEM volume.
a, Reconstructions of a RBC1 and a RBC2, and zoomed-in images of their dendritic tips at rod and cone terminals. Ribbons in the rod and cones are painted red. b-e, Quantification of morphological parameters of neurons postsynaptic to one of the RBC1s in the EM volume (marked by an open arrow head in Fig. S3d). One postsynaptic neuron contained an exceptionally higher number of synapses (14) with the RBC1 (marked in red in c and d). Dendritic stratification is normalized to 0 and 1 at the lower and upper ends of the RBC1 axon terminals, respectively in e. f, Mono-stratifying ACs with (red) or without (blue) reciprocal synapses with RBC1s in the volume. The axon of the presynaptic RBC1 is also shown in the side view. Individual cells were color coded. g-j, Quantification of morphological parameters for neurons postsynaptic to one of the RBC2s in the EM volume (marked by a closed arrow head in Fig. S3d). AC: amacrine cells, RGC: retinal ganglion cells
Figure 6
Figure 6. Circuit diagram of RBC1 is similar to mammalian RBC pathway
a, An example monostratified amacrine cell (RS AC) classified in Fig. 5e that formed of reciprocal synapse with RBC1. b, A mouse A17 amacrine cells (taken from ) (b). c,d, A2-like ACs that are postsynaptic to two neighboring RBC1s. e,d, Locations and distributions of synaptic sites and non-synaptic contacts with BCs in zebrafish bi-stratifying AC (e) and in rabbit A2 ACs (taken from ) (f). Note that synapses or non-synaptic contacts with AC and RGC are not included in (e), and inputs from CBC are not included in (f). g,h, Schematic diagrams of zebrafish (g) and mammalian (h) RBC pathways. Mouse A17 and rabbit A2 images are from and , respectively, used with permissions. Data for the distributions of synaptic sites within mammalian A2 ACs across the inner plexiform layer (IPL) are taken from.

References

    1. Baylor D. A., Lamb T. D. & Yau K. W. Responses of retinal rods to single photons. J. Physiol. 288, 613–634 (1979). - PMC - PubMed
    1. Baylor D. A., Nunn B. J. & Schnapf J. L. The photocurrent, noise and spectral sensitivity of rods of the monkey Macaca fascicularis. J. Physiol. 357, 575–607 (1984). - PMC - PubMed
    1. Field G. D. & Rieke F. Nonlinear Signal Transfer from Mouse Rods to Bipolar Cells and Implications for Visual Sensitivity. Neuron 34, 773–785 (2002). - PubMed
    1. Field G. D. & Rieke F. Mechanisms regulating variability of the single photon responses of mammalian rod photoreceptors. Neuron 35, 733–747 (2002). - PubMed
    1. Ingram N. T., Sampath A. P. & Fain G. L. Why are rods more sensitive than cones? J. Physiol. 594, 5415–5426 (2016). - PMC - PubMed

Publication types

LinkOut - more resources