[Preprint]. 2023 Oct 12:rs.3.rs-3385435.
doi: 10.21203/rs.3.rs-3385435/v1.

DDA1, a novel factor in transcription-coupled repair, modulates CRL4CSA dynamics at DNA damage-stalled RNA polymerase II

Affiliations

DDA1, a novel factor in transcription-coupled repair, modulates CRL4CSA dynamics at DNA damage-stalled RNA polymerase II

Diana Llerena Schiffmacher et al. Res Sq. .

Update in

  • The small CRL4CSA ubiquitin ligase component DDA1 regulates transcription-coupled repair dynamics.
    Llerena Schiffmacher DA, Lee SH, Kliza KW, Theil AF, Akita M, Helfricht A, Bezstarosti K, Gonzalo-Hansen C, van Attikum H, Verlaan-de Vries M, Vertegaal ACO, Hoeijmakers JHJ, Marteijn JA, Lans H, Demmers JAA, Vermeulen M, Sixma TK, Ogi T, Vermeulen W, Pines A. Llerena Schiffmacher DA, et al. Nat Commun. 2024 Jul 29;15(1):6374. doi: 10.1038/s41467-024-50584-7. Nat Commun. 2024. PMID: 39075067 Free PMC article.

Abstract

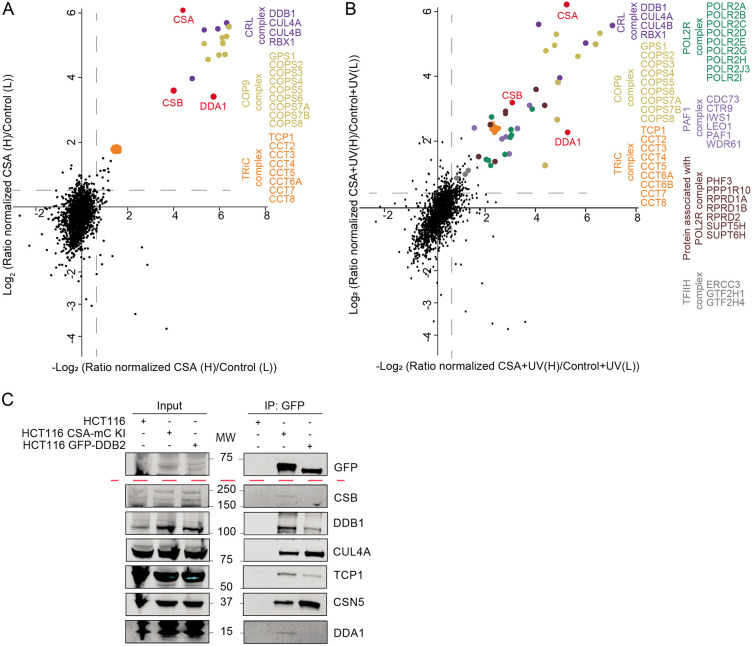
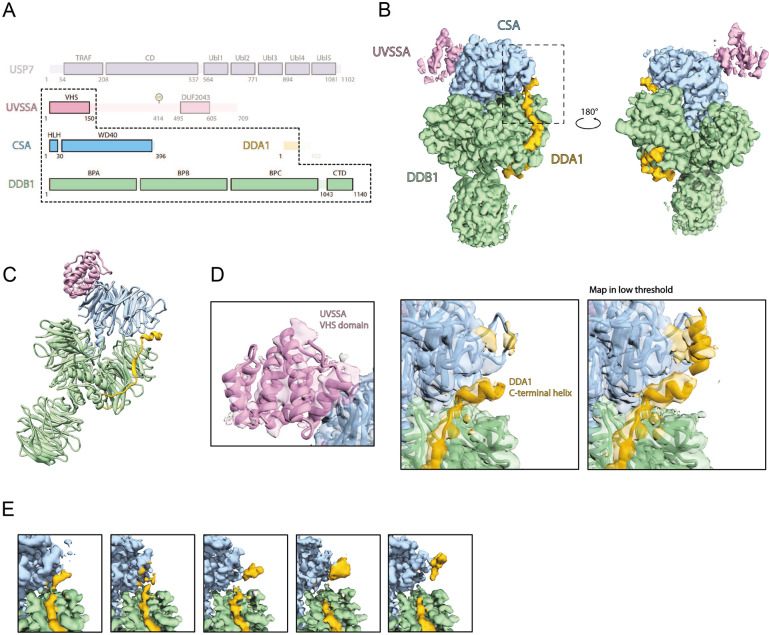
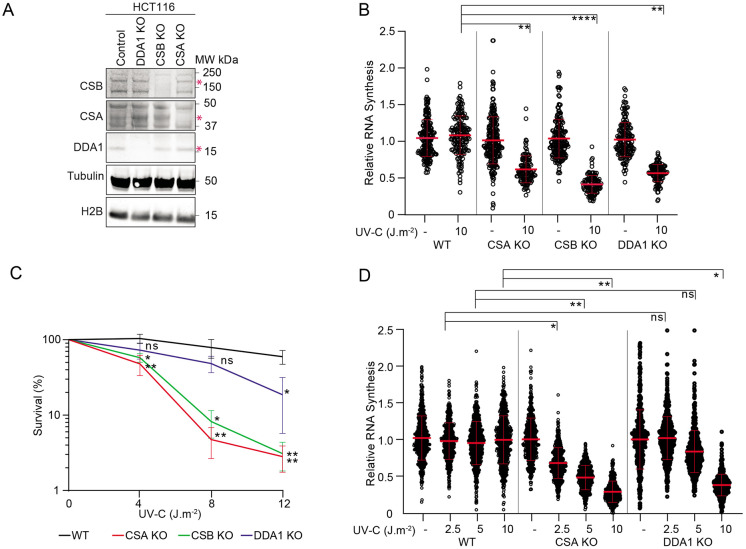
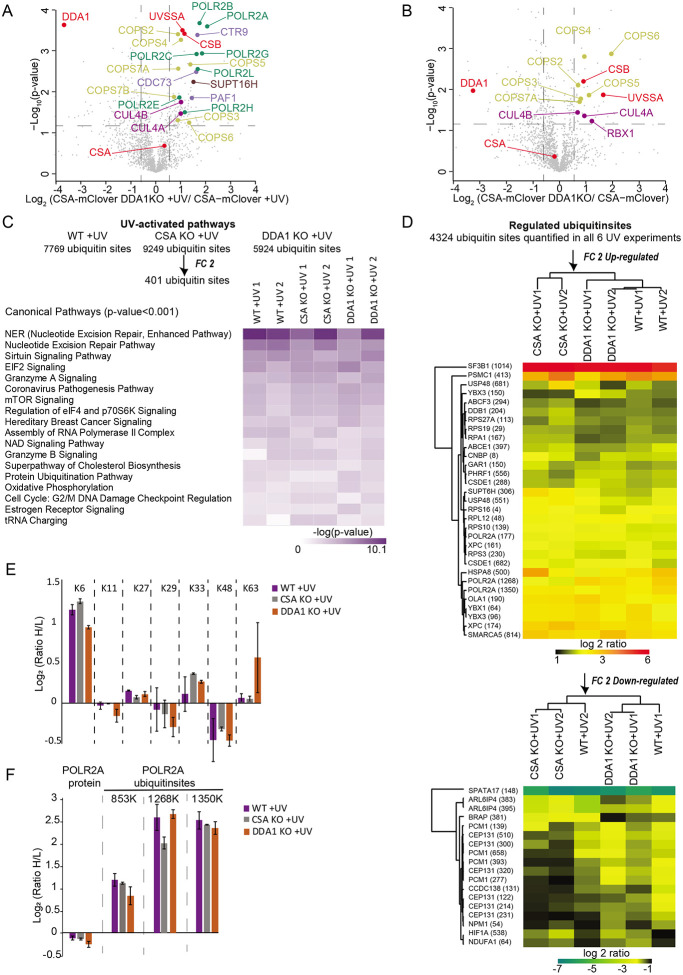
Transcription-blocking DNA lesions are specifically targeted by transcription-coupled nucleotide excision repair (TC-NER), which removes a broad spectrum of DNA lesions to preserve transcriptional output and thereby cellular homeostasis to counteract aging. TC-NER is initiated by the stalling of RNA polymerase II at DNA lesions, which triggers the assembly of the TC-NER-specific proteins CSA, CSB and UVSSA. CSA, a WD40-repeat containing protein, is the substrate receptor subunit of a cullin-RING ubiquitin ligase complex composed of DDB1, CUL4A/B and RBX1 (CRL4CSA). Although ubiquitination of several TC-NER proteins by CRL4CSA has been reported, it is still unknown how this complex is regulated. To unravel the dynamic molecular interactions and the regulation of this complex, we applied a single-step protein-complex isolation coupled to mass spectrometry analysis and identified DDA1 as a CSA interacting protein. Cryo-EM analysis showed that DDA1 is an integral component of the CRL4CSA complex. Functional analysis revealed that DDA1 coordinates ubiquitination dynamics during TC-NER and is required for efficient turnover and progression of this process.


Figures

Figure 1.
Figure 1.. DDA1 is an interaction partner of CSA.
A-B, Scatter plot of Log2 SILAC ratios of proteins isolated by GFP-pulldown in CSA-mClover HCT116 cells. The experiments were conducted in duplicate with a label swap, comparing the GFP immunoprecipitation of mock-treated CSA-mClover versus HCT116 cells (A) or UV-treated CSA-mClover versus HCT116 cells (B). Proteins with Log2 SILAC ratio >0.6 (indicated by gray line) in both replicates were classified as specific CSA interactors. RNAPII subunits are indicated in green, PAF1 subunits are indicated in light purple, proteins associated with RNAPII are indicated in brown, TFIIH subunits are indicated in grey, TRiC subunits are indicates in orange, the COP9 subunits in yellow, CRL subunits in dark purple and TC-NER factors are indicated in red. C, IP of CSA-mClover and GFP-DDB2 using GFP beads in CSA-mClover and GFP-DDB2 KI cells followed by immunoblotting for the indicated proteins. HCT116 cells were used as a control.
Figure 2.
Figure 2.. DDA1 is a component of CRL4CSA complex.
A, Domain architecture of the protein complex used for cryo-EM analysis. The stable core is highlighted by dash lines. Due to structural heterogeneity, USP7 and large part of UVSSA are invisible in the final reconstructed cryo-EM map. B, Cryo-EM structure of UVSSA-CSA-DDB1-DDA1. CSA (in light blue) and DDB1 (in light green) form a canonical substrate recognition module of CRL4 E3 ligases. The VHS domain of UVSSA (in pink) binds to a corner of CSA. DDA1 (in orange) interacts with both DDB1 and CSA. C, Molecular model of UVSSA-CSA-DDB1-DDA1 in ribbon diagram. D, Close up views of CSA interacting proteins. UVSSA interacts with CSA via the VHS domain (in pink). The C-terminal helix of DDA1 (in orange) interacts with CSA. The extension of the helix can be observed in the cryo-EM map at low threshold. E, Unstable interaction between DDA1 and CSA. The C-terminal helix of DDA1 is poorly resolved and various forms of densities can be identified by focused classification on this region, indicating that the interaction is unstable.
Figure 3.
Figure 3.. DDA1 is required for transcription recovery following DNA damage
A, Immunoblot of cell extracts from the HCT116 WT and KO cells stained for the indicated proteins. Tubulin and H2B were used as loading control. B, Transcription restart after UV, determined by relative EU incorporation in HCT116 WT and KO cells, at 24 hours after UV exposure (10 J.m−2). EU incorporation derived fluorescence was normalized to non-irradiated cells (set to 1). The mean ± S.D. is indicated in red from three independent experiments of (left to right) n=454, 368, 486, 241, 393, 334, 412 and 283 cells. C, UV colony survival of HCT116 WT and KO cells exposed to the indicated doses of UV. Data shown represent the mean ± SD from three independent experiments. NS represent non-significant, *P ≤ 0.05, **P ≤ 0.01 relative to WT analysed by unpaired, two-tailed t-test, adjusted for multiple comparison. D, Transcription restart after UV, determined by relative EU incorporation in HCT116 WT and KO cells, at 24 hours after UV exposure (2.5, 5 and 10 J.m−2) or mock treated. EU incorporation derived fluorescence was normalized to non-irradiated cells (set to 1). , The mean ± S.D. is indicated in red from three independent experiments of (left to right) n=1174, 1272, 1219, 1168, 1275, 1235, 1148, 980, 1014, 1278, 1166 and 1039 cells. Data shown in B, D NS represents non-significant, *P ≤ 0.05, **P ≤ 0.01, ****P ≤ 0.0001, each analysed by a nested t-test.
Figure 4.
Figure 4.. DDA1 provides properly CSA localization
A, Representative immunofluorescence images of endogenous CSA and DDB2 in HCT116 WT and KO cells, scale bar: 10 μm. B, Nuclear and cytoplasmic CSA and DDB2 levels in HCT116 WT and KO cells, analysed and quantified by fluorescence microscopy and ImageJ. The mean ± S.D. is indicated in red from three independent experiments of ≥ 30 images. CSA and DDB2 signal intensity at nucleus (as identified by DAPI staining) was compared to that in the rest of the cell (phalloidin). C, Transcription restart after UV damage as determined by relative EU incorporation in HCT116 WT and KO cells, with either CSA-GFP-3NL or GFP-3NL expression, 24 h after UV exposure (10 J.m−2) or mock treated. EU incorporation levels were normalized to the non-irradiated cells (set to 1). The mean ± S.D. is indicated in red from three independent experiments of (left to right) n=1275, 1118, 1164, 1195, 1068, 603, 1061 and 677cells. Data shown in B and C represent NS, **P ≤ 0.01 analysed by a nested t-test.
Figure 5.
Figure 5.. DDA1 modulates the protein network of CRL4CSA complex
A-B, Volcano plots depicting the statistical differences between three replicates of the MS analysis after GFP immunoprecipitation of UV treated (A) or mock-treated (B) cells, comparing the protein network of CSA in WT with DDA1KO cells. The fold change (Log2) is plotted on the x-axis and the significance (t-test −Log10 (P value)) is plotted on the y-axis. RNAPII subunits are indicated in green, PAF1 subunits are indicated in light purple, proteins associated with RNAPII are indicated in brown, the COP9 subunits in yellow, CRL subunits in dark purple and TC-NER factors are indicated in red. C, Heatmap showing the statistically significantly enriched canonical pathways (p-value 0.001, Ingenuity Pathway Analysis, IPA) of the UV responsive ubiquitin sites that passed a 2-fold change cut-off (including duplicates). The color coding depicts −Log10(P value) of the statistically significant terms. D, Heatmap showing the Log2 SILAC ratios of ubiquitin sites that are quantified in all UV conditions (including duplicates) over untreated controls and that passed a 2-fold change cut-off (up and down regulated). The color density reflects the scale of enrichment. E, Log2 SILAC ratios of ubiquitin K6, K11, K27, K29, K33, K48 and K63 chains as determined by quantitative global ubiquitin-proteomics in WT, CSAKO and DDA1KO cells after UV treatment (20 J.m−2, 30 min). The mean ± S.D. of duplicate experiments are plotted. F, Log2 SILAC ratios of POLR2A protein and ubiquitin sites of POLR2A (853K, 1268K and 1350K) as determined by quantitative proteomics and global ubiquitin-proteomics in WT, CSAKO and DDA1KO cells after UV treatment (20 J.m−2, 30 min). The mean ± S.D. of duplicate experiments are plotted.
Figure 6.
Figure 6.. DDA1 affects the dynamic of CRL4CSA via COP9 complex
A, Heatmap showing the statistically significantly enriched canonical pathways (p-value 0.001, Ingenuity Pathway Analysis, IPA) of the ubiquitin sites which were differentially modulated in mock treated conditions, that passed a 2-fold change cut-off. The color coding depicts −Log10 (P value) of the statistically significant terms. B, SILAC ratios of POLR2A protein and ubiquitin sites of POLR2A (853K, 1268K and 1350K) as determined by quantitative proteomics and global ubiquitin-proteomics in WT/CSAKO and WT/DDA1KO cells in mock treated conditions. The mean ± S.D. of duplicate experiments are plotted. C, Binding kinetics of CSA-mClover in HCT116 WT or DDA1KO cells to locally UV damaged sites induced by 266 nm micro-beam laser irradiation. GFP fluorescence intensities at the site of UV damage were measured by real-time imaging until they reached a maximum. Mean and S.E.M. are from 30 cells per condition from three independent experiments. D, FRAP analysis of CSA-mClover in mock or UV irradiated (10 J.m−2) HCT116 WT and DDA1KO cells, measured at the indicated time points. Percentage of CSA-mClover immobile fraction was determined from FRAP analyses (supplementary figure 13A). Graphs depict the mean & S.E.M. of ≥ 30 cells from at least three independent experiments. E, IP of CSA using GFP beads in CSA-mClover KI HCT116 WT and DDA1 KO cells followed by immunoblotting for the indicated proteins. Cells were collected 1 and 10 h after mock-treatment or irradiation with (10 J.m−2) UV. F, FRAP analysis of CSA-mClover in presence or absence of NAEi added 1 h before irradiation and followed by UV irradiation (10 J.m−2). Percentage of CSA-mClover immobile fraction determined from FRAP analyses (supplementary figure 13B) was measured at the indicated time points. Graphs depict the mean & S.E.M. of ≥ 30 cells from at least three independent experiments. Data shown in D and F represent NS, *P ≤ 0.05, ****P ≤ 0.0001 analysed by unpaired, two-tailed t-test adjusted for multiple comparisons.

References

    1. Schumacher B., Pothof J., Vijg J. & Hoeijmakers J. H. J. The central role of DNA damage in the ageing process. Nature 592, 695–703, doi:10.1038/s41586-021-03307-7 (2021). - DOI - PMC - PubMed
    1. Hoeijmakers J. H. DNA damage, aging, and cancer. N Engl J Med 361, 1475–1485, doi:10.1056/NEJMra0804615 (2009). - DOI - PubMed
    1. van den Heuvel D., van der Weegen Y., Boer D. E. C., Ogi T. & Luijsterburg M. S. Transcription-Coupled DNA Repair: From Mechanism to Human Disorder. Trends Cell Biol 31, 359–371, doi:10.1016/j.tcb.2021.02.007 (2021). - DOI - PubMed
    1. Nieto Moreno N., Olthof A. M. & Svejstrup J. Q. Transcription-Coupled Nucleotide Excision Repair and the Transcriptional Response to UV-Induced DNA Damage. Annu Rev Biochem 92, 81–113, doi:10.1146/annurev-biochem-052621-091205 (2023). - DOI - PubMed
    1. Marteijn J. A., Lans H., Vermeulen W. & Hoeijmakers J. H. Understanding nucleotide excision repair and its roles in cancer and ageing. Nat Rev Mol Cell Biol 15, 465–481, doi:10.1038/nrm3822 (2014). - DOI - PubMed

Publication types

LinkOut - more resources