[Preprint]. 2023 Oct 19:rs.3.rs-3462973.
doi: 10.21203/rs.3.rs-3462973/v1.

An ANXA11 P93S variant dysregulates TDP-43 and causes corticobasal syndrome

Affiliations

An ANXA11 P93S variant dysregulates TDP-43 and causes corticobasal syndrome

Allison Snyder et al. Res Sq. .

Update in

  • An ANXA11 P93S variant dysregulates TDP-43 and causes corticobasal syndrome.
    Snyder A, Ryan VH, Hawrot J, Lawton S, Ramos DM, Qi YA, Johnson KR, Reed X, Johnson NL, Kollasch AW, Duffy MF, VandeVrede L, Cochran JN, Miller BL, Toro C, Bielekova B, Marks DS, Yokoyama JS, Kwan JY, Cookson MR, Ward ME. Snyder A, et al. Alzheimers Dement. 2024 Aug;20(8):5220-5235. doi: 10.1002/alz.13915. Epub 2024 Jun 26. Alzheimers Dement. 2024. PMID: 38923692 Free PMC article.

Abstract

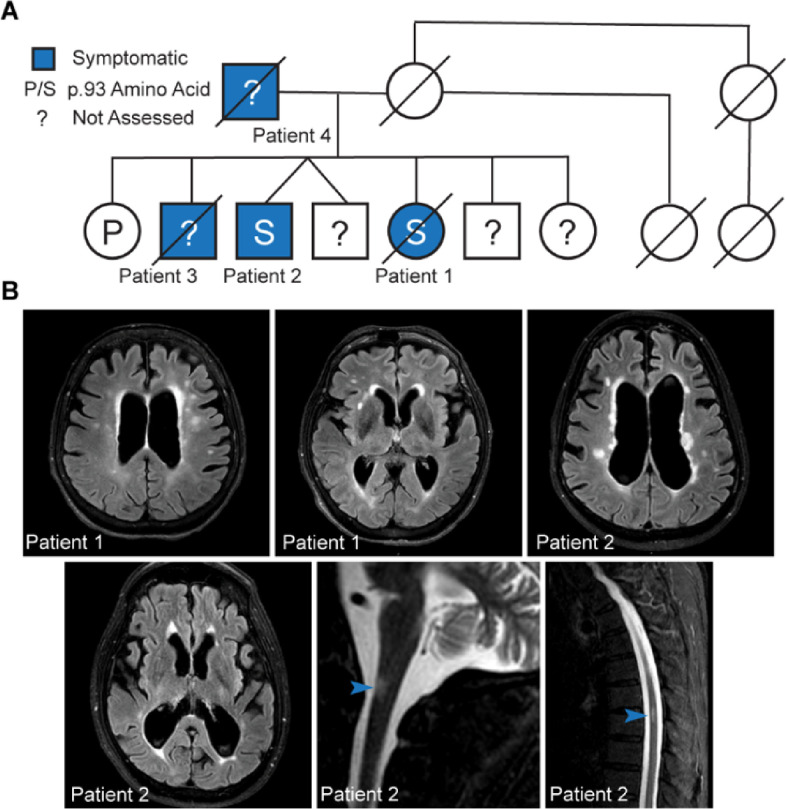
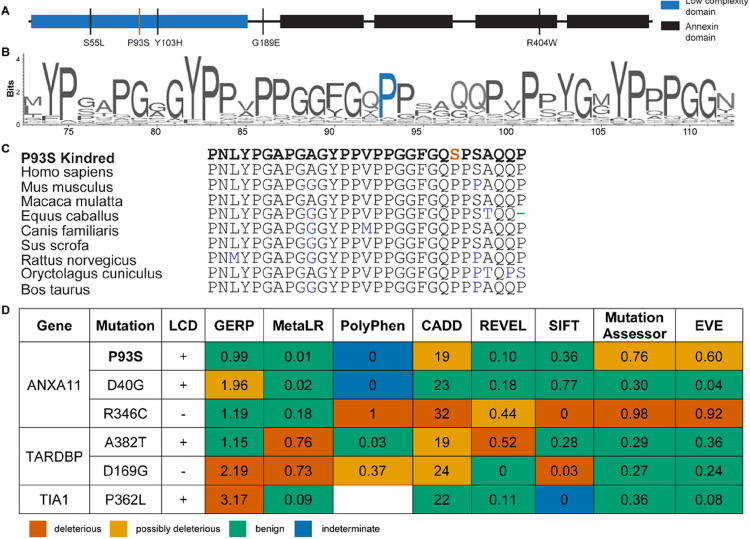
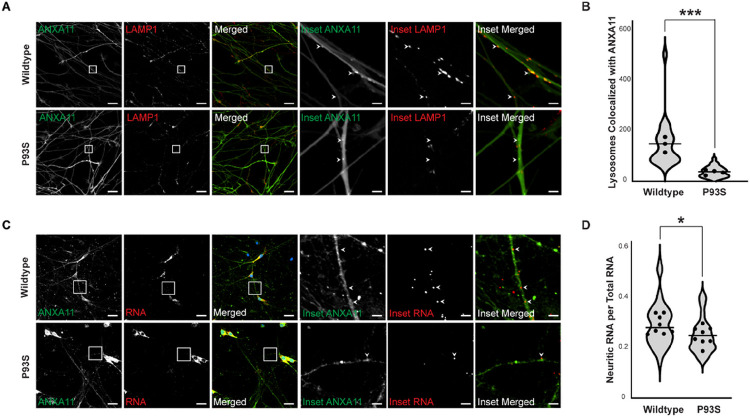
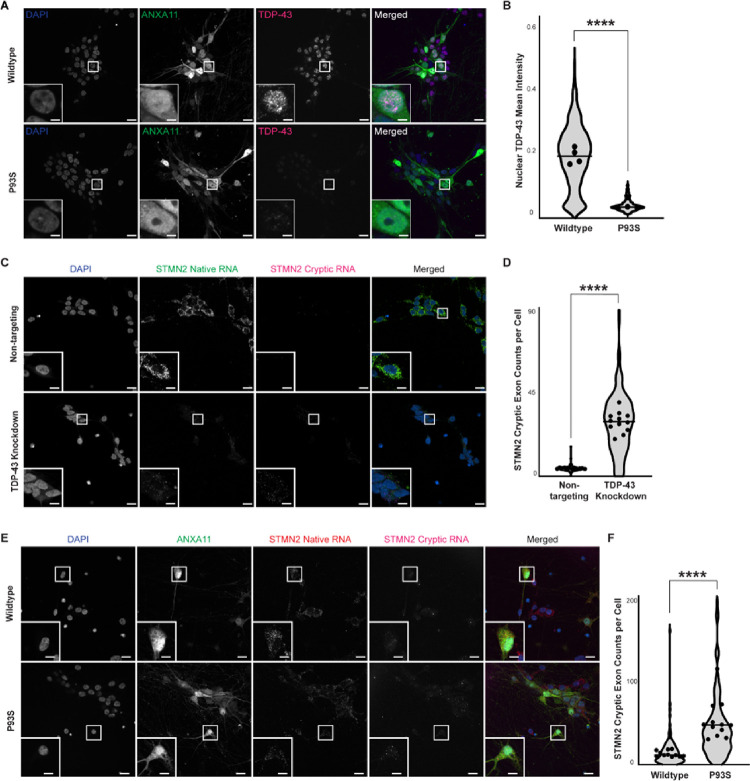
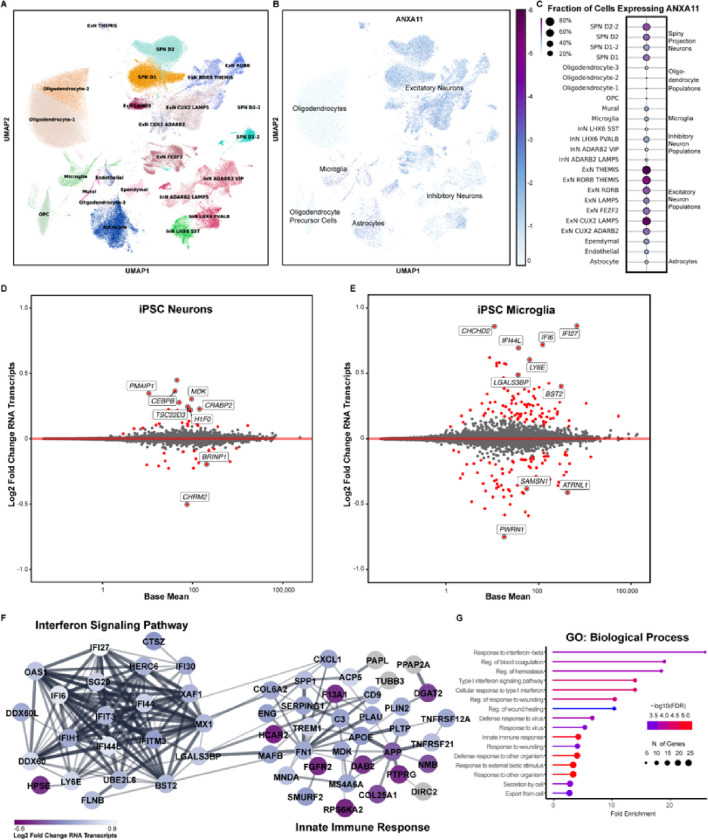
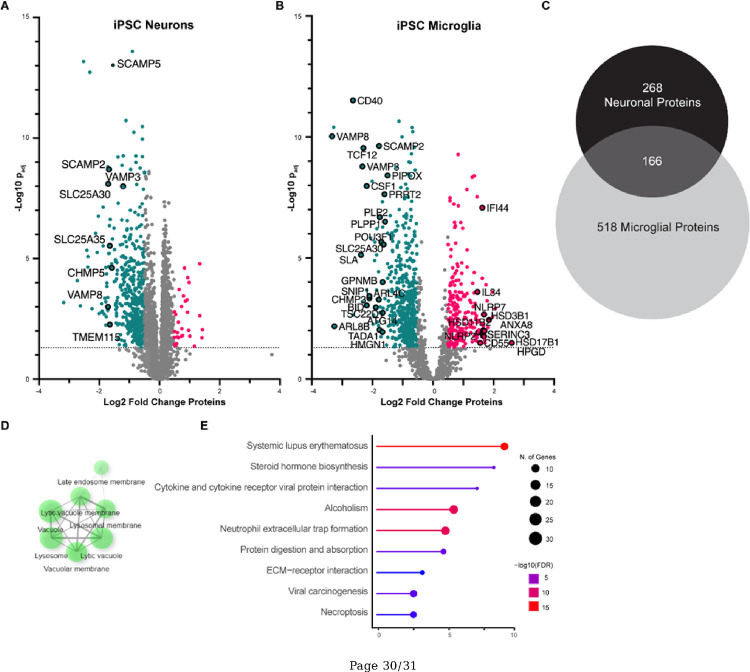
As genetic testing has become more accessible and affordable, variants of uncertain significance (VUS) are increasingly identified, and determining whether these variants play causal roles in disease is a major challenge. The known disease-associated Annexin A11 (ANXA11) mutations result in ANXA11 aggregation, alterations in lysosomal-RNA granule co-trafficking, and TDP-43 mis-localization and present as amyotrophic lateral sclerosis or frontotemporal dementia. We identified a novel VUS in ANXA11 (P93S) in a kindred with corticobasal syndrome and unique radiographic features that segregated with disease. We then queried neurodegenerative disorder clinic databases to identify the phenotypic spread of ANXA11 mutations. Multi-modal computational analysis of this variant was performed and the effect of this VUS on ANXA11 function and TDP-43 biology was characterized in iPSC-derived neurons. Single-cell sequencing and proteomic analysis of iPSC-derived neurons and microglia were used to determine the multiomic signature of this VUS. Mutations in ANXA11 were found in association with clinically diagnosed corticobasal syndrome, thereby establishing corticobasal syndrome as part of ANXA11 clinical spectrum. In iPSC-derived neurons expressing mutant ANXA11, we found decreased colocalization of lysosomes and decreased neuritic RNA as well as decreased nuclear TDP-43 and increased formation of cryptic exons compared to controls. Multiomic assessment of the P93S variant in iPSC-derived neurons and microglia indicates that the pathogenic omic signature in neurons is modest compared to microglia. Additionally, omic studies reveal that immune dysregulation and interferon signaling pathways in microglia are central to disease. Collectively, these findings identify a new pathogenic variant in ANXA11, expand the range of clinical syndromes caused by ANXA11 mutations, and implicate both neuronal and microglia dysfunction in ANXA11 pathophysiology. This work illustrates the potential for iPSC-derived cellular models to revolutionize the variant annotation process and provides a generalizable approach to determining causality of novel variants across genes.

Keywords: ANXA11; TDP-43; corticobasal syndrome; variant of uncertain significance.


Conflict of interest statement

Competing interests JSY serves on the scientific advisory board for the Epstein Family Alzheimer’s Research Collaboration. DSM is an advisor for Dyno Therapeutics, Octant, Jura Bio, Tectonic Therapeutic, and Genentech, and is a co-founder of Seismic Therapeutic. The authors AS, VHR, JH, SL, DMR, YAQ, KJ, XR, NLJ, AWK, MD, LVV, JNC, CT, BB, JYK, MRC, and MEW report no competing interests.

Figures

Figure 1
Figure 1. P93S kindred.
(A) Pedigree of P93S family. Genetic testing is available from three individuals; the position 93 amino acid is indicated by letter and unavailable testing is indicated by a question mark. Symptomatic individuals, indicated in blue include patients one, two, three, and four. (B) Representative MRI findings. T2-weighted FLAIR MRI images from patients one and two demonstrating central-predominant atrophy in a frontoparietal distribution and prominent white matter hyperintensities in the cerebral cortex and white matter hyperintensities on spinal cord images from patient two, indicated by arrowheads.
Figure 2
Figure 2. ANXA11 Structure.
(A) Schematic of ANXA11. Low complexity domain is shown in blue and annexin domains are shown in black. The P93S variant is identified by a red line; remaining variants/mutations are indicated by black lines. (B) and (C) ANXA11 sequence conservation. VarSite illustration of sequence conservation with the proline in position 93 indicated in blue (B) and sequence conservation of annexin A11 across vertebrate species (C) with the P93S variant indicated in red. (D) Poor performance of in silico variant prediction models for mutations in LCDs. P93S VUS with other known pathogenic mutations in common amyotrophic lateral sclerosis/frontotemporal dementia associated genes with LCDs are shown. The predictions of pathogenicity by color: predicted benign in green, moderate in orange, pathogenic in red, and indeterminate in blue. GERP score considered deleterious >2. MetaLR score ranges from 0 benign to 1 deleterious. PolyPhen score considered deleterious >0.446. CADD score considered deleterious >30. REVEL score ranges from 0 benign to 1 deleterious. SIFT score considered deleterious <0.05. Mutation Assessor score ranges from 0 benign to 1 deleterious. EVE score considered potentially deleterious >0.5 and deleterious >0.7.
Figure 3
Figure 3. Functional impact of P93S variant.
(A) and (B) Decreased colocalization of lysosomes in mutant ANXA11 neurons. (A) Representative images of iPSC-derived neurons expressing wildtype and mutant ANXA11 (green) and LAMP1 lysosomal marker (red) showing colocalization of lysosomes with ANXA11 puncta indicated by arrowheads, scale bar = 25 μm, inset scale bar = 4 μm. (B) Quantification of number lysosomes with ANXA11, well mean indicated by dot, horizontal line indicates median, p = 0.0009. (C) and (D) Decreased neuritic RNA in mutant ANXA11 neurons. (C) Representative images of fixed iPSC-derived neurons expressing wildtype and mutant ANXA11 with in situ hybridization probes for β-actin RNA using RNAscope to identify neuritic RNA indicated by arrowheads, scale bar = 25 μm, inset scale bar = 4 μm. (D) Quantification of proportion of neuritic RNA over total RNA, well mean indicated by dot, horizontal line indicates median, p = 0.03.
Figure 4
Figure 4. Decreased nuclear TDP-43 and formation of cryptic exons. (A) and (B) Decreased nuclear TDP-43 in mutant ANXA11 neurons.
(A) Representative images of fixed iPSC-derived neurons expressing wildtype and mutant ANXA11 (green) stained with TDP-43 (magenta) and Hoechst nuclear counterstaining (blue) demonstrating nuclear clearing of TDP-43 in mutant ANXA11 cells, scale bar = 25 μm, inset scale bar = 1.75 μm. (B) Quantification of mean TDP-43 intensity in wildtype compared to mutant ANXA11, well mean indicated by dot, horizontal line indicates median, p <0.0001. (C) and (D) Detection of STMN2 cryptic exon formation in TDP-43 KD neurons. (C) Representative images of fixed iPSC-derived CRISPRi neurons with control non-targeting and TDP-43 knockdown guides demonstrating detection of native STMN2 RNA (green) and cryptic RNA (magenta) using HCR FISH probes with Hoechst nuclear counterstaining (blue), scale bar = 25μm, inset scale bar = 4 μm. (D) Quantification of cryptic exon counts per cell in non-targeting and TDP-43 knockdown cells for STMN2, well mean indicated by dot, horizontal line indicates median, Mann Whitney p<0.0001. (E) and (F) Increased STMN2 cryptic exon formation in mutant ANXA11 neurons. (E) Representative images of fixed iPSC-derived neurons expressing wildtype and mutant ANXA11 (green) with HCR FISH probes for native STMN2 RNA (red) and cryptic RNA (magenta) with Hoechst nuclear counterstaining (blue), scale bar = 25 μm, inset scale bar = 4 μm. (F)Quantification of cryptic exon counts per cell in wildtype and mutant ANXA11 cells for STMN2, well mean indicated by dot, horizontal line indicates median, p<0.0001.
Figure 5
Figure 5. Transcriptomic signature of P93S.
(A)-(C) Expression map of ANXA11 in human brain cells. (A) Single nuclei sequencing data from control brains demonstrating the two cell types that highly express ANXA11, microglia and neurons. Unsupervised clustering of 34 cell types in the human brain. UMAP projections illustrating different cell types identified is shown on the left (A) and ANXA11 expression levels shown on the right (B). Scale represents log2 normalized average gene expression levels. Dot plot illustrating the mean normalized expression of ANXA11 by cell type (C). Scale represents percentage of total cell population expressing ANXA11, with color representing mean normalized expression per cell type. (D) and (E) Differential gene expression between wildtype and mutant ANXA11. (D) and (E) Bland-Altman mean difference plots where each dot indicates a gene for which there are counted reads from scRNAseq in iPSC-derived neurons (D) and iPSC-derived microglia (E). The x-axis is average normalized counts and the y-axis is log2 fold change. Neuronal differential expression yields few significant genes related to transcriptional regulation and endocytic vesicles (D) while many more differentially expressed in microglia related to transcriptional regulation and endocytic vesicles (E). (F) and (G) Differential microglial gene expression interferon signaling pathway. (F) STRING diagram of differentially expressed microglial genes in the interferon signaling pathway and innate immune response. Colors indicate padj. (G) Gene ontology terms for biological processes of microglial gene expression hits indicating interferon response and innate immunity. Dot size indicates number of genes in each GO grouping and color indicates −log10(FDR).
Figure 6
Figure 6. Proteomic signature of P93S.
(A) Volcano plot of proteomic changes in neurons identifying significant changes in proteins involved in vesicle transport and SNARES, corroborating functional assays indicating that P93S disrupts proper functioning of ANXA11. (B) Volcano plot of proteomic changes of mutant compared to wildtype microglia implicating inflammatory pathways, as well as transcriptional regulation and vesicular transport. Lipid metabolism protein perturbations seen are indicative of microglial dysfunction. Red dots indicate upregulated proteins (FC>2) and blue dots indicate downregulated proteins (FC<−2). Dotted line demarcates a −log10 of padj value of 1.3. (C)-(E) Unique microglia proteomic signature. (C) Venn diagram of significant differentially expressed proteins in neuron (n = 434) compared to microglia (n = 684). Significant is defined as padj>0.05. (D) Non-overlapping significant microglial proteins cluster in the lysosomal cellular component gene ontology. (E) Representation of KEGG terms of non-overlapping significant microglial proteins. Dot size indicates number of genes in each GO grouping and color indicates −log10(FDR).

References

    1. Fayer S, Horton C, Dines JN, et al. Closing the gap: Systematic integration of multiplexed functional data resolves variants of uncertain significance in BRCA1, TP53, and PTEN. The American Journal of Human Genetics. 2021;108(12):2248–2258. doi: 10.1016/J.AJHG.2021.11.001 - DOI - PMC - PubMed
    1. Costain G, Andrade DM. Third-generation computational approaches for genetic variant interpretation. Brain. 2023;146(2):411–412. doi: 10.1093/BRAIN/AWAD011 - DOI - PubMed
    1. Liao YC, Fernandopulle MS, Wang G, et al. RNA Granules Hitchhike on Lysosomes for Long-Distance Transport, Using Annexin A11 as a Molecular Tether. Cell. 2019;179(1):147–164.e20. doi: 10.1016/J.CELL.2019.08.050 - DOI - PMC - PubMed
    1. Nahm M, Lim SM, Kim YE, et al. ANXA11 mutations in ALS cause dysregulation of calcium homeostasis and stress granule dynamics. Sci Transl Med. 2020;12(566). doi: 10.1126/SCITRANSLMED.AAX3993 - DOI - PubMed
    1. Sainouchi M, Hatano Y, Tada M, et al. A novel splicing variant of ANXA11 in a patient with amyotrophic lateral sclerosis: histologic and biochemical features. Acta Neuropathol Commun. 2021;9(1). Accessed June 8, 2021. https://actaneurocomms.biomedcentral.com/articles/ - DOI - PMC - PubMed

Publication types