[Preprint]. 2023 Oct 2:rs.3.rs-3309306.
doi: 10.21203/rs.3.rs-3309306/v1.

Molecular fingerprinting of biological nanoparticles with a label-free optofluidic platform

Affiliations

Molecular fingerprinting of biological nanoparticles with a label-free optofluidic platform

Alexia Stollmann et al. Res Sq. .

Update in

Abstract

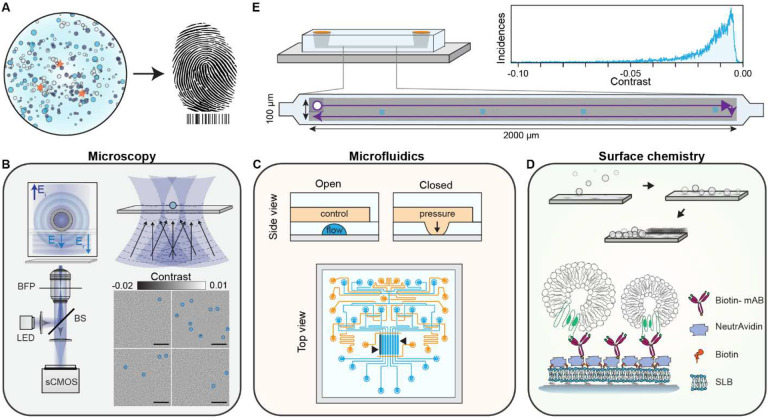
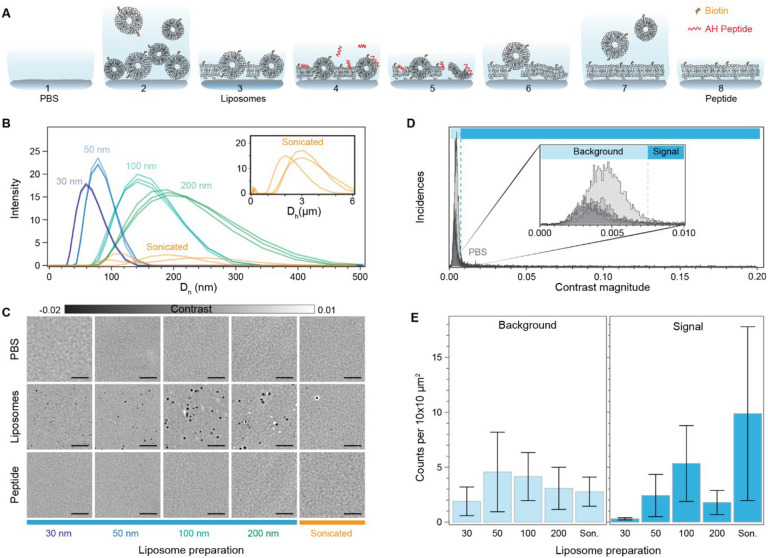
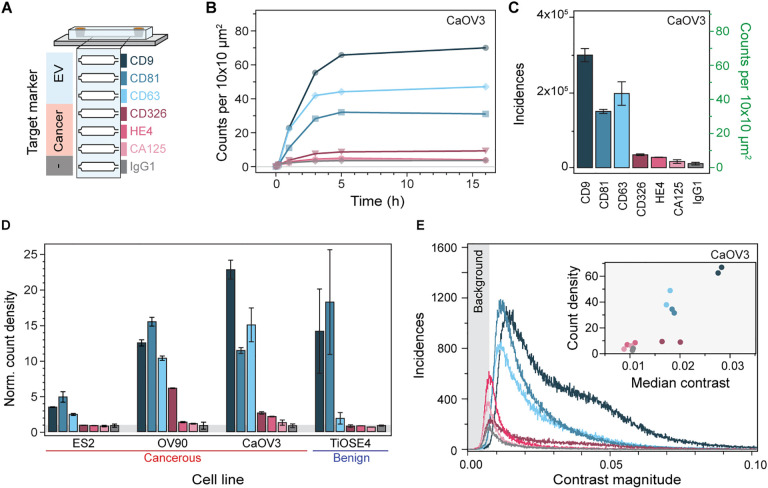
Label-free detecting multiple analytes in a high-throughput fashion has been one of the long-sought goals in biosensing applications. Yet, for all-optical approaches, interfacing state-of-the-art label-free techniques with microfluidics tools that can process small volumes of sample with high throughput, and with surface chemistry that grants analyte specificity, poses a critical challenge to date. Here, we introduce an optofluidic platform that brings together state-of-the-art digital holography with PDMS microfluidics by using supported lipid bilayers as a surface chemistry building block to integrate both technologies. Specifically, this platform fingerprints heterogeneous biological nanoparticle populations via a multiplexed label-free immunoaffinity assay with single particle sensitivity. Herein, we first thoroughly characterise the robustness and performance of the platform, and then apply it to profile four distinct ovarian cell-derived extracellular vesicle populations over a panel of surface protein biomarkers, thus developing a unique biomarker fingerprint for each cell line. We foresee that our approach will find many applications where routine and multiplexed characterisation of biological nanoparticles is required.

Keywords: Extracellular vesicles; holography; immunoassays; label-free imaging; microfluidics; multiplexing; supported lipid bilayer.


Conflict of interest statement

Competing interests: Authors declare that they have no competing interests.

Figures

Fig. 1.
Fig. 1.. Concept and workflow of the label-free optofluidic platform.
(A) Conceptual illustration of the aim of the platform. The platform is based on three main toolboxes. (B) Microscopy toolbox: schematic of the optical system for large FOV imaging with single particle sensitivity based on spatially incoherent inline holography in a reflection geometry together with four representative zoomed-in images with diffraction limited spots identified with blue circles. Inset: the working principle relies on detecting the interference between the weakly scattered light from the sample, Es, and the reflection from the substrate/water interface, Er. Scale bars: 5 μm. (C) Microfluidic toolbox: representative two-layer microfluidic chip design composed of a network of valves (orange) and flow channels (blue). The black arrows highlight the section of independently addressable channels used for sensing. (D) Surface chemistry toolbox: schematic representation of the in-chip functionalisation scheme based on SLB formation by liposome fusion, which acts as the building block for the immunoaffinity pull-down assays. (E) Workflow of the platform: representative experimental image scan of a sensing channel obtained by stitching multiple fields-of-view together with the resulting contrast distribution of all localised single particles. The scattering contrast signals are retrieved upon localising all the diffraction-limited spots above a signal-to-noise ratio (SNR) threshold, an example shown in (B).
Fig. 2.
Fig. 2.. Characterisation of the number of bilayer defects.
(A) Diagram showing the steps involved in preparation of the supported lipid bilayer via fusogenic AH peptide interaction and osmotic stress. (B) Hydrodynamic size of the different liposome preparations as determined by dynamic light scattering. (C) Zoom-in of representative images for each preparation method at the different stages of the peptide-mediated supported lipid bilayer formation process. PBS: clean substrate exposed to only buffer solution; Liposomes: substrate after vesicle fusion and buffer rinsing; Peptide: supported lipid bilayer after peptide incubation and osmotic shock buffer rinsing. (D) Particle contrast histograms from all localisations found in substrates exposed to only a buffer solution (PBS). Each line corresponds to an approximate scanned area of 0.2 mm2. (E) Particle localisation density as a function of SLB preparation and categorised according to the contrast falling within background and signal regions respectively. Each bar corresponds to the mean over N = (9,5,4,5,5) different substrates. Error bars represent the standard deviation over the mean. Scale bars: 5 μm
Fig. 3.
Fig. 3.. Robustness of the supported lipid bilayer.
(A) Cartoon depicting the difference between chip-to-chip (inter-) and within-chip (intra-) variability. (B) Number of defects within the expected background and signal contrast regions for different chips, before and after SLB formation. The number of days after liposome preparation for each chip appears on top. Each bar corresponds to the mean of scans of an approximate area of 0.2 mm2 over multiple different channels within each chip (N > 4). Error bars represent the standard deviation over the mean.
Fig. 4.
Fig. 4.. On-chip immunoaffinity capture assay validation.
(A) Representative zoom-in images of the substrate after each functionalisation step: bilayer formation, NeutrAvidin incubation, and biotinylated antibody incubation. Scale bars: 5 μm. (B) The number of localisations after each functionalisation step. (C) Validation of the immunoaffinity functionalisation using streptavidin functionalised AuNPs (AuNP-SAv) and biotinylated liposomes as positive and negative controls, respectively. Scale bars: 10 μm. (D) Dose response for different concentrations of streptavidin-functionalised 20 nm gold nanoparticles. Each data point corresponds to the mean of scans covering an area of 0.2 mm2 over multiple different channels within each chip (N = 3). Error bars represent the standard deviation over the mean.
Fig. 5.
Fig. 5.. In-chip EV binding kinetics.
(A) In-chip dose response assay for CD81+ TiOSE4 EVs with each sensing channel loaded with a different EV concentration. Top: representative zoom-in time-lapse images showing the binding kinetics upon EV injection and subsequent buffer rinsing. Scale bars: 5 μm. Bottom: measured binding kinetics expressed in terms of the number of captured EVs. Each data point corresponds to the mean of scans covering an area of 0.2 mm2. Black arrows indicate the time-point considered as steady-state. (B) Corresponding dose response at steady-state. Errors bars indicate standard deviation over the mean (N = 3). (C) Effect of flow rate on the binding kinetics at a fixed EV concentration. Each bar corresponds to the mean over 8 independent channel scans, each covering an area of 0.2 mm2. Error bars represent the standard deviation over the mean. (D) Spatially resolved intra-channel dose response kinetics under mass transport limited conditions. At flow rates below 1.3 μL/h, EV sample concentration gradients develop as a result of the mass transport limited reaction regime. Each data point corresponds to the mean of a 0.02 mm2 segment of the total scanned area (1/10th) as indicated in the diagram to the left. Arrow indicates the direction of flow, making channel position 1 the entrance of the sensing region.
Fig. 6.
Fig. 6.. Multiplexed EV fingerprinting.
(A) Schematic representation of the multiplexed in-chip immunoaffinity assay used to profile extracellular vesicles expressing different surface markers. Each sensing channel was independently functionalised with a different capture antibody. (B) In-chip binding kinetics CaOV3 EVs expressing their respective surface protein markers. (C) Molecular fingerprint of CaOV3 EVs expressed in terms of the number of EVs captured within each channel after 5h of continuous flow. The captured vesicles are given in both total and normalised incidences. Errors bars indicate the standard deviation over the mean (N = 3) (D) Molecular fingerprint of four different ovarian cell line-derived EVs normalised to the count density of the negative control IgG1. Errors bars indicate the standard deviation over the mean (N = 2). (E) Representative contrast distribution for all EVs captured within a single CaOV3 EV fingerprinting assay. Shaded area indicates the background contrast region that is not considered in the EV count density metric. Inset: correlative scatterplot comparing the median contrast magnitude against the count density of each marker expressing EV.

References

    1. Chen Z., Chen J. J. & Fan R. Single-Cell Protein Secretion Detection and Profiling. Annual Review of Analytical Chemistry 12, 431–449 (2019). - PubMed
    1. Tkach M. & Théry C. Communication by Extracellular Vesicles: Where We Are and Where We Need to Go. Cell 164, 1226–1232 (2016). - PubMed
    1. Lee K., Fraser K., Ghaddar B., Yang K., Kim E., Balaj L., Chiocca E. A., Breakefield X. O., Lee H. & Weissleder R. Multiplexed Profiling of Single Extracellular Vesicles. ACS Nano 12, 494–503 (2018). - PMC - PubMed
    1. Spitzberg J. D., Ferguson S., Yang K. S., Peterson H. M., Carlson J. C. T. & Weissleder R. Multiplexed analysis of EV reveals specific biomarker composition with diagnostic impact. Nat Commun 14, 1239 (2023). - PMC - PubMed
    1. Nikoloff J. M., Saucedo-espinosa M. A. & Dittrich P. S. Microfluidic Platform for Profiling of Extracellular Vesicles from Single Breast Cancer Cells. (2022). doi:10.1021/acs.analchem.2c04106 - DOI - PMC - PubMed

Publication types

LinkOut - more resources