[Preprint]. 2023 Oct 12:rs.3.rs-3378303.
doi: 10.21203/rs.3.rs-3378303/v1.

Heterogeneous genetic architectures and evolutionary genomics of prostate cancer in Sub-Saharan Africa

Affiliations

Heterogeneous genetic architectures and evolutionary genomics of prostate cancer in Sub-Saharan Africa

Timothy Rebbeck et al. Res Sq. .

Update in

  • Heterogeneous genetic architectures of prostate cancer susceptibility in sub-Saharan Africa.
    Janivara R, Chen WC, Hazra U, Baichoo S, Agalliu I, Kachambwa P, Simonti CN, Brown LM, Tambe SP, Kim MS, Harlemon M, Jalloh M, Muzondiwa D, Naidoo D, Ajayi OO, Snyper NY, Niang L, Diop H, Ndoye M, Mensah JE, Abrahams AOD, Biritwum R, Adjei AA, Adebiyi AO, Shittu O, Ogunbiyi O, Adebayo S, Nwegbu MM, Ajibola HO, Oluwole OP, Jamda MA, Pentz A, Haiman CA, Spies PV, van der Merwe A, Cook MB, Chanock SJ, Berndt SI, Watya S, Lubwama A, Muchengeti M, Doherty S, Smyth N, Lounsbury D, Fortier B, Rohan TE, Jacobson JS, Neugut AI, Hsing AW, Gusev A, Aisuodionoe-Shadrach OI, Joffe M, Adusei B, Gueye SM, Fernandez PW, McBride J, Andrews C, Petersen LN, Lachance J, Rebbeck TR. Janivara R, et al. Nat Genet. 2024 Oct;56(10):2093-2103. doi: 10.1038/s41588-024-01931-3. Epub 2024 Oct 2. Nat Genet. 2024. PMID: 39358599

Abstract

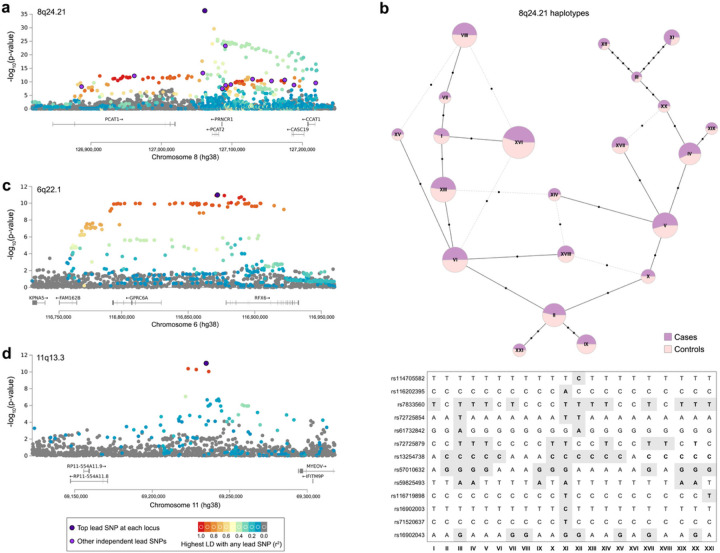
Men of African descent have the highest prostate cancer (CaP) incidence and mortality rates, yet the genetic basis of CaP in African men has been understudied. We used genomic data from 3,963 CaP cases and 3,509 controls recruited in Ghana, Nigeria, Senegal, South Africa, and Uganda, to infer ancestry-specific genetic architectures and fine-mapped disease associations. Fifteen independent associations at 8q24.21, 6q22.1, and 11q13.3 reached genome-wide significance, including four novel associations. Intriguingly, multiple lead SNPs are private alleles, a pattern arising from recent mutations and the out-of-Africa bottleneck. These African-specific alleles contribute to haplotypes with odds ratios above 2.4. We found that the genetic architecture of CaP differs across Africa, with effect size differences contributing more to this heterogeneity than allele frequency differences. Population genetic analyses reveal that African CaP associations are largely governed by neutral evolution. Collectively, our findings emphasize the utility of conducting genetic studies that use diverse populations.

Keywords: Africa; genetic heterogeneity; health disparities; population genetics; prostate cancer.


Conflict of interest statement

The authors declare no competing interests.

Figures

Figure 1
Figure 1. Population genetic structure of African men in this study.
a, Principal component analysis (PCA) reveals three broad clusters, corresponding to West, East, and South Africa. Colors of points indicate study site and genotype technology. b, ADMIXTURE plot showing the shared genetic ancestries of samples (K = 5). Additional values of K are shown in Fig. S3.
Figure 2
Figure 2. Pan-African GWAS results.
Red lines in Manhattan plots mark the genome-wide significant p-value threshold of 5×10⁻⁸ and blue lines mark the marginally significant p-value threshold of 1×10⁻⁵. a, Case/control pooled meta-analysis of 3,963 African cases and 3,509 African controls. Inset: global and African allele frequencies for rs59825493. b, Case-only GWAS of CaP aggressiveness. Sample size: 3,501 African cases with Grade Group information.
Figure 3
Figure 3. LD patterns for the top three CaP-associated loci.
Each point corresponds to a different SNP, with colors indicating the highest LD to any lead SNP at a locus (higher r2 values are represented by warmer colors). a, 8q24.21 contains thirteen independent fine-mapped SNPs at a p-value threshold of 5×10⁻⁸. b, Haplotype network at 8q24.21. Larger nodes indicate haplotypes that are more common. Proportions of cases and controls are indicated by purple and pink shading, respectively. c, 6q22.1 contains one independent fine-mapped SNPs at a p-value threshold of 5×10⁻⁸. d, 11q13.3 contains one independent fine-mapped SNPs at a p-value threshold of 5×10⁻⁸.
Figure 4
Figure 4. Replication of PRS variants in sub-Saharan Africa.
Here, we focus on how well PRS variants from Wang et al. replicate in our pan-African meta-analysis of CaP cases and controls. a, Previously identified PRS variants are enriched for low p-values in our case/control GWAS (under a null hypothesis of no replication p-values would be uniformly distributed). Bins are colored by pan-African case/control p-value (≤ 0.05 in blue and > 0.05 in gray). Panels b-f examine whether different features of PRS variants from Wang et al. PRS are associated with lower p-values in our study (Wilcoxon rank-sum tests): b, Effect sizes (PRS weights); c, LD score differences between Europe and Africa (LD scoreEUR – LD scoreAFR); d, Minor allele frequencies in Africa; e, FST between Europe and Africa (higher values are indicate of larger allele frequency differences between EUR and AFR in the 1KGP); f, SNP age, in generations.
Figure 5
Figure 5. Regional heterogeneity in the genetic architecture of CaP.
These plots focus on 90 independent marginally associated variants (p-value threshold: 1×10⁻⁵). Note that LD pruning (r2 < 0.2) yields a slightly different set of variants at 8q24.21 than fine-mapping. a, Heatmap quantifying the relative contributions of 90 CaP-associated variants to the genetic variance of case/control status (gvp, see Methods). b, Allele frequencies of CaP-associated variants in West and East Africa. b, Allele frequencies of CaP-associated variants in West and South Africa. c, Allele frequencies of CaP-associated variants in East and South Africa. d, Effect size comparisons between West and East Africa. e, Effect size comparisons between West and South Africa f, Effect size comparisons between East and South Africa. Scatterplots of effect sizes require that variants are polymorphic in both populations.
Figure 6
Figure 6. Population and evolutionary genetics of CaP-associated variants.
These plots focus on independent marginally associated variants (p-value threshold: 1×10⁻⁵) that overlap with 1KGP SNPS. a, Allele frequencies of CaP-associated variants in Europe and Africa (1KGP data, 87 SNPs). Gray circles indicate variants that are not polymorphic in Europe (minor allele frequency < 0.01). b, Ages of 63 CaP-associated variants estimated using GEVA in African populations from the 1KGP data. Gray circles indicate SNPs that are not polymorphic in Europe. c-e, Tests of recent natural selection acting on CaP-associated variants in Africa, Europe, and East Asia (c, YRI: Yoruba in Ibadan, Nigeria; d, CEU: Utah residents with Northern and Western European Ancestry; e, CHB: Han Chinese in Beijing). Because iHS statistics require minor allele frequencies > 1% in the target population, our analysis was restricted to 65 CaP-associated variants in Africa, 26 variants in and 25 variants in East Asia. iHS scores quantify signatures of natural selection, and they follow a standard normal distribution under a null hypothesis of neutral evolution. CaP-associated variants are not enriched for extreme iHS scores (i.e., z-scores ≤ −2 or ≥ 2).

References

    1. Sung H. et al. Global Cancer Statistics 2020: GLOBOCAN Estimates of Incidence and Mortality Worldwide for 36 Cancers in 185 Countries. CA Cancer J Clin 71, 209–249 (2021). - PubMed
    1. McHugh J. et al. Prostate cancer risk in men of differing genetic ancestry and approaches to disease screening and management in these groups. Br J Cancer 126, 1366–1373 (2022). - PMC - PubMed
    1. Rebbeck T.R. Prostate Cancer Disparities by Race and Ethnicity: From Nucleotide to Neighborhood. Cold Spring Harb Perspect Med 8(2018). - PMC - PubMed
    1. Smith Z.L., Eggener S.E. & Murphy A.B. African-American Prostate Cancer Disparities. Curr Urol Rep 18, 81 (2017). - PubMed
    1. Surveillance Research Program NCI. SEER* Explorer: An interactive website for SEER cancer statistics. (NIH Bethesda, MD, 2021).

Publication types

LinkOut - more resources