[Preprint]. 2023 Oct 10:rs.3.rs-1417511.
doi: 10.21203/rs.3.rs-1417511/v1.

Prefrontal Cortical Regulation of REM Sleep

Affiliations

Prefrontal Cortical Regulation of REM Sleep

Franz Weber et al. Res Sq. .

Update in

  • Prefrontal cortical regulation of REM sleep.
    Hong J, Lozano DE, Beier KT, Chung S, Weber F. Hong J, et al. Nat Neurosci. 2023 Oct;26(10):1820-1832. doi: 10.1038/s41593-023-01398-1. Epub 2023 Sep 21. Nat Neurosci. 2023. PMID: 37735498

Abstract

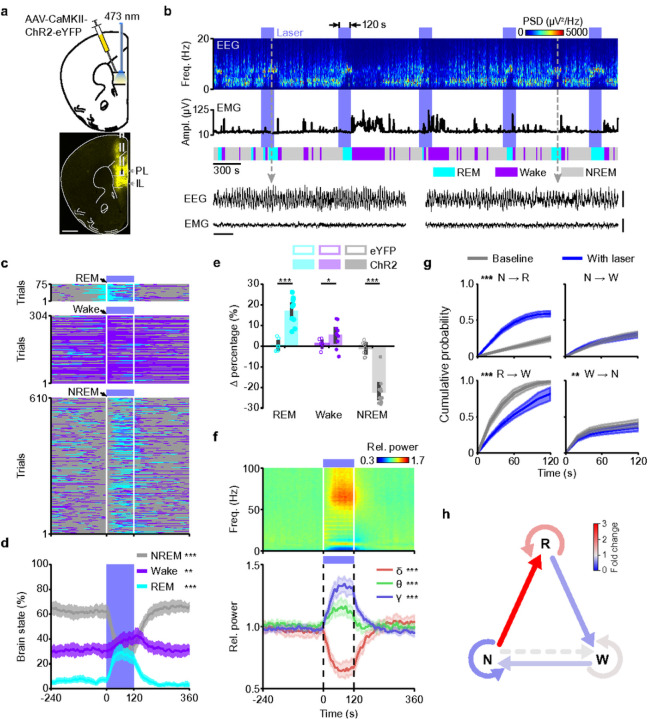
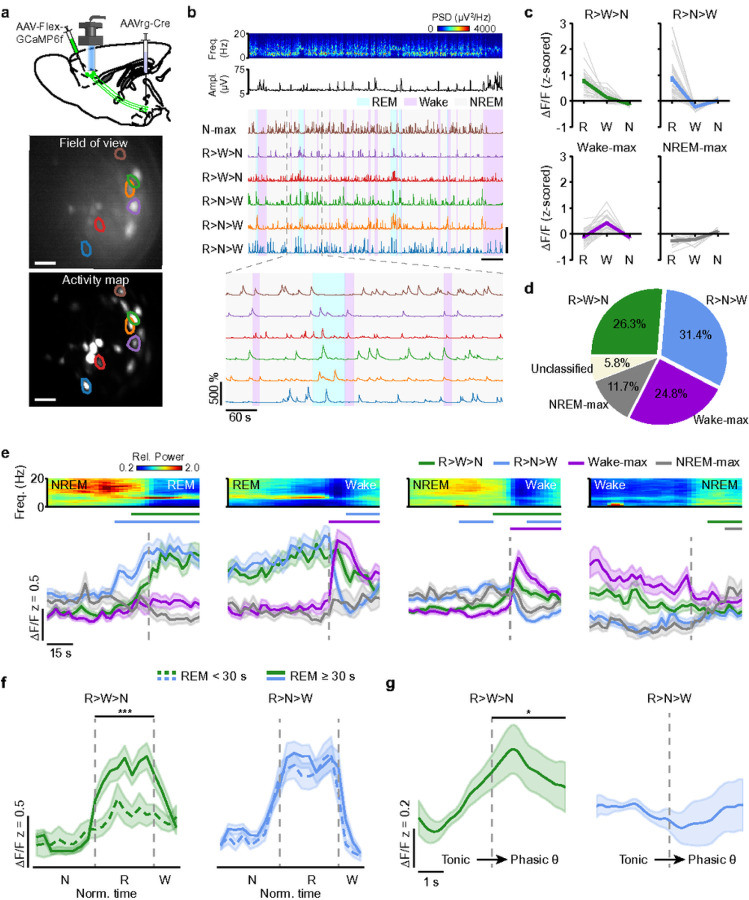
Rapid-eye-movement (REM) sleep is accompanied by intense cortical activity, underlying its wake-like electroencephalogram (EEG). The neural activity inducing REM sleep is thought to originate from subcortical circuits in brainstem and hypothalamus. However, whether cortical neurons can also trigger REM sleep has remained unknown. Here, we show in mice that the medial prefrontal cortex (mPFC) strongly promotes REM sleep. Bidirectional optogenetic manipulations demonstrate that excitatory mPFC neurons promote REM sleep through their projections to the lateral hypothalamus (LH) and regulate phasic events, reflected in accelerated EEG theta oscillations and increased eye-movement density during REM sleep. Calcium imaging reveals that the majority of LH-projecting mPFC neurons are maximally activated during REM sleep and a subpopulation is recruited during phasic theta accelerations. Our results delineate a cortico-hypothalamic circuit for the top-down control of REM sleep and identify a critical role of the mPFC in regulating phasic events during REM sleep.


Conflict of interest statement

COMPETING INTERESTS The authors declare no competing interests.

Figures

Figure 1
Figure 1. Optogenetic activation of mPFC Pyr neurons triggers REMs.
(a) Top, schematic of optogenetic activation of mPFC Pyr neurons. Bottom, expression of AAV-CaMKII-ChR2-eYFP (yellow) in mPFC of a C57BL/6J mouse. Dashed lines, optic fiber tract. Scale bar, 500 μm. IL, infralimbic cortex; PL, prelimbic cortex. Brain atlas image adapted with permission from ref.. (b) Example open-loop stimulation experiment. Shown are EEG spectrogram, EMG amplitude, brain states, and EEG, EMG raw traces at an expanded timescale for two time points (gray lines); scale bars, 1 s and 0.5 mV. Blue patches, 120 s laser stimulation intervals (473 nm, 5 Hz). PSD, power spectral density. (c) Brain states in all stimulation trials from n = 11 mice aligned by the laser onset at t = 0 s. Trials were sorted depending on the brain state at laser onset (arrows). (d) Percentages of brain states before, during, and after open-loop stimulation. Blue patch, laser stimulation interval. Two-way repeated-measures (rm) ANOVA comparing the mean percentage of each brain state between the laser and preceding 120 s baseline interval (interaction, P = 0.0000); t-tests with Holm-Bonferroni correction; baseline vs laser for REM, P = 0.0000; for wake, P = 0.0093; for NREM, P =0.0000. n = 11 mice. Lines, averages across mice; shadings, 95% confidence intervals (CIs). (e) Changes in the percentage of each brain state (difference between preceding 120 s baseline and laser interval) induced by laser stimulation in ChR2 and eYFP mice. Mixed ANOVA with brain state as within and virus as between factor (interaction, P = 0.0000); t-tests with Holm-Bonferroni correction; eYFP vs ChR2 for REM, P = 0.0000; for wake, P = 0.0321; for NREM, P = 0.0000. ChR2, n = 11; eYFP, n = 8 mice. Bars, averages across mice; dots, individual mice; error bars, 95% CIs. (f) Top, laser-trial averaged EEG spectrogram (normalized by the mean power in each frequency band; Methods). Bottom, time course of δ (0.5 – 4.5 Hz), θ (6 – 9.5 Hz), and γ power (50 – 90 Hz) before, during, and after laser stimulation. Two-way rm ANOVA comparing the mean power in each frequency band between the laser and preceding 120 s baseline interval (interaction, P = 0.0000); t-tests with Holm-Bonferroni correction; baseline vs laser: δ, P = 0.0000; θ, P = 0.0006; γ, P = 0.0000. n = 11 mice. Lines, averages across mice; shadings, 95% CIs. (g) Cumulative probabilities to transition from brain state X at laser onset (t = 0 s) to state Y within the laser interval (blue) and the 120 s baseline interval preceding laser onset (gray). Bootstrap; N→R, P = 0.0001; R→W, P = 0.0001; N→W, P = 0.9274; W→N, P = 0.0042; n = 11 mice. Shadings, 95% CIs. (h) Graph summarizing relative changes in the cumulative transition probabilities between baseline and laser interval (Methods). A value of 1 indicates no change between baseline and laser. The edges for Wake→REM and REM→NREM transitions were omitted, as these types of transitions were not observed in the dataset. Solid and dashed lines indicate significant and non- significant changes in the transition probabilities, respectively. See Supplementary Table 1 for detailed statistical information. *P<0.05, **P<0.01, ***P<0.001.
Figure 2
Figure 2. Activation of mPFC Pyr neurons maintains REM sleep and promotes phasic θ events.
(a) Schematic of optogenetic closed-loop stimulation during REM sleep. Brain atlas image adapted with permission from ref.. (b) Example illustrating closed-loop activation of mPFC Pyr neurons during REM sleep (blue patches; 473 nm, 5 Hz). Shown are EEG spectrogram, EMG amplitude, brain states, and EEG, EMG raw traces for two time points (gray lines); scale bars, 1 s and 0.5 mV. (c) Duration of REM sleep episodes with (ON) and without closed-loop stimulation (OFF) in mice expressing eYFP or ChR2 in mPFC Pyr neurons. Mixed ANOVA with laser (P = 0.0000) as within and virus as between factor (interaction, P = 0.0000); t-tests with Holm-Bonferroni correction; OFF vs ON: eYFP, P = 0.7370; for ChR2, P = 0.0001; eYFP vs ChR2: OFF, P = 0.0009; ON, P = 0.0046. ChR2, n = 11; eYFP, n = 8 mice. Box plots (see Methods for definition); lines, individual mice. (d) Example of a phasic θ event (red). Shown are raw EEG, EEG spectrogram, raw EMG and heartbeats (blue ticks) detected in the EMG (Methods). Scale bars, 1 s and 250 μV. (e) PSD of the EEG during phasic θ events and remaining REM sleep (tonic θ) with (ON) and without laser (OFF). The peak frequency and θ power (5 – 12 Hz) were increased during phasic θ events. Peak frequency, two-way rm ANOVA with type of REM (tonic or phasic, P = 0.0000) and laser (OFF or ON) as within factors (interaction, P = 0.0046); t-tests with Holm-Bonferroni correction; tonic vs phasic: OFF, P = 0.0000; ON, P = 0.0000. θ power, two-way rm ANOVA (type, P = 0.0000; interaction, P = 0.8041); t-tests; tonic vs phasic: OFF, P = 0.0000; ON, P = 0.0000. n = 11 mice. Lines, averages across mice; shadings, 95% CIs. (f) Heart rate during phasic θ events and remaining REM sleep (tonic θ) with (ON) and without laser (OFF). Two-way rm ANOVA with type of REM (tonic or phasic, P = 0.0000) and laser (OFF or ON) as within factors (interaction, P = 0.0016); t-tests with Holm-Bonferroni correction; tonic vs phasic: OFF, P = 0.0000; ON, P = 0.0000. n = 8 mice. Box plots; lines, individual mice; bpm, beats per minute. (g) Frequency of phasic θ events during REM sleep episodes with (ON) and without laser (OFF) in eYFP and ChR2 mice. Mixed ANOVA with laser as within (P = 0.0001) and virus as between factor (interaction, P = 0.0007); pairwise t-tests with Holm-Bonferroni correction; OFF vs ON: eYFP, P = 0.9671; ChR2, P = 0.0007; eYFP vs ChR2: OFF, P = 0.0195; ON, P = 0.0019. ChR2, n = 11; eYFP, n = 8 mice. Box plots; lines, individual mice. (h) Example illustrating closed-loop inhibition of mPFC Pyr neurons using iC++ during REM sleep (green patches; 473 nm, step pulse). Scale bars, 1 s and 0.5 mV. (i) Duration of REM sleep episodes with and without closed-loop inhibition of mPFC Pyr neurons in eYFP and iC++ mice. mixed ANOVA (laser, P = 0.0032; interaction, P = 0.0004); pairwise t-tests with Holm-Bonferroni correction; OFF vs ON: eYFP, P = 0.5312; iC++, P = 0.0002; eYFP vs iC++: OFF, P = 0.0988; ON, P = 0.1345. iC++, n = 8; eYFP, n = 8 mice. Box plots; lines, individual mice. (j) Frequency of phasic θ events during REM sleep episodes with and without closed-loop inhibition in eYFP and iC++ mice. Mixed ANOVA (laser, P = 0.0473; interaction, P = 0.0002); pairwise t-tests with Holm-Bonferroni correction; OFF vs ON: eYFP, P = 0.0703; iC++, P = 0.0039; eYFP vs. iC++: OFF, P = 0.4757; ON, P = 0.0003. iC++, n = 8; eYFP, n = 8 mice. Box plots; lines, individual mice. See Supplementary Table 1 for detailed statistical information. *P<0.05, **P<0.01, ***P<0.001.
Figure 3
Figure 3. Optogenetic activation of mPFC inhibitory neurons suppresses REM sleep.
(a) Left, schematic illustrating optogenetic activation of mPFC Vgat neurons. Right, fluorescence image in a Vgat-IRES-Cre mouse injected with AAV-DIO-ChR2-eYFP. Dashed lines, optic fiber tract. Scale bar, 500 μm. Brain atlas image adapted with permission from ref.. (b) Example open-loop experiment in a Vgat-IRES-Cre mouse. Shown are EEG spectrogram, EMG amplitude, brain states, and EEG, EMG raw traces for two time points (gray lines); scale bars, 1 s and 0.5 mV. Blue patches, 120 s laser stimulation intervals (473 nm, 20 Hz). (c) Laser stimulation trials from all n = 8 mice, sorted depending on the brain state at laser onset (t = 0 s, arrows). (d) Percentages of brain states before, during, and after laser stimulation. Blue bar, laser stimulation interval. Two-way rm ANOVA (interaction, P = 0.0001); t-tests with Holm-Bonferroni correction; baseline vs laser: REM, P = 0.0007; wake, P = 0.7588; NREM, P = 0.0029. n = 8 mice. Lines, averages across mice; shadings, 95% CIs. (e) Changes in the percentage of each brain state (difference between preceding 120 s baseline and laser interval) induced by laser stimulation in ChR2 and eYFP mice. Mixed ANOVA (interaction, P = 0.0000); t-tests with Holm-Bonferroni correction; eYFP vs ChR2: REM, P = 0.0001; wake, P = 0.6354; NREM, P = 0.0005. ChR2, n = 8; eYFP, n = 7 mice. Bars, averages across mice; dots, individual mice; error bars, 95% CIs. (f) Cumulative transition probabilities during baseline (120 s interval before laser onset) and laser interval. Bootstrap; N→R, P = 0.0001; R→W, P = 0.0001; N→W, P = 0.0824; W→N, P = 0.0246; n = 8 mice. Shadings, 95% CIs. (g) Graph visualizing the laser-induced changes in the cumulative transition probabilities. (h) Duration of REM sleep episodes with (ON) and without closed-loop stimulation (OFF) in eYFP and ChR2 mice. Mixed ANOVA (laser, P = 0.0000; interaction, P = 0.0001); t-tests with Holm-Bonferroni correction; OFF vs ON: eYFP, P = 0.4062; ChR2, P = 0.0000; eYFP vs ChR2: OFF, P = 0.3690; ON, P = 0.0183. ChR2, n = 8; eYFP, n = 7 mice. Box plots; lines, individual mice. (i) Frequency of phasic θ events during REM sleep episodes with and without laser in eYFP and ChR2 mice. Mixed ANOVA (laser, P = 0.0000; interaction, P = 0.0000); t-tests with Holm-Bonferroni correction; OFF vs ON: eYFP, P = 0.6309; ChR2, P = 0.0000; eYFP vs ChR2: OFF, P = 0.3836; ON, P = 0.0001. ChR2, n = 8; eYFP, n = 7 mice. Box plots; lines, individual mice. See Supplementary Table 1 for detailed statistical information. *P<0.05, **P<0.01, ***P<0.001.
Figure 4
Figure 4. The effects on REM sleep and phasic θ events are mediated by LH-projecting mPFC neurons.
(a) Schematic illustrating optogenetic activation of mPFC→LH neurons. Top, C57BL/6J mice were injected with AAVrg-Cre-mCherry into the lateral hypothalamus (LH) and AAV-DIO-ChR2-eYFP into the mPFC, followed by implantation of an optic fiber into the mPFC. Bottom, expression of ChR2-eYFP in the mPFC (left) and Cre-mCherry in the LH (right). Scale bars, 500 μm.. (b) Percentages of brain states before, during, and after open-loop stimulation. Blue bar, laser stimulation interval. Two-way rm ANOVA (interaction, P = 0.0002); t-tests with Holm-Bonferroni correction; baseline vs laser: REM, P = 0.0006; wake, P = 0.0478; NREM, P = 0.0013. n = 10 mice. Lines, averages across mice; shadings, 95% CIs.. (c) Laser stimulation trials from all n = 10 mice, sorted depending on the brain state at laser onset (t = 0 s, arrows).. (d) Cumulative transition probabilities during baseline and laser interval for open-loop activation of mPFC→LH neurons. Bootstrap; N→R, P = 0.0001; R→W, P = 0.0001; N→W, P = 0.0001; W→N, P = 0.8128; n = 10 mice. Shadings, 95% CIs.. (e) Graph summarizing laser-induced changes in the cumulative transitions probabilities.. (f) Left, effect of closed-loop activation of mPFC→LH neurons on REM sleep duration. Mixed ANOVA (laser, P = 0.0002; interaction, P = 0.0004); t-tests with Holm-Bonferroni correction; OFF vs ON: eYFP, P = 0.9388; ChR2, P = 0.0014; eYFP vs ChR2: OFF, P = 0.2100; ON, P = 0.0003. ChR2, n = 10; eYFP, n = 9 mice. Box plots; lines, individual mice.. (g) Frequency of phasic θ events during REM sleep episodes with (ON) and without closed-loop activation (OFF). Mixed ANOVA (laser, P = 0.0007; interaction, P = 0.0034); t-tests with Holm-Bonferroni correction; OFF vs ON: eYFP, P = 0.5128; ChR2, P = 0.0043; eYFP vs ChR2: OFF, P = 0.0066; ON, P = 0.0138. ChR2, n = 10; eYFP, n = 9 mice. Box plots; lines, individual mice.. (h) Schematic illustrating optogenetic inhibition of mPFC→LH neurons. Top, C57BL/6J mice were injected with AAVrg-Cre-mCherry into the LH and with AAV-DIO-iC++-eYFP into the mPFC, followed by bilateral implantation of optic fibers into the mPFC. Bottom, expression of iC++-eYFP in the mPFC (left) and Cre-mCherry in the LH (right). Scale bars, 500 μm.. (i) Percentages of brain states before, during, and after open-loop inhibition. Green bar, laser stimulation interval (473 nm, 120 s step pulse). Two-way rm ANOVA (interaction, P = 0.0022); paired t-tests with Holm-Bonferroni correction; baseline vs laser: REM, P = 0.0000; wake, P = 0.0088; NREM, P = 0.1668. n = 10 mice. Lines, averages across mice; shadings, 95% CIs.. (j) Laser stimulation trials from all n = 10 mice.. (k) Cumulative transition probabilities during baseline and laser interval for open-loop inhibition of mPFC→LH neurons. Bootstrap; N→R, P = 0.0001; R→W, P = 0.0622; N→W, P = 0.0002; W→N, P = 0.3630; n = 10 mice. Shadings, 95% CIs.. (l) Graph visualizing changes in the cumulative transitions probabilities induced by mPFC→LH inactivation.. (m) Left, effect of closed-loop inhibition of mPFC→LH neurons on REM sleep duration. Mixed ANOVA (laser, P = 0.0004; interaction, P = 0.0033); t-tests with Holm-Bonferroni correction; OFF vs ON: eYFP, P = 0.7220; iC++, P = 0.0005; eYFP vs. iC++: OFF, P = 0.4493; ON, P = 0.0212. iC++, n = 10; eYFP, n = 8 mice. Box plots; lines, individual mice.. (n) Frequency of phasic θ events during REM sleep episodes with and without closed-loop inhibition. Mixed ANOVA (laser, P = 0.2558; interaction, P = 0.0108); t-tests with Holm-Bonferroni correction; OFF vs ON: eYFP, P = 0.2931; iC++, P = 0.0143; eYFP vs iC++: OFF, P = 0.5441; ON, P = 0.0244; iC++, n = 10; eYFP, n = 8 mice. Box plot; lines, individual mice.. Brain atlas images in (a,h) adapted with permission from ref.. See Supplementary Table 1 for detailed statistical information. *P<0.05, **P<0.01, ***P<0.001.
Figure 5
Figure 5. Activity of LH-projecting mPFC neurons during sleep.
(a) Top, schematic of calcium imaging of mPFC→LH neurons using microendoscope. Bottom, field of view and pixel-wise activity map of an example imaging session. Colored polygons, example regions-of-interest (ROIs). Scale bars, 50 μm.. (b) EEG power spectrogram, EMG amplitude, brain states, and ΔF/F traces for the cells (ROIs) outlined in (a). The dashed lines indicate a region in which the ΔF/F signals are shown on an expanded time scale. The subclasses of the shown cells are indicated on the right. Scale bars, 300 s and 500%.. (c) Average calcium activity (ΔF/F, z-scored) of different cell subclasses during each brain state (R>W>N, n = 36; R>N>W, n = 43; Wake-max, n = 34; NREM-max, n = 16 cells; n = 8 mice). Bold lines, mean across cells ± s.e.m.; gray lines, individual cells.. (d) Proportion of different cell subclasses in the population of mPFC→LH neurons.. (e) Average EEG spectrogram (normalized by the mean power in each frequency band) and mean calcium activity (ΔF/F, z-scored) of the different cell subclasses at brain state transitions. Horizontal lines indicate for each subclass time points for which the ΔF/F activity significantly differed from baseline (Supplementary Table 3; Methods). R>W>N, n = 36; R>N>W, n = 43; Wake-max, n = 34; NREM-max, n = 16 cells. Lines, averages across cell subclasses; shadings, ± s.e.m.. (f) Activity of R>W>N and R>N>W cells during short (< 30 s) and long (≥ 30 s) REM sleep episodes. The duration of REM (R), wake (W), and NREM (N) episodes were normalized in time. Two-way rm ANOVA with REM duration (short or long; R>W>N: P = 0.0057, R>N>W: P = 0.4282) and brain state as within factors (interaction; R>W>N: P = 0.0014, R>N>W: 0.3656); t-tests with Holm-Bonferroni correction for REM; R>W>N: P = 0.0002. R>W>N, n = 36; R>N>W, n = 43 cells. Lines, mean across cells; shadings, ± s.e.m.. (g) Activity of different cell subclasses at transitions from tonic REM to phasic θ events (onset at t = 0 s). Paired t-test comparing mean activity during preceding tonic REM and phasic θ event; R>W>N, P = 0.0232; R>N>W, P = 0.7471. R>W>N, n = 36; R>N>W, n = 43 cells. Lines, mean across cells; shadings, ±s.e.m.. See Supplementary Table 1 for detailed statistical information. *P<0.05, ***P<0.001.
Figure 6
Figure 6. Presynaptic inputs of LH-projecting mPFC neurons.
(a) Schematic illustration of rabies-mediated tracing of monosynaptic inputs to mPFC→LH neurons. Cre-recombinase was expressed in the mPFC→LH neurons by injecting AAVrg-Cre into the LH. For transsynaptic tracing, AAVs expressing a mutant EnvA receptor fused with mCherry (TC66T) and rabies glycoprotein (RG) were injected into the mPFC, followed by injection of the RG-deleted rabies virus expressing eGFP (RVdG-eGFP).. (b) Left, fluorescence image showing the location of starter cells in mPFC. Scale bar, 500 μm.. Middle, cells expressing TC66T (red) and eGFP (green) in mPFC. Scale bars, 500 μm. Right, enlarged view of starter cells expressing both TC66T and eGFP (white arrowheads). Scale bars, 25 μm. DP, dorsal peduncular cortex. Brain atlas images adapted with permission from ref... (c) Distribution of starter cells within different mPFC subregions in all animals (n = 4 mice). Cg2, cingulate cortex area 2.. (d–g) RV-eGFP labeled cells in cingulate cortex (d), thalamic regions (e), septum and basal forebrain (f), and ventral hippocampus (g). The location of each fluorescence image within the mouse brain is indicated by the schematic brain sections on top. M2, secondary motor cortex; Cg1, cingulate cortex area 1; AV, anteroventral thalamic nucleus; AM, anteromedial thalamic nucleus; Re, reuniens thalamic nucleus; PVA, paraventricular thalamic nucleus, anterior part. LS, lateral septal nucleus; MS, medial septal nucleus; VDB, nucleus of the vertical limb of the diagonal band; HDB, nucleus of the horizontal limb of the diagonal band. DS, dorsal subiculum; DG, dentate gyrus. Scale bars, 500 μm.. (h) Proportion of RV-eGFP labeled inputs of mPFC→LH neurons across brain regions (see Supplementary Table 4 for definition of brain region abbreviations). Bars, averages across mice; error bars, 95% CI; dots, individual mice; n = 4 mice.

References

    1. Jouvet M. Recherches sur les structures nerveuses et les mécanismes responsables des différentes phases du sommeil physiologique. Arch Ital Biol 100, 125–206 (1962). - PubMed
    1. Maquet P. et al. Functional neuroanatomy of human rapid-eye-movement sleep and dreaming. Nature 383, 163–166 (1996). - PubMed
    1. Peever J. & Fuller P. M. The Biology of REM Sleep. Curr. Biol. 27, R1237–R1248 (2017). - PubMed
    1. Renouard L. et al. The supramammillary nucleus and the claustrum activate the cortex during REM sleep. Sci. Adv. 1, e1400177 (2015). - PMC - PubMed
    1. Nofzinger E. A., Mintun M. A., Wiseman M., Kupfer D. J. & Moore R. Y. Forebrain activation in REM sleep: an FDG PET study. Brain Res. 770, 192–201 (1997). - PubMed

Publication types

LinkOut - more resources