[Preprint]. 2023 Sep 3:2023.09.03.556088.
doi: 10.1101/2023.09.03.556088.

Protein coopted from a phage restriction system dictates orthogonal cell division plane selection in Staphylococcus aureus

Affiliations

Protein coopted from a phage restriction system dictates orthogonal cell division plane selection in Staphylococcus aureus

Félix Ramos-León et al. bioRxiv. .

Update in

  • PcdA promotes orthogonal division plane selection in Staphylococcus aureus.
    Ramos-León F, Anjuwon-Foster BR, Anantharaman V, Updegrove TB, Ferreira CN, Ibrahim AM, Tai CH, Kruhlak MJ, Missiakas DM, Camberg JL, Aravind L, Ramamurthi KS. Ramos-León F, et al. Nat Microbiol. 2024 Nov;9(11):2997-3012. doi: 10.1038/s41564-024-01821-8. Epub 2024 Oct 28. Nat Microbiol. 2024. PMID: 39468247 Free PMC article.

Abstract

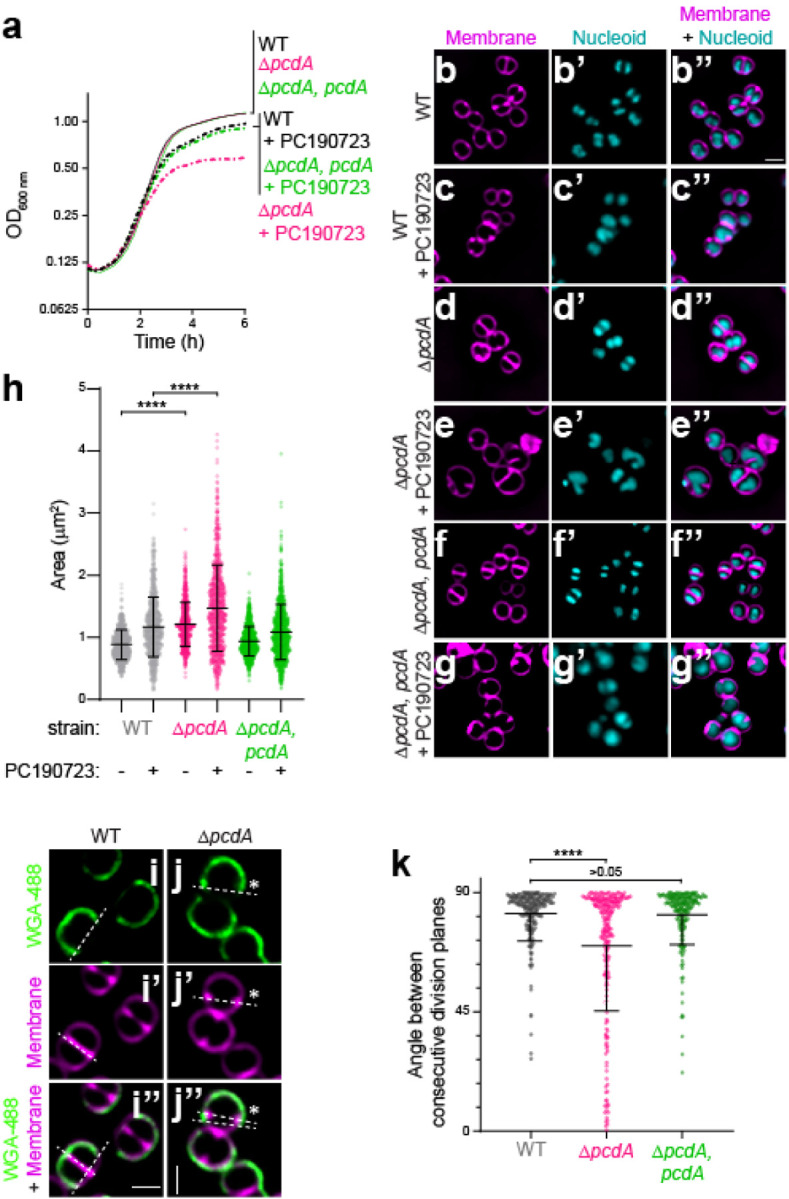
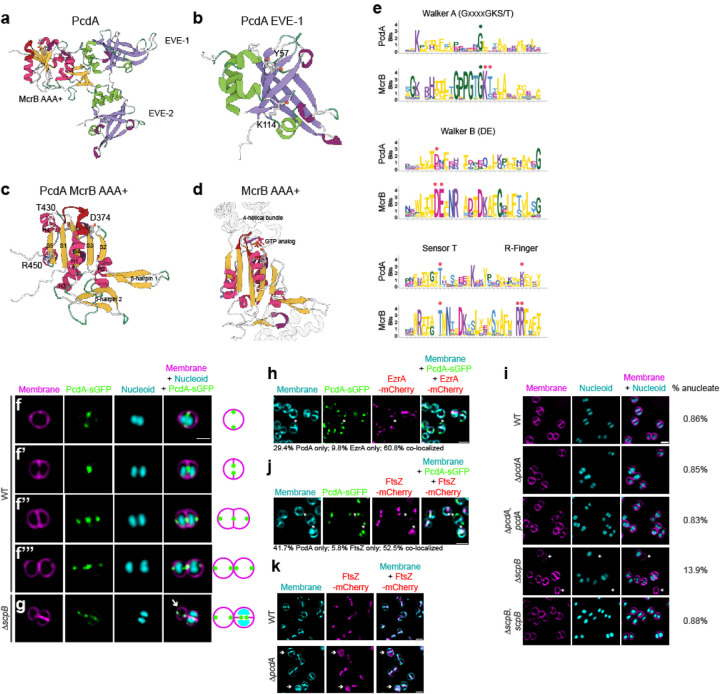
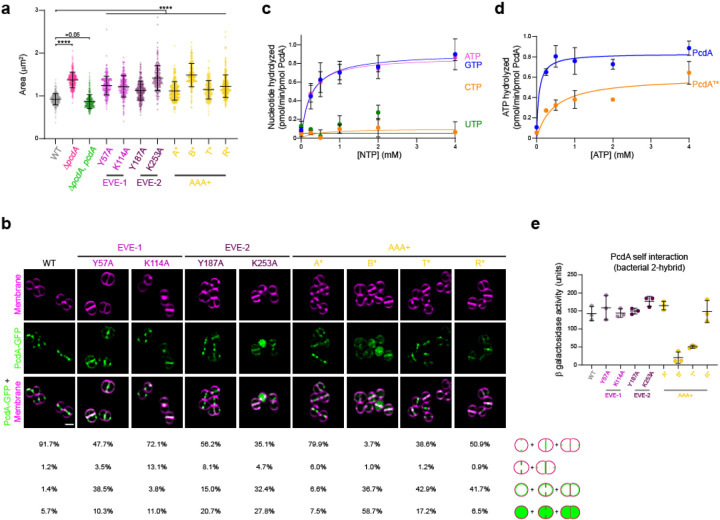
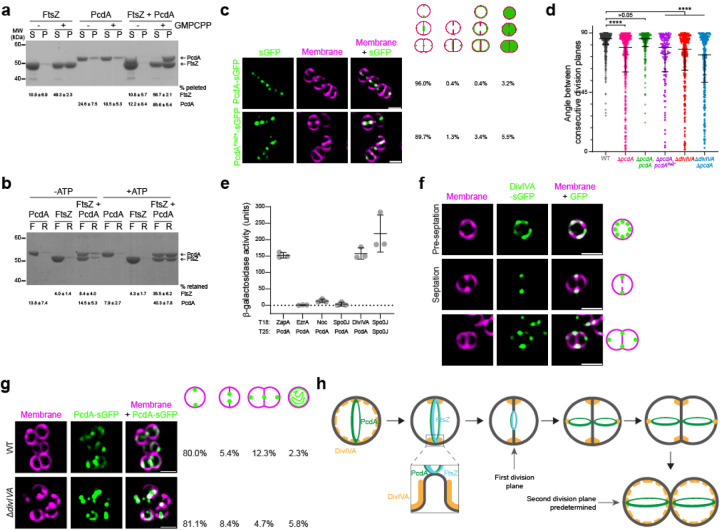
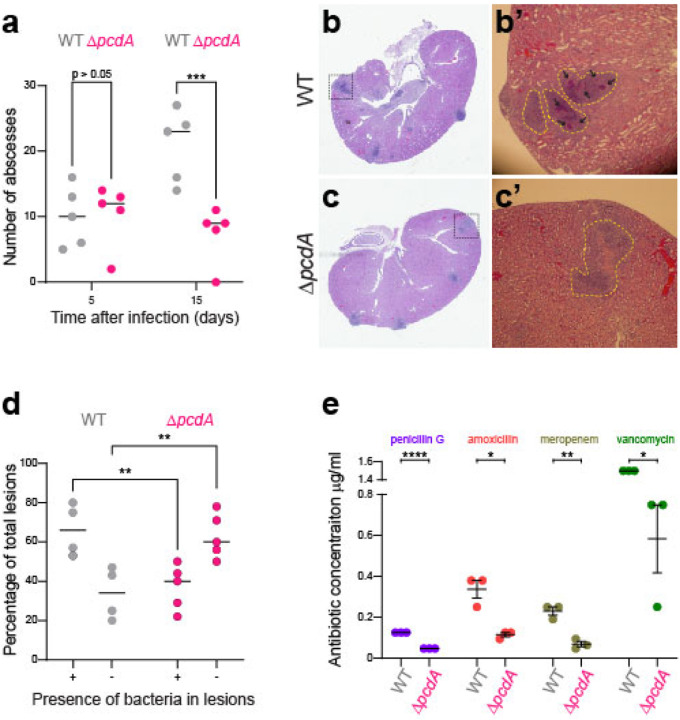
The spherical bacterium Staphylococcus aureus, a leading cause of nosocomial infections, undergoes binary fission by dividing in two alternating orthogonal planes, but the mechanism by which S. aureus correctly selects the next cell division plane is not known. To identify cell division placement factors, we performed a chemical genetic screen that revealed a gene which we termed pcdA. We show that PcdA is a member of the McrB family of AAA+ NTPases that has undergone structural changes and a concomitant functional shift from a restriction enzyme subunit to an early cell division protein. PcdA directly interacts with the tubulin-like central divisome component FtsZ and localizes to future cell division sites before membrane invagination initiates. This parallels the action of another McrB family protein, CTTNBP2, which stabilizes microtubules in animals. We show that PcdA also interacts with the structural protein DivIVA and propose that the DivIVA/PcdA complex recruits unpolymerized FtsZ to assemble along the proper cell division plane. Deletion of pcdA conferred abnormal, non-orthogonal division plane selection, increased sensitivity to cell wall-targeting antibiotics, and reduced virulence in a murine infection model. Targeting PcdA could therefore highlight a treatment strategy for combatting antibiotic-resistant strains of S. aureus.

Keywords: MRSA; Min system; MinCDE; MreB; vancomycin.


Figures

Figure 1.
Figure 1.. Deletion of pcdA results in a cell division defect.
(a) Growth curves of WT (black), ΔpcdA (magenta), and ΔpcdA complemented at an ectopic chromosomal locus with pcdA (green) in rich media in the absence (solid lines) or presence (dashed lines) of 200 ng ml−1 FtsZ inhibitor PC190723. (b-g”) Cell morphologies of (b-c”) WT, (d-e”) ΔpcdA, or (f-g”) ΔpcdA complemented with pcdA in the (b-b”, d-d”, f-f”) absence or (c-c”, e-e”, g-g”) presence of PC190723 examined using fluorescence microscopy. b-g: membranes visualized with FM4–64 (magenta); b’-g’: nucleoid visualized using DAPI (cyan); b”-g”: overlay, membrane and nucleoid. Scale bar: 1 μm. (h) Cell sizes (calculated as area) of WT (gray), ΔpcdA (magenta), or ΔpcdA complemented with pcdA (green) strains in the presence or absence of PC190723 (n > 700 cells). Statistical analysis: one-way ANOVA; **** indicates p value < 0.001. (i-j”) Representative fluorescence micrographs of (i) WT and (j) ΔpcdA stained with fluorescently labeled wheat germ agglutinin (WGA-488) and membrane dye FM4–64. WGA-488 was washed away and cells were allowed to divide for one round of cell division resulting in half cell staining. (i-j): fluorescence from WGA-488 (green); (i’-j’): membranes stained with FM4–64 (magenta); (i”-j”): overlay of WGA-488 and membranes. Division planes areindicated with dashed lines. Asterisk indicates a ΔpcdA cell with misplacement of the second division plane. Strains: JE2 and FRL60. (k) Angle between consecutive division planes in WT (gray), ΔpcdA (magenta), or ΔpcdA complemented with pcdA (green) strains. Bars indicate median; interquartile range indicated with whiskers. Strains: JE2, FRL60, and FRL62. Statistical analysis: Kruskal-Wallis; **** indicates < 0.0001.
Figure 2.
Figure 2.. PcdA is an early cell division protein that belongs to the AAA+ family of NTPases.
(a-d) Cartoon representations of the predicted AF2-generated structures of (a) full length PcdA, (b) EVE domain 1 of PcdA, and (c) McrB AAA+ domain of PcdA. (d) Crystal structure of Thermococcus gammatolerans McrB (PDB: 6UT3). Select residues mentioned in the text are marked. (e) Sequence logo displaying conservation of amino residues in indicated motifs of the AAA+ domains of PcdA and McrB orthologs. The height of each residue is scaled as per the bitscore of conservation in the MSA, measured using Shannon entropy. Red dots: key active site residues; green dots: other conserved sites. (f-g) Subcellular localization of PcdA-sGFP in (f) pre-divisional, (f’) nascently dividing, (f”) nearly completely divided, or (f”’) completely divided S. aureus cell, or (g) in a representative anucleate ΔscpB mutant S. aureus cell. Arrow indicates an anucleate cell. First column: membranes visualized using FM4–64 (magenta); second column: PcdA-sGFP (green); third column: nucleoid visualized using DAPI (cyan); fourth column: overlay of membrane, nucleoid, and PcdA-sGFP. Schematic representation of PcdA localization (green: PcdA; magenta: membrane) shown to the right. Strains used: FRL28 and FRL68. (h) Colocalization of PcdA-sGFP and EzrA-mCherry. Panels from left to right: membranes visualized using TMA-DPH (cyan); PcdA-sGFP (green); EzrA-mCherry (magenta); overlay of membranes, PcdA-sGFP, and EzrA-mCherry. Arrow indicates a representative PcdA-sGFP focus without colocalization of EzrA-mCherry. Localization frequencies of PcdA-sGFP or EzrA-mCherry alone, or colocalization of both proteins are indicated below. Strain FRL109. (i) Analysis of presence of anucleate cells in the JE2 wild type strain (WT), ΔpcdA, complemented ΔpcdA, ΔscpB, and complemented ΔscpB. First column shows membrane in magenta stained with FM4–64; second column showsnucleoid in cyan stained with DAPI; and third column shows the overlay of the two previous images. Percentage of anucleate cells for each strain is indicated in the fourth column (n > 1000 cells). Strains: FRL60, FRL62, NE1085, and FRL12. (j) Co-localization of PcdA-sGFP and FtsZ-mCherry. Panels from left to right: membranes visualized using TMA-DPH (cyan); PcdA-sGFP (green); FtsZ-mCherry (magenta); overlay of membranes, PcdA-sGFP, and FtsZ-mCherry. Arrow indicates a representative PcdA-sGFP focus without colocalization of FtsZ-mCherry. Localization frequencies of PcdA-sGFP or FtsZ-mCherry alone, or colocalization of both proteins are indicated below. Strain FRL117. (k) Localization of FtsZ-mCherry in WT and ΔpcdA. First column: membranes visualized with TMA-DPH (cyan); second column: FtsZ-mCherry (magenta); third column: overlay of membrane and FtsZ-mCherry. Scale bars, 1 μm. Arrows indicate cells where FtsZ-mCherry signal is soluble and not forming rings. Strains: FRL115 and FRL116.
Figure 3.
Figure 3.. PcdA ATPase activity is necessary for its function and localization.
(a) Cellular area (μm2) of the indicated strains (n > 300). Bars indicate the median with interquartile range. Strains: JE2, FRL60, FRL14, FRL34 – 41. Statistical analysis: one-way ANOVA; **** indicates p < 0.0001. (b) Localization of PcdA-sGFP and variants. First row shows membranes in magenta stained with FM4–64; second row shows PcdA-sGFP in green; and third row shows overlay of the two previous images. Below, localization of PcdA was quantified as correct localization (constricting ring as septation occurs; fourth row), non-constricting ring (fifth row), mis-localized all over the membrane (sixth row), or soluble localization (seventh row). Percentage of each type of localization are indicated for each protein variant (n > 300). Strains: FRL28, FRL44 – 51. (c) Nucleotide hydrolysis rate of PcdA. 2.5 μM PcdA was incubated with increasing concentration of ATP, GTP, CTP, or UTP (0, 0.25, 0.5, 1, 2, and 4 mM). NTP hydrolysis was quantified by the release of inorganic phosphate. Errors: S.D. (n = 5 independent experiments). (d) ATP hydrolysis rate for wild type PcdA and PcdAT*. 2.5 μM each variant was incubated with increasing concentrations of ATP (0, 0.25, 0.5, 1, 2, and 4 mM). Errors: S.D. (n = 3 independent experiments). (e) Multimerization of PcdA and mutated variants studied by bacterial two hybrid. The interaction of the proteins produced by the T18 and T25 plasmids cloned in a cyaA deficient E. coli was measured as β-galactosidase activity in liquid cultures. The protein variant fused to the N-terminus of T18 and T25 is indicated. A pair of non-fused T18 or T25 together with their corresponding fusion protein was used as a control and the resulting activity from the control was used to subtract to the tested interaction. Bars represent mean; whiskers represent S.D. (n = 3 independent experiments).
Figure 4.
Figure 4.. PcdA interacts directly with FtsZ and DivIVA.
(a) Co-sedimentation of PcdA with polymerized FtsZ in vitro. 30 μM FtsZ was incubated in the presence or absence of 2 mM GMPCPP and 5 μM PcdA as indicated. FtsZ polymers were collected by high-speed ultracentrifugation. Presence of proteins in the supernatant (S) or pellet (P) was analyzed by SDS-PAGE and Coomassie staining. A representative image of three independent experiments is shown. The mean and standard deviation of the percentage of total FtsZ and PcdA in the pellet fraction is indicated below. (b) Interaction of PcdA with unpolymerized FtsZ depends on the presence of ATP. 30 μM FtsZ and/or 5 μM PcdA were incubated in the absence or presence of ATP as indicated. Protein mixture was then applied to a 100 kDa filter and centrifuged. Flowthrough (F) and resuspended retained protein (R) was analyzed by SDS-PAGE and Coomassie staining. The mean and standard deviation of the percentage of total FtsZ and PcdA in the retained fraction is indicated below. (c) Localization of PcdA and a variant with mutations in the predicted FtsZ-interacting residues. First column: fluorescence from sGFP variant (green); second column: membranes stained with FM4–64 (magenta); third column: overlay sGFP and membrane. To the right, localization of PcdA was quantified as correct localization (constricting ring as septation occurs; fourth column), non-constricting ring (fifth column), mis-localized all over the membrane (sixth column) or soluble localization (seventh column). Percentage of each type of localization are indicated for each protein variant (n > 400). Strains: FRL103 and FRL84. (d) Angle between consecutive division planes using cell wall staining with WGA-488 and membrane dye FM4–64. Bars represent median values with interquartile range (n > 100 cells). Strains: JE2, FRL60, FRL62, FRL83, FRL96, and FRL98. Statistical analysis: Kruskal-Wallis; **** indicates p < 0.0001. (e) Interaction of PcdA with other cell division proteins by bacterial two-hybrid. PcdA was fused to the N-terminus of T18 subunit and expressed together with the indicated staphylococcal cell division protein fused to the N-terminus of the T25 subunit. Interaction between PcdA-T18 and the T25-fused cell division protein led to detection of β-galactosidase activity. Known self-interaction between Spo0J was used as positive control. (f) Subcellular localization of DivIVA-sGFP in a representative (first row) pre-divisional, (second row) nascently dividing, or (third row) nearly completely divided S. aureus cell. First column: membranes visualized with FM4–64 (magenta); second column: DivIVA-sGFP (green); third column: overlay of membrane and DivIVA-sGFP. Scale bar, 1 μm. Strain FRL113. (g) Localization of PcdA-sGFP in (top row) WT and (bottom row) ΔdivIVA. First column: membranes visualized with FM-4–64 (magenta); second column: PcdA-sGFP (green); third column: overlay of membrane and PcdA-GFP. Percentage of each type of indicated localization pattern are shown to right (n > 300). Scale bars, 1 μm. Strains: FRL103 andFRL97. (h) Model for cell division plane selection in S. aureus. In pre-divisional cells, DivIVA (yellow) localizes indiscriminately in the membrane and PcdA (green) localizes to the future cell division plane, where it recruits FtsZ (blue). As the membrane invaginates, DivIVA localizes to the base of the nascent septum and PcdA follows the leading edge of the constricting septum. As cytokinesis completes, a population of DivIVA deploys to the poles of the slightly elongated cell, where it forms patches and recruits PcdA, which begins assembling as a ring defining the next division plane, orthogonal to the previous plane.
Figure 5.
Figure 5.. Deletion of pcdA impairs virulence and leads to increased sensitive to cell wall-targeting antibiotics.
(a) Quantification of abscesses 5- and 15- days post infection. Mice were inoculated with WT or ΔpcdA strain. Mice were sacrificed after 5 or 15 days and the number of abscesses present in the kidneys was determined. Number is plotted as the mean from 5 animals per group. (b-c) Histopathology of kidneys of mice inoculated with JE2 wild type (b-b’) and ΔpcdA (c-c’). Pathological section was stained with hematoxylin and eosin (H&E). B’ and C’ show a close-up image of the lesions that are traced by yellow dotted line. Black arrows point to S. aureus cells growing inside the lesion. (d) Percentage of lesions with or without bacteria in kidneys of mice inoculated with JE2 wild type or ΔpcdA. Statistical analysis: two-way Anova; ** indicates p < 0.01; *** indicates p < 0.001. (e) Minimal inhibitory concentrations (MIC) for JE2 wild type and ΔpcdA for different antibiotics that target the cell wall. MIC was determined in lawns of bacteria using MIC strips for the indicated antibiotic. Strains: JE2 and FRL60.

References

    1. Barrows J. M. & Goley E. D. FtsZ dynamics in bacterial division: What, how, and why? Curr Opin Cell Biol 68, 163–172, doi: 10.1016/j.ceb.2020.10.013 (2021). - DOI - PMC - PubMed
    1. Ramos-Leon F. & Ramamurthi K. S. Cytoskeletal proteins: lessons learned from bacteria. Phys Biol 19, doi: 10.1088/1478-3975/ac4ef0 (2022). - DOI - PubMed
    1. Mahone C. R. & Goley E. D. Bacterial cell division at a glance. J Cell Sci 133, doi: 10.1242/jcs.237057 (2020). - DOI - PMC - PubMed
    1. Lutkenhaus J. & Du S. E. coli Cell Cycle Machinery. Subcell Biochem 84, 27–65, doi: 10.1007/978-3-319-53047-5_2 (2017). - DOI - PubMed
    1. Errington J. & Wu L. J. Cell Cycle Machinery in Bacillus subtilis. Subcell Biochem 84, 67–101, doi: 10.1007/978-3-319-53047-5_3 (2017). - DOI - PMC - PubMed

Publication types