[Preprint]. 2023 Oct 16:rs.3.rs-2367368.
doi: 10.21203/rs.3.rs-2367368/v1.

Trans-Lesion Synthesis and Mismatch Repair Pathway Crosstalk Defines Chemoresistance and Hypermutation Mechanisms in Glioblastoma

Affiliations

Trans-Lesion Synthesis and Mismatch Repair Pathway Crosstalk Defines Chemoresistance and Hypermutation Mechanisms in Glioblastoma

Xing Cheng et al. Res Sq. .

Update in

Abstract

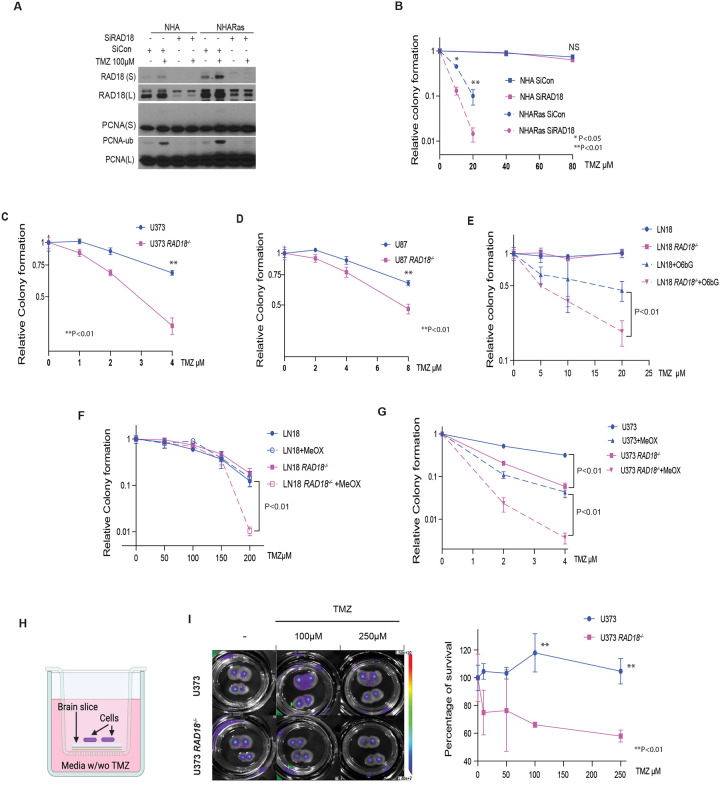
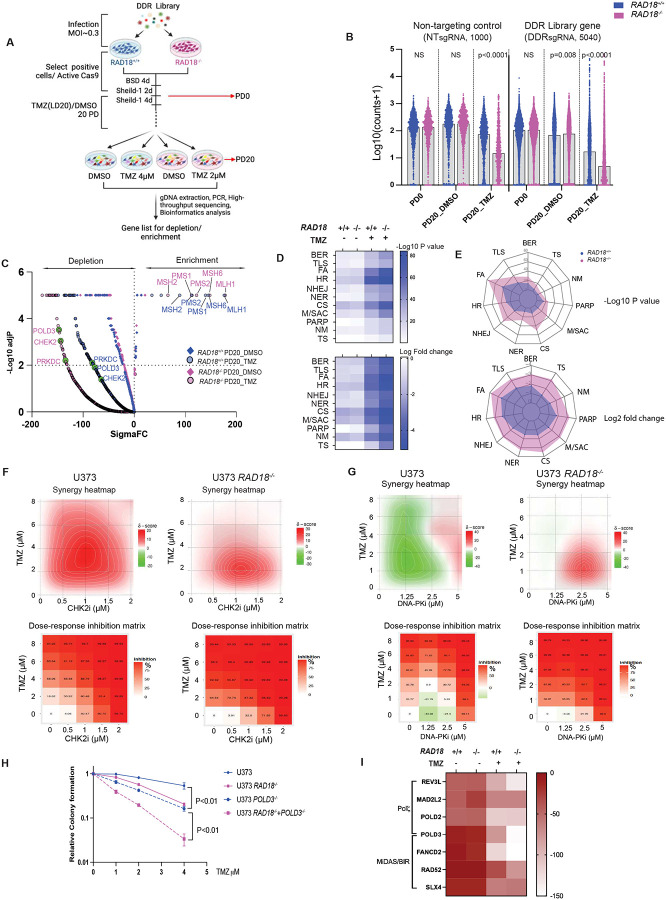
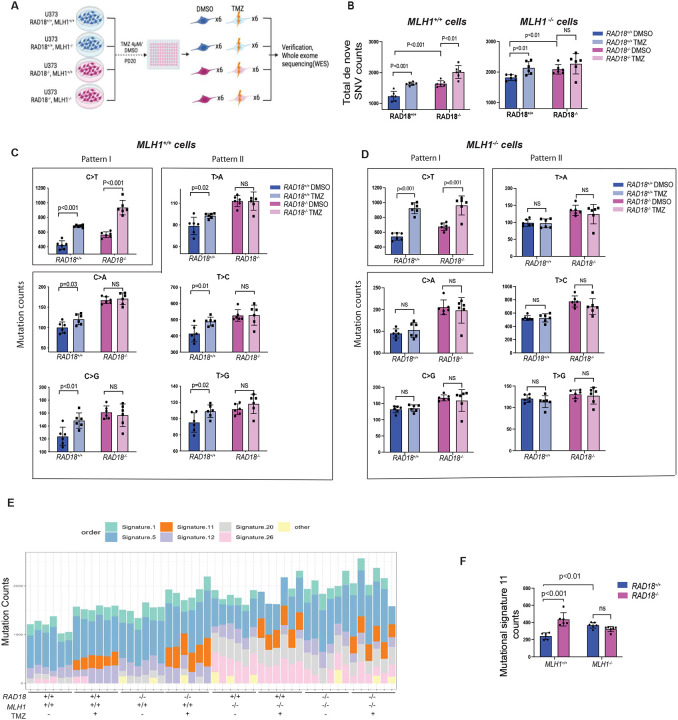
Almost all Glioblastoma (GBM) are either intrinsically resistant to the chemotherapeutical drug temozolomide (TMZ) or acquire therapy-induced mutations that cause chemoresistance and recurrence. The genome maintenance mechanisms responsible for GBM chemoresistance and hypermutation are unknown. We show that the E3 ubiquitin ligase RAD18 (a proximal regulator of TLS) is activated in a Mismatch repair (MMR)-dependent manner in TMZ-treated GBM cells, promoting post-replicative gap-filling and survival. An unbiased CRISPR screen provides a new aerial map of RAD18-interacting DNA damage response (DDR) pathways deployed by GBM to tolerate TMZ genotoxicity. Analysis of mutation signatures from TMZ-treated GBM reveals a role for RAD18 in error-free bypass of O6mG (the most toxic TMZ-induced lesion), and error-prone bypass of other TMZ-induced lesions. Our analyses of recurrent GBM patient samples establishes a correlation between low RAD18 expression and hypermutation. Taken together we define novel molecular underpinnings for the hallmark tumorigenic phenotypes of TMZ-treated GBM.


Conflict of interest statement

COMPETING INTERESTS DECLARATION B.M., S.H., and A.S. have submitted a provisional patent application based on the OBSC work in this manuscript

Figures

Figure 1.
Figure 1.. TMZ activates the RAD18 pathway in astrocytes and glioblastoma cells
(A-C) Immunoblot showing levels of mono-ubiquitinated PCNA and indicated DDR markers at different times after TMZ treatment in NHARas (A), U87 and U87 RAD18−/− cells (B), or U373 and U373 RAD18−/− cells (C). (D) Immunofluorescence microscopy images showing localization of CFP-RAD18 to nuclear foci in U373 cells after 48 h treatment with 50 μM TMZ; Green: CFP-RAD18, Red: RPA32 (coating ssDNA), Blue: DAPI (nucleus). Scale bars, 10μM. The bar charts show quantification of cells with CFP-RAD18 nuclear foci and RPA32-co-localizing nuclear foci. Data points represent mean ± SD; P values were determined by Tukey HSD test. (E) FACS analysis showing BrdU incorporation profiles in U373 cells transfected with siCon or siRAD18, followed by 50μM TMZ treatment for 0, 3, 24, 48 h. BrdU median intensities are shown for gated late S and G2M population of the 48 h treatment condition. (F) Immunoblots showing levels of mono-ubiquited PCNA and other DDR markers in LN18 and LN18 RAD18−/− cells after 200μM TMZ-treatment in presence or absence of 20μM O6BG (MGMT inhibitor). (G) Quantification of primary TMZ-induced lesions in LN18 and LN18 RAD18−/− cells following conditional O6BG treatment.
Figure 2.
Figure 2.. RAD18 promotes TMZ-tolerance in Astrocyte and GBM cell lines
(A) Immunoblot showing effect of 100μM TMZ treatment (24h) on PCNA mono-ubiquitination in NHA and NHARas cells transfected with siCon or siRAD18. (B) Effect of RAD18 knockdown on TMZ-sensitivity in NHA and NHARas cells (B). (C-D) Clonogenic survival assays showing TMZ-sensitivities of parental (RAD18+/+) and RAD18−/− U373 (C) and U87 cells (D). (E-F) Clonogenic survival assays showing TMZ-sensitivities of RAD18+/+ and RAD18−/− LN18 cells treated with or without 20μM O6bG (E) or 5mM MeOX (F). (G) Clonogenic survival assay TMZ-sensitivities of RAD18+/+ and RAD18−/− U373 cells treated with or without 10mM MeOX. (H-I) TMZ-sensitivity of RAD18+/+ and RAD18−/− U373 cells cultured on viable organo-type brain slice explants. The middle panel shows representative bioluminescence images of firefly luciferase-expressing U373 RAD18+/+ and RAD18−/− cells cultured on brain slices and treated with indicated concentrations of TMZ for 4 days. To measure TMZ-sensitivity, bioluminescence on day 4 post-TMZ treatment was normalized to day 0 for each treatment group (n=4). Data points represent mean ± SD of triplicate determinations; P values were determined by Tukey HSD test (B-G, I).
Figure 3.
Figure 3.. RAD18 promotes tolerance of MMR-dependent DNA damage in TMZ-treated GBM
(A) FACS analysis showing cell cycle profiles of RAD18+/+ and RAD18−/− U373 cells at different times post-treatment with 10μM TMZ. (B) Cell cycle distribution of RAD18+/+ and RAD18−/− U373 cells after treatment with 10 μM TMZ for 48h. Cells in G2+M or M-phase were enumerated based on staining with mitosin and phospho-histone H3 respectively. (C) FACS analysis of gH2AX and pRPA32s33 in WT, RAD18−/−, MLH1−/− and RAD18−/−MLH1−/− U373 cells after a 48h treatment with TMZ. In the upper panel, the gated cell populations highlighted in red represent the pRPA32s33/gH2AX double-positive cells with 10μM TMZ in U373 WT cells. The lower panel shows quantification of pRPA32s33/gH2AX double-positive cells in different genotypes after a 48h treatment with 2 μM TMZ. NS, no significance. (D) Uniform Manifold Approximation and Projection (UMAP) scatterplots derived from scRNASeq analysis of GBM cells in patient samples. The UMAP plots show clustering of individual cells based on RAD18 expression (left) and cell cycle phase (right). (E) Immunoblot showing levels of PCNA mono-ubiquitination and other DDR markers in WT, RAD18−/−, MLH1−/−, and RAD18−/−MLH1−/− U373 cells treatment with 10μM TMZ. (F) Clonogenic survival assays showing TMZ-sensitivities of WT, RAD18−/−, MLH1−/−, and RAD18−/−MLH1−/− U373 cells following a single treatment with different doses of TMZ. (G) Immunoblot of PCNA mono-ubiquitination (lower panel) in U373 cells transfected with siCon, siRAD18, siMSH2 or siRAD8+MSH2, and treated conditionally with 20 μM TMZ. (H) Immunoblot showing levels of mono-ubiquitinated PCNA and indicated DDR proteins in RAD18+/+ and Rad18−/− LN18 cells after treatment with 100μM TMZ for the indicated times. (I) Immunoblot showing levels of TMZ-induced PCNA mono-ubiquitination in U373 cells transfected with siCon or siEXO1. All data points represent mean ± SD; P values were determined by unpaired t test (B,C) and Tukey test (F).
Figure 4.
Figure 4.. RAD18-dependent TMZ-tolerance is mediated by Polκ
(A) Schematic of TLS DNA polymerase recruited by RAD18 involved in ssDNA gap filling generated by futile MMR cycle. (B) Clonogenic survival assays showing effects of siPOLK, siPOLH, siPOLI, or JH-RE-06 treatments on TMZ-sensitivity of U373 cells. (C) Quantification of TMZ-induced GPF-Polκ foci in U373 RAD18−/− (left) and U373 MLH1−/− cells (middle). The right panel shows representative images of GFP-POLK foci in U373 and U373 RAD18−/− cells treated with or without 20μM TMZ for 48h; Scale bars, 10μm. (C) Clonogenic survival assay showing TMZ-sensitivities of WT, RAD18−/−, POLK−/− and RAD18−/−POLK−/− U373 cells. Cells were treated with a single dose of TMZ daily for 5 days. (D) Quantification of TMZ-induced YFP-Polη foci in RAD18+/+ and RAD18−/− U373 cells. The right panels show representative images of cells containing YFP-POLH foci; Scale bars, 10 μm. (E) Clonogenic survival assays showing effect of POLK or POLH siRNAs on TMZ-sensitivity of RAD18+/+ and RAD18−/− U373 cells. Cells were treated with the indicated doses of TMZ twice daily for 2 days. (F) Immunofluorescence microscopy images showing distribution of GFP-Polκ and PCNA in U373 transfected with siCon, siPOLH and siRAD18, followed by 50μM TMZ treatment for 48h; Red: PCNA, Green: GFP-Polκ, Blue: (DAPI); Scale bars, 8 μm. The bar chart shows quantification of foci containing co-localized GFP-Polκ and PCNA. All data points represent the mean ± SD of triplicate determinations; P values were determined by Tukey HSD test.
Figure 5.
Figure 5.. Results of CRISPR screen for RAD18-interacting DDR genes
(A) Workflow of genetic screen. (B) Normalized counts (Log10) of sgRNAs targeting DDR genes and non-targeting control across indicated samples in RAD18+/+ (Blue) and RAD18−/− (purple) U373 cells. (C) Volcano plot showing Gene Abundance Change Scores (Sigma FC) vs −Log10 adjusted p-value for sgRNA depletion or enrichment in PD20 groups when compared with PD0. The −Log10 p-value was calculated using a permutation test for DDR gene-targeting sgRNAs relative to non-targeting control sgRNAs. Black dashed lines indicate thresholds for statistical significance. Enriched sgRNAs targeting MMR genes, and depleted sgRNAs targeting POLD3, CHEK2 and PRKDC are highlighted. (D) Heatmap showing relative dropout of sgRNAs grouped by DDR pathway in RAD18+/+ and RAD18−/− cells cultured with or without TMZ for 20 PD. The numbers on the scale indicate −Log10 of paired t-test p value (up) and Log2 fold change (down) of pooled sgRNA counts. BER: Base excision repair; TLS: Trans-lesion DNA synthesis; FA: Fanconi Anemia; HR: Homologous recombination; NHEJ: Non-homologous end joining; NER: Nucleotide excision repair; CS: Checkpoint signaling; M/ASC: Mitosis/spindle assembly checkpoint; PARP: Poly ADP ribose polymerases; NM: Nucleotide metabolism; TS: Template switch (E) Radar plot showing relative dropout (up: p value; down: Log2 fold change) of sgRNAs in DDR pathway between TMZ and DMSO control at PD20 in RAD18+/+ and RAD18−/− cells. (F-G) Dose response matrices and synergy heatmaps showing effects of pairwise combinations of TMZ with CHK2i (E) or DNA-PKi (F) on inhibition of viability in RAD18+/+ and RAD18−/− cells. (H) Clonogenic survival assays showing TMZ-sensitivity of WT, RAD18−/−, POLD3−/−, and RAD18−/− POLD3−/− U373 cells. Cultures received a single treatment with TMZ daily for 5 days. (I) Heatmap showing sigmaFC of sgRNAs targeting Polζ complex genes and MIDAS/BIR pathway genes. Data are representative of three independent experiments. All data points represent mean ± SD; P values were determined by multiple unpaired t test (B) and Tukey HSD test (G).
Figure 6.
Figure 6.. Effect of RAD18 on TMZ-induced mutagenesis
(A) Experimental workflow of experiments to define impact of RAD18 and MMR on TMZ-induced mutagenesis. (B) Bar charts showing numbers of total SNV arising de novo following TMZ treatment over the course of 20 PD in cell lines differing with respect to RAD18 and MMR status. NS, not significant. (C-D) Bar charts showing numbers of each individual SNV arising de novo following TMZ treatment over 20 PD in MLH1+/+ (C) and MHL1−/− (D) cells. Pattern I (O6mG-induced) and Pattern II (N3mA- and N7mG-induced) SNVs are indicated; NS, no significance. (E) Stacked bar-chart showing contribution of individual COSMIC mutation signatures to the overall mutational patterns of U373 clones obtained from different treatment groups. (F) Bar chart showing effect of RAD18 and MLH1 status on mutational Signature 11 counts in clones of TMZ-treated U373 cells. NS, no significance. All data points represent mean ± SD; P values were determined by multiple unpaired t test (B-D, F).
Figure 7.
Figure 7.. RAD18 suppresses hypermutation in recurrent GBM patient
(A) Scatterplot showing contribution of Signature 11 mutations to individual tumors from a cohort of TMZ-treated recurrent GBM (rGBM) patients. Tumor samples were stratified by MGMT status and RAD18 expression. RAD18 relative expression was corrected for proliferation and was designated high (upper tertile), medium, or low (lower tertile). Based on accepted convention, tumors harboring >500 signature 11 counts (indicated by the black dashed line) were considered ‘hypermutation’. (B) Model describing roles of RAD18, MMR and MGMT in Hypermutation.

References

    1. Chinot O. L. et al. Bevacizumab plus radiotherapy-temozolomide for newly diagnosed glioblastoma. The New England journal of medicine 370, 709–722, doi:10.1056/NEJMoa1308345 (2014). - DOI - PubMed
    1. Johnson D. R. & O’Neill B. P. Glioblastoma survival in the United States before and during the temozolomide era. J Neurooncol 107, 359–364, doi:10.1007/s11060-011-0749-4 (2012). - DOI - PubMed
    1. Newlands E. S., Stevens M. F., Wedge S. R., Wheelhouse R. T. & Brock C. Temozolomide: a review of its discovery, chemical properties, pre-clinical development and clinical trials. Cancer treatment reviews 23, 35–61, doi:10.1016/s0305-7372(97)90019-0 (1997). - DOI - PubMed
    1. Dianov G. L., Sleeth K. M., Dianova II & Allinson S. L. Repair of abasic sites in DNA. Mutat Res 531, 157–163, doi:10.1016/j.mrfmmm.2003.09.003 (2003). - DOI - PubMed
    1. Margison G. P., Santibanez Koref M. F. & Povey A. C. Mechanisms of carcinogenicity/chemotherapy by O6-methylguanine. Mutagenesis 17, 483–487, doi:10.1093/mutage/17.6.483 (2002). - DOI - PubMed

Publication types