. 2023 Dec 5;148(23):1870-1886.
doi: 10.1161/CIRCULATIONAHA.123.064332. Epub 2023 Oct 27.

MDM2 Regulation of HIF Signaling Causes Microvascular Dysfunction in Hypertrophic Cardiomyopathy

Affiliations

MDM2 Regulation of HIF Signaling Causes Microvascular Dysfunction in Hypertrophic Cardiomyopathy

Puneeth Shridhar et al. Circulation. .

Abstract

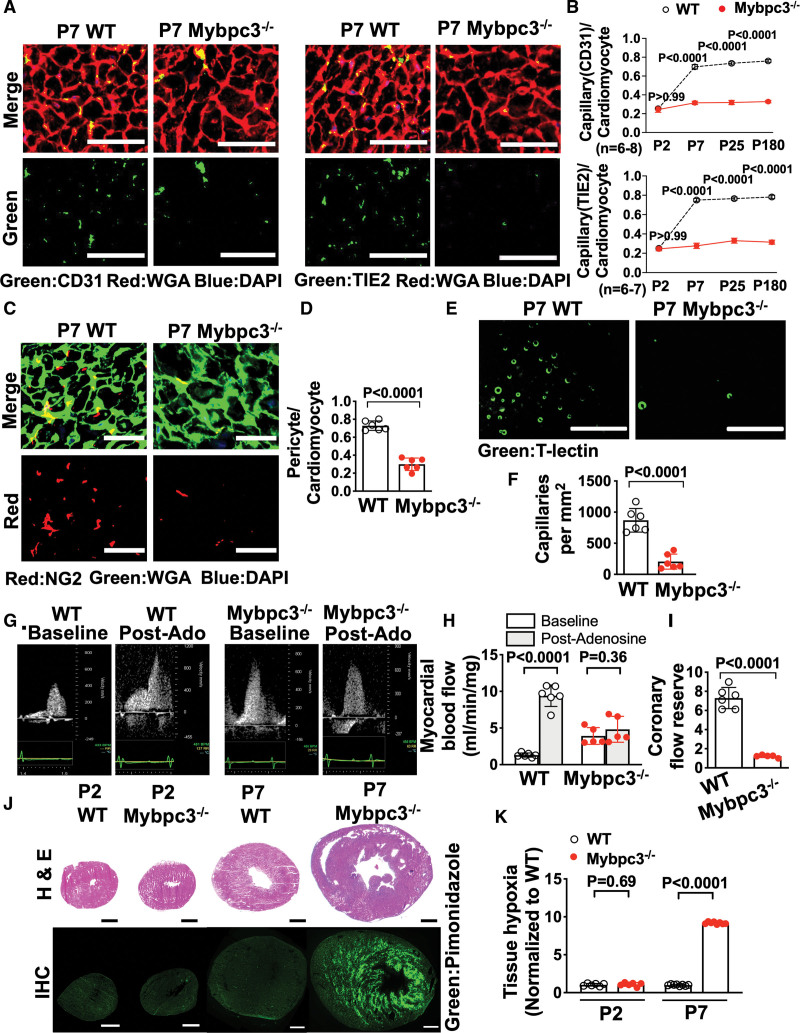
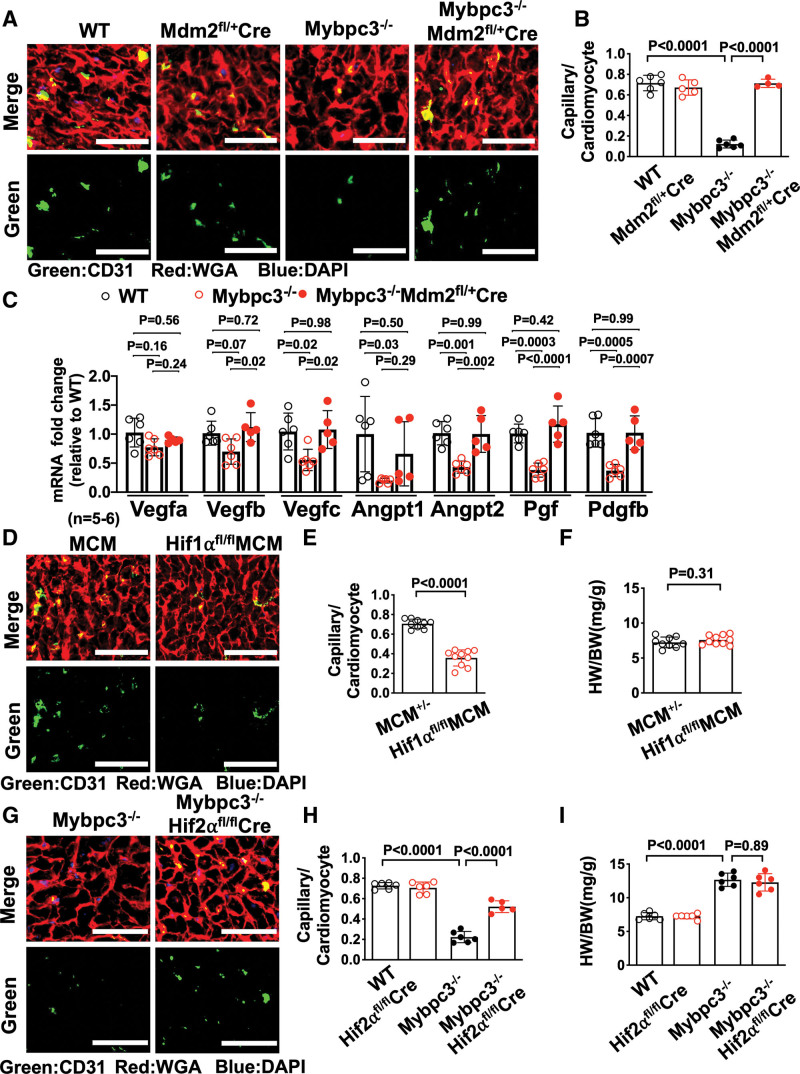
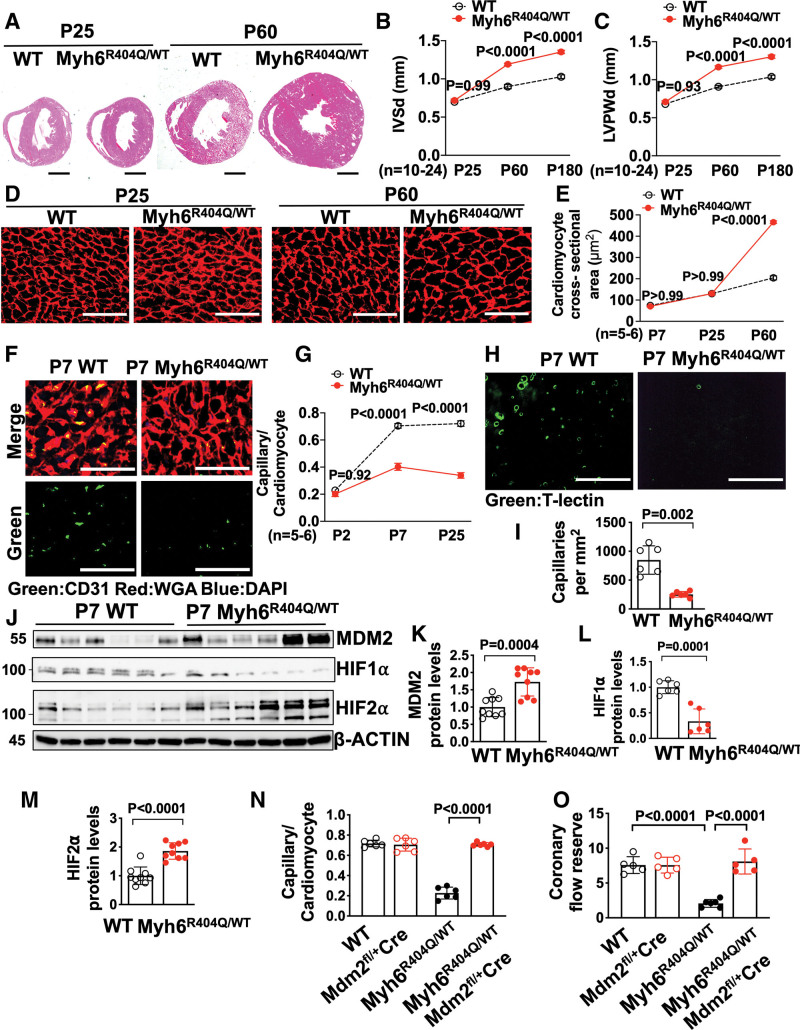
Background: Microvasculature dysfunction is a common finding in pathologic remodeling of the heart and is thought to play an important role in the pathogenesis of hypertrophic cardiomyopathy (HCM), a disease caused by sarcomere gene mutations. We hypothesized that microvascular dysfunction in HCM was secondary to abnormal microvascular growth and could occur independent of ventricular hypertrophy.

Methods: We used multimodality imaging methods to track the temporality of microvascular dysfunction in HCM mouse models harboring mutations in the sarcomere genes Mybpc3 (cardiac myosin binding protein C3) or Myh6 (myosin heavy chain 6). We performed complementary molecular methods to assess protein quantity, interactions, and post-translational modifications to identify mechanisms regulating this response. We manipulated select molecular pathways in vivo using both genetic and pharmacological methods to validate these mechanisms.

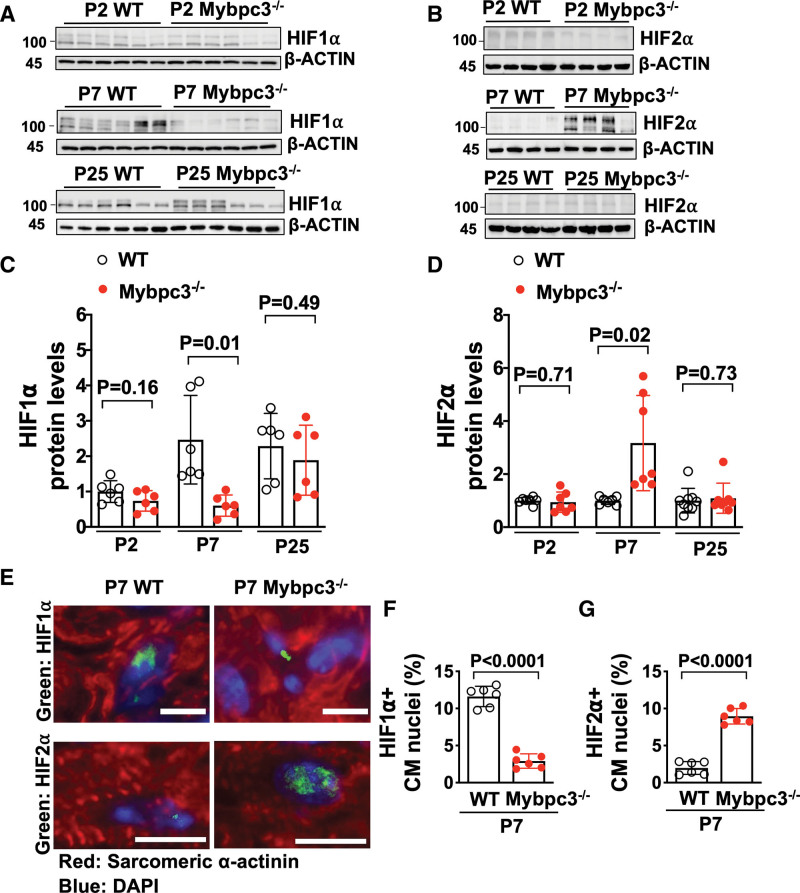
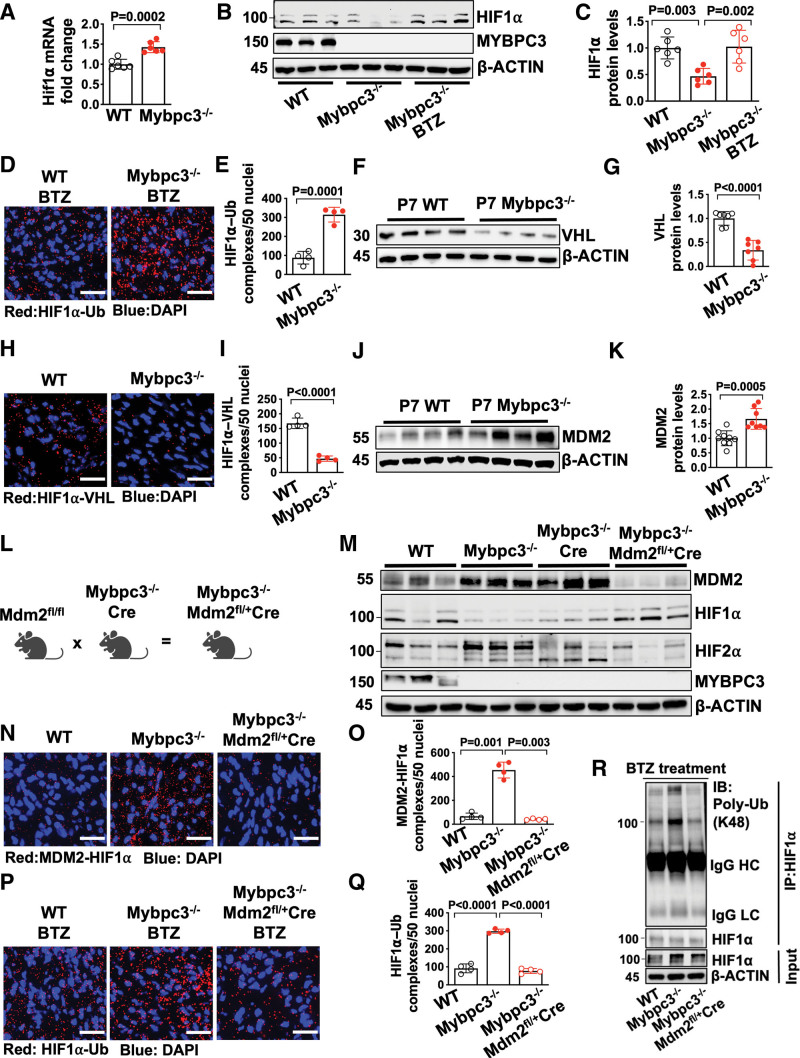
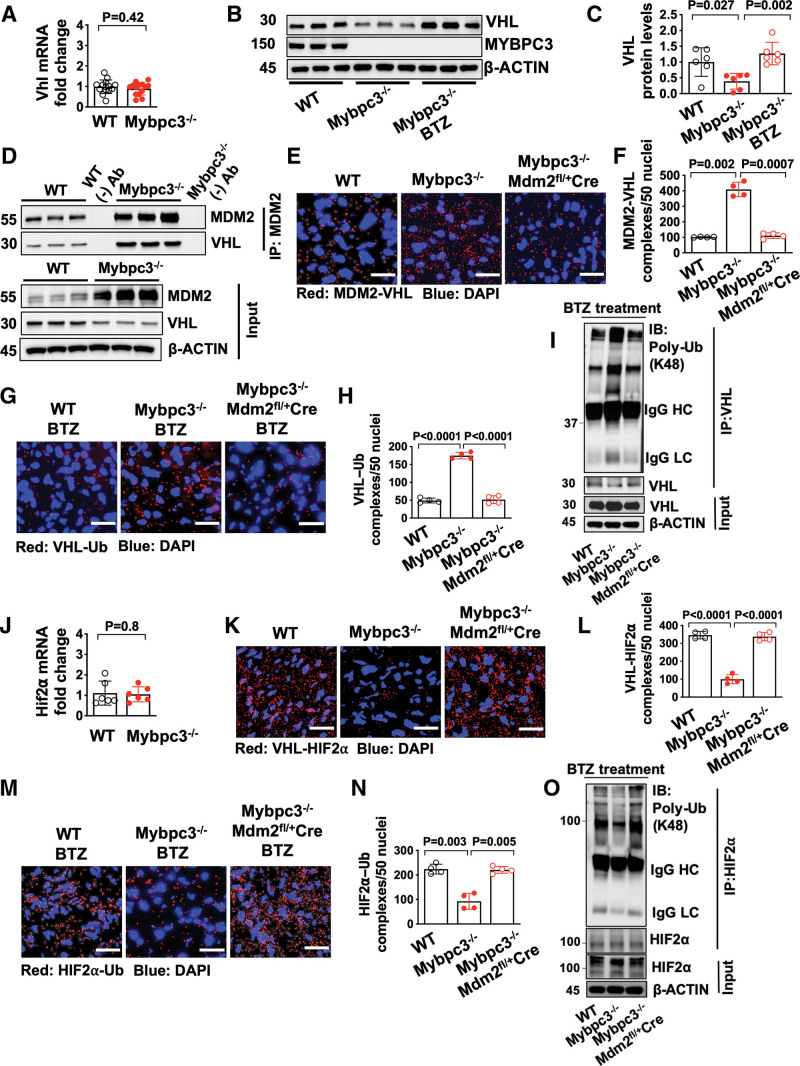
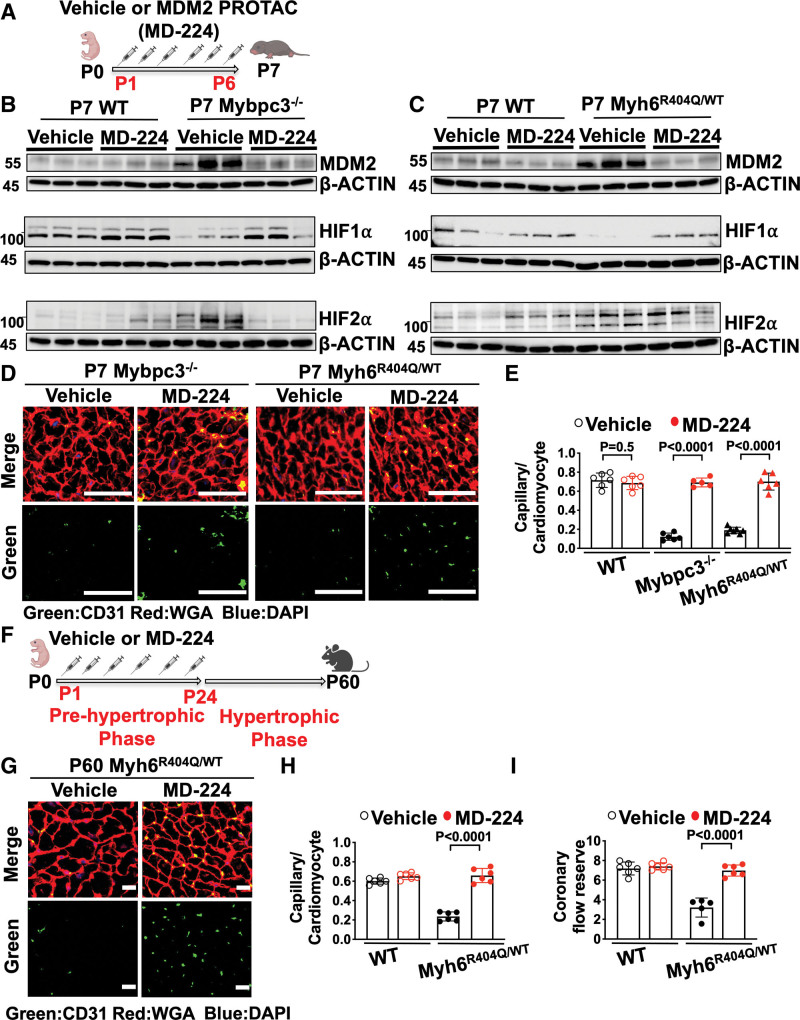
Results: We found that microvascular dysfunction in our HCM models occurred secondary to reduced myocardial capillary growth during the early postnatal time period and could occur before the onset of myocardial hypertrophy. We discovered that the E3 ubiquitin protein ligase MDM2 (murine double minute 2) dynamically regulates the protein stability of both HIF1α (hypoxia-inducible factor 1 alpha) and HIF2α (hypoxia-inducible factor 2 alpha)/EPAS1 (endothelial PAS domain protein 1) through canonical and noncanonical mechanisms. The resulting HIF imbalance leads to reduced proangiogenic gene expression during a key period of myocardial capillary growth. Reducing MDM2 protein levels by genetic or pharmacological methods normalized HIF protein levels and prevented the development of microvascular dysfunction in both HCM models.

Conclusions: Our results show that sarcomere mutations induce cardiomyocyte MDM2 signaling during the earliest stages of disease, and this leads to long-term changes in the myocardial microenvironment.

Keywords: capillaries; cardiomyopathy, hypertrophic; hypoxia; myocardium; myosin heavy chains; proteasome endopeptidase complex; sarcomere.


Conflict of interest statement

Disclosures None.

Figures

Figure 1.
Figure 1.
Reduced postnatal capillary formation in the Mybpc3-/- myocardium is associated with microvascular dysfunction and tissue hypoxia. A, Representative immunohistochemistry images for the endothelial cell markers CD31 (left; green) or TIE2 (right; green) costained with WGA (red) in left ventricular tissue cross-sections from postnatal day 7 (P7) WT and Mybpc3−/− mice. Nuclei are blue (DAPI); scale bars=25 μm. B, Capillary-to-cardiomyocyte ratios from WT and Mybpc3−/− (n=6–8/group) left ventricular tissue at postnatal day 2 (P2), P7, postnatal day 25 (P25), or postnatal day 180 (P180). Capillaries were identified with CD31 (top) or TIE2 (bottom). Minimum 120 cardiomyocytes per sample. C, Representative immunohistochemistry images for the pericyte marker NG2 ([neural/glial antigen 2] red) costained with WGA (green) in left ventricular tissue from P7 WT and Mybpc3−/− mice. Nuclei are blue (DAPI); scale bars=25 μm. D, Pericyte-to-cardiomyocyte ratios from WT (n=6) and Mybpc3−/− (n=6) left ventricular tissue at P7. Minimum 200 cardiomyocytes per sample. E, Representative fluorescence images for the intravascularly injected endothelial cell stain, tomato lectin ([T-lectin] green) in left ventricular tissue from P7 WT and Mybpc3−/− mice. Scale bars=80 μm. F, Capillaries per mm2 in WT (n=6) and Mybpc3−/− (n=6) left ventricular tissue at P7. Three cross-sectional images per sample were analyzed. G, Representative myocardial blood flow velocity tracings using pulsed wave Doppler echocardiography in postnatal day 60 WT and Mybpc3−/− mice. Myocardial blood flow at baseline and after retro-orbital injection with adenosine (postadenosine) to induce maximal hyperemia. H, Myocardial blood flow in postnatal day 60 WT after adenosine (light grey bars) were normalized to heart weight. I, Coronary flow reserve in postnatal day 60 WT (n=6) and Mybpc3−/− (n=5) mice. Coronary flow reserve is the ratio of myocardial blood flow after adenosine to myocardial blood flow at baseline. J, Representative H&E–stained heart cross-sections from P2 or P7 WT and Mybpc3−/− mice (top) and representative immunohistochemistry images of heart cross-sections from P2 or P7 WT and Mybpc3−/− mice injected with pimonidazole ([Hypoxyprobe] green; bottom). Scale bars=0.5 mm. K, Comparison of left ventricular tissue hypoxia in WT and Mybpc3−/− mice at P2 or P7 (n=6–8/group). Green fluorescent intensity for each sample was obtained and then normalized to P2 WT samples. All results are shown as mean±SEM. Student or Welch t tests were used for D, F, H, I, and K; 2-way ANOVA with Tukey multiple comparison test used for B. CD31 indicates cluster of differentiation 31; DAPI, 4′,6-diamidino-2-phenylindole; H&E, hematoxylin–eosin; IHC, immunohistochemistry; Mybpc3-/-, cardiac myosin binding protein 3 homozygous deletion; Post-Ado, post adenosine; TIE2, TEK receptor kinase; WGA, wheat germ agglutinin; and WT, wild-type.
Figure 2.
Figure 2.
Dynamic changes in HIF1α and HIF2α occur during the early postnatal period in the Mybpc3-/- myocardium. Immunoblots for HIF1α (A) and HIF2α (B) in left ventricular tissue lysates from WT and Mybpc3−/− mice at postnatal day 2 (P2), postnatal day 7 (P7), or postnatal day 25 (P25). C, HIF1α protein quantification from WT (n=6) and Mybpc3−/− (n=6) left ventricular tissue lysates from P2, P7, or P25 mice normalized to β-actin protein expression and relative to postnatal day 2 WT mice. D, HIF2α protein quantification from WT (n=7–9) and Mybpc3−/− (n=7–8) left ventricular tissue from postnatal days 2, 7, or 25 mice normalized to β-actin and relative to postnatal day 2 WT mice. E, Representative immunohistochemistry images for HIF1α (top; green) and HIF2α (bottom; green) costained with sarcomeric α-actinin (red), in left ventricular tissue from postnatal day 7 WT and Mybpc3−/− mice. Nuclei are blue (DAPI); scale bars=5 um (HIF1) or 10 μm (HIF2). F, HIF1α-positive CM nuclei (% of total nuclei) in left ventricular tissue from postnatal day 7 WT (n=6) and Mybpc3−/− (n=6) mice. Minimum 100 nuclei per sample. G, HIF2α-positive CM nuclei (% of total nuclei) in left ventricular tissue from postnatal day 7 WT (n=6) and Mybpc3−/− (n=6) mice. Minimum 100 nuclei per sample. All results are shown as mean±SEM; Student or Welch t test were used for C, D, F, and G. CM indicates cardiomyocyte; DAPI, 4′,6-diamidino-2-phenylindole; HIF1α, hypoxia-inducible factor 1 alpha; HIF2α, hypoxia-inducible factor 2 alpha; Mybpc3-/-, cardiac myosin binding protein 3 homozygous deletion; and WT, wild-type.
Figure 3.
Figure 3.
The noncanonical degradation of HIF1α in the Mybpc3-/- myocardium is regulated by cardiomyocyte MDM2. A, Hif1α gene expression in left ventricular tissue RNA from postnatal day 7 (P7) WT (n=6) and Mybpc3−/− (n=6) mice. Hif1α gene expression was normalized to Rpl32 and fold change relative to WT. B and C, Immunoblots and protein quantification for HIF1α in left ventricular tissue lysates from P7 WT (n=6), Mybpc3−/− (n=6), and BTZ-injected Mybpc3−/− (n=6) mice normalized to β-actin and relative to WT. D and E, Representative in situ proximity ligation assay images and quantification for Ub-modified HIF1α in left ventricular tissue from BTZ injected P7 WT (n=4) and Mybpc3−/− (n=4) mice. HIF1α–Ub complexes are red and nuclei are blue (DAPI). Three nonoverlapping left ventricular images per sample; scale bars=25 μm. F and G, Immunoblot and quantification for VHL in left ventricular tissue lysate from P7 WT (n=7) and Mybpc3−/− (n=7) mice normalized to beta-actin and relative to WT. H and I, Representative in situ proximity ligation assay images and quantification for HIF1α and VHL protein complexes in left ventricular tissue from P7 WT (n=4) and Mybpc3−/− (n=4) mice. HIF1α–VHL complexes are shown in red and nuclei are blue (DAPI); 3 nonoverlapping left ventricular images per sample; scale bars=25 μm. J and K, Immunoblot and quantification for MDM2 in left ventricular tissue from P7 WT (n=9) and Mybpc3−/− (n=8) mice normalized to β-actin and relative to WT. L, Schematic of cardiomyocyte selective reduction of MDM2 in Mybpc3-/- mice generated by crossing Mdm2fl/fl, Mybpc3-/-, and Myh6:Cre mouse lines to create Mybpc3−/−Mdm2fl/+/Myh6:Cre. M, Immunoblot for MDM2, HIF1α, HIF2α, MYPBC3, and β-actin in left ventricular tissue from P7 WT, Mybpc3−/−, Mybpc3-/-/Myh6:Cre, and Mybpc3−/−Mdm2fl/+/Myh6:Cre mice. N and O, Representative in situ proximity ligation assay images and quantification for MDM2 and HIF1α protein complexes in left ventricular tissue from P7 WT (n=4), Mybpc3−/− (n=4), and Mybpc3−/−Mdm2fl/+/Myh6:Cre (n=4) mice. MDM2–HIF1α complexes are shown in red and nuclei are blue (DAPI). Three nonoverlapping left ventricular images per sample; scale bars=25 μm. P and Q, Representative in situ proximity ligation assay images and quantification for Ub-modified HIF1α in left ventricular tissue from BTZ-injected P7 WT (n=4), Mybpc3−/− (n=4), and Mybpc3−/−Mdm2fl/+/Myh6:Cre (n=4) mice. HIF1α–Ub complexes are red and nuclei are blue (DAPI). Three nonoverlapping left ventricular images per sample; scale bars=25 μm. R, Immunoprecipitation (IP) for HIF1α was performed on left ventricular tissue lysates from BTZ-injected P7 WT, Mybpc3−/− and Mybpc3−/−Mdm2fl/+/Myh6:Cre mice and then immunoblots were performed for K48-linked Ub and HIF1α. The input left ventricular tissue lysates also underwent immunoblotting for HIF1α and β-actin. All results are shown as mean±SEM. Student t test was used for A, E, G, I, and K; 1-way ANOVA with Tukey or Dunnett T3 multiple comparison test were used for C, O, and Q. BTZ indicates bortezomib; DAPI, 4′,6-diamidino-2-phenylindole; HC, heavy chain; HIF1α, hypoxia-inducible factor 1 alpha; HIF2α, hypoxia-inducible factor 2 alpha; IB, immunoblot; LC, light chain; MDM2, murine double minute 2; Mdm2fl/+, Mdm2 heterozygous floxed; Mybpc3-/-, cardiac myosin binding protein 3 homozygous deletion; Myh6:Cre, myosin heavy chain 6:Cre recombinase; Poly-Ub, K48-linked ubiquitin; Rpl32; ribosomal protein L32; Ub, Ubiquitin; VHL, Von Hippel-Lindau; and WT, wild-type.
Figure 4.
Figure 4.
Increased HIF2α in the Mybpc3-/- myocardium occurs secondary to MDM2 facilitated degradation of VHL. A, Vhlgene expression in left ventricular tissue RNA from postnatal day 7 (P7) WT (n=14) and Mybpc3−/− (n=14) mice. Vhl gene expression was normalized to Rpl32 expression and fold-change is relative to WT. B and C, Immunoblots and protein quantification for VHL in left ventricular tissue from P7 WT (n=6), Mybpc3−/− (n=6) and BTZ-injected Mybpc3−/− (n=6) mice normalized to β-actin and relative to WT. D, Coimmunoprecipitation for MDM2 was performed in left ventricular tissue lysates from P7 WT and Mybpc3−/− mice and then immunoblots were performed for VHL and MDM2. The third WT sample (WT(-)Ab) and the third Mybpc3−/− sample (Mybpc3−/− (-) Ab) also underwent bead only precipitation without the MDM2 antibody as a negative control experiment (WT (-) Ab and Mybpc3-/- (-) Ab). The input left ventricular tissue lysates also underwent immunoblotting for MDM2, VHL, and β-actin. E and F, Representative in situ proximity ligation assay images and quantification for MDM2 and VHL protein complexes in left ventricular tissue from P7 WT (n=4), Mybpc3−/− (n=4), and Mybpc3−/−Mdm2fl/+/Myh6:Cre (n=4) mice. MDM2–VHL complexes are red and nuclei are blue (DAPI). Three nonoverlapping left ventricular images per sample; scale bars=25 μm. G and H, Representative in situ proximity ligation assay images and quantification for Ub-modified VHL in left ventricular tissue from BTZ-treated P7 WT (n=4), Mybpc3−/− (n=4), and Mybpc3−/−Mdm2fl/+/Myh6:Cre (n=4) mice. VHL–Ub complexes are red and nuclei are blue (DAPI). Three nonoverlapping left ventricular images per sample; scale bars=25 μm. I, Immunoprecipitation (IP) for VHL was performed on left ventricular tissue lysates from BTZ-injected P7 WT, Mybpc3−/−, and Mybpc3−/−Mdm2fl/+/Myh6:Cre mice and then immunoblots were performed Poly-Ub and VHL. The input left ventricular tissue lysates also underwent immunoblotting for VHL and β-actin. J, Hif2α gene expression in left ventricular tissue RNA from P7 WT (n=6) and Mybpc3−/− (n=6) mice. Hif2α gene expression was normalized to Rpl32 and fold change is relative to WT. K and L, Representative in situ proximity ligation assay images for VHL and HIF2α protein complexes in left ventricular tissue from P7 WT (n=4), Mybpc3−/− (n=4), and Mybpc3−/−Mdm2fl/+/Myh6:Cre (n=4) mice. VHL–HIF2α complexes are red and nuclei are blue (DAPI). Three nonoverlapping left ventricular images per sample; scale bars=25 μm. M and N, Representative in situ proximity ligation assay images and quantification for Ub-modified HIF2α in left ventricular tissue from BTZ-injected P7 WT (n=4), Mybpc3−/− (n=4), and Mybpc3−/−Mdm2fl/+/Myh6:Cre (n=4) mice. HIF2α–Ub complexes are red and nuclei are blue (DAPI). Three nonoverlapping left ventricular images per sample; scale bars=25 μm. O, IP for HIF2α was performed on left ventricular tissue lysates from BTZ-injected P7 WT, Mybpc3−/−, and Mybpc3−/−Mdm2fl/+/Myh6:Cre mice, and then immunoblots for Poly–Ub and HIF2α. The input left ventricular tissue lysates also underwent immunoblotting for HIF2α and β-actin. All results are shown as mean±SEM. Student t test was used for A and J; 1-way ANOVA with Tukey or Dunnett T3 multiple comparison test were used for C, F, H, L, and N. BTZ indicates bortezomib; DAPI, 4′,6-diamidino-2-phenylindole; HC, heavy chain; HIF1α, hypoxia-inducible factor 1 alpha; HIF2α, hypoxia-inducible factor 2 alpha; IB, immunoblot; LC, light chain; MDM2, murine double minute 2; Mdm2fl/+, Mdm2 heterozygous floxed; Mybpc3-/-, cardiac myosin binding protein 3 homozygous deletion; Myh6:Cre, myosin heavy chain 6:Cre recombinase; Poly-Ub, K48-linked ubiquitin; Ub, Ubiquitin; VHL, Von Hippel-Lindau; and WT, wild-type.
Figure 5.
Figure 5.
Reduction of cardiomyocyte MDM2 in Mybpc3-/- mice increases myocardial capillary formation and proangiogenic gene expression. A, Representative immunohistochemistry images for CD31 (green) costained with WGA (red) in left ventricular tissue from postnatal day 7 (P7) WT, Mdm2fl/+/Myh6:Cre, Mybpc3−/−, and Mybpc3−/−Mdm2fl/+/Myh6:Cre mice. Nuclei are blue (DAPI); scale bars=30 μm. B, Capillary-to-cardiomyocyte ratios in left ventricular tissue from P7 WT (n=6), Mdm2fl/+/Myh6:Cre (n=5), Mybpc3−/− (n=6), and Mybpc3−/− Mdm2fl/+/Myh6:Cre (n=4) mice. Minimum 100 cardiomyocytes per sample. C, Proangiogenic gene expression (eg, Vegfa, Vegfb, Vegfc [vascular endothelial growth factor a/b/c], Angpt1, Angpt2 [angiopoietin 1/2], Pgf [placental growth factor], Pdgfb [platelet-derived growth factor subunit b]) in left ventricular tissue RNA from P7 WT (n=6), Mybpc3−/− (n=6), and Mybpc3−/− Mdm2fl/+/Myh6:Cre (n=5) mice. The genes of interest were normalized to Rpl32 (ribosomal protein L32) and fold changes are relative to WT. D, Representative immunohistochemistry images for CD31 (green) costained with WGA (red) in left ventricular tissue from P7 Myh6:MerCreMer (MCM) and Hif1αfl/flMCM mice injected with tamoxifen at postnatal days 1 (P1) and 4 (P4). Nuclei are blue (DAPI); scale bars=50 μm. E, Capillary-to-cardiomyocyte ratios in left ventricular tissue from P7 MCM (n=9) and Hif1αfl/flMCM (n=10) injected with tamoxifen at P1 and P4. Minimum 200 cardiomyocytes per sample. F, Heart weight (mg)–to–body weight (g) ratios (HW/BW) from P7 MCM (n=9) and Hif1αfl/fl MCM (n=10) mice injected with tamoxifen at P1 and P4. G, Representative immunohistochemistry images for CD31 (green) costained with WGA (red) in left ventricular tissue from P7 Mybpc3−/− and Mybpc3−/−Hif2αfl/fl/Myh6:Cre mice. Nuclei are blue (DAPI). Scale bars=50 μm. H, Capillary-to-cardiomyocyte ratios in left ventricular tissue from P7 WT (n=6), Hif2αfl/fl/Myh6:Cre (n=6), Mybpc3−/− (n=6), and Mybpc3−/−Hif2αfl/fl/Myh6:Cre (n=5) mice. Minimum 200 cardiomyocytes per sample. I, HW/BW from P7 WT (n=6), Hif2αfl/fl/Myh6:Cre (n=6), Mybpc3−/− (n=6), and Mybpc3−/−Hif2αfl/fl/Myh6:Cre (n=6) mice. All results are shown as mean±SEM. Student t test used for E and F; 1-way ANOVA with Tukey or Dunnett T3 multiple comparison test used for C; 2-way ANOVA with Tukey multiple comparison test used for B, H, and I. CD31 indicates cluster of differentiation 31; DAPI, 4′,6-diamidino-2-phenylindole; HIF1α, hypoxia-inducible factor 1 alpha; HIF2α, hypoxia-inducible factor 2 alpha; Hif2αfl/fl, Hif2α homozygous floxed; IB, immunoblot; MDM2, murine double minute 2; Mdm2fl/+, Mdm2 heterozygous floxed; MerCreMer, tamoxifen inducible Cre recombinase; Mybpc3-/-, cardiac myosin binding protein 3 homozygous deletion; WGA, wheat germ agglutinin; and WT, wild-type.
Figure 6.
Figure 6.
MDM2 regulates capillary formation in Myh6R404Q/WT mice before the development of ventricular hypertrophy. A, Representative hematoxylin-eosin–stained heart cross-sections of postnatal days 25 (P25) and 60 (P60) WT and Myh6R404Q/WT mice. Scale bars=1 mm. Echocardiography assessment of (B) interventricular septal thickness at end diastole (IVSd) and (C) left ventricular posterior wall thickness at end diastole (LVPWd) in WT (n=10–11) and Myh6R404Q/WT (n=19–24) mice at P25, P60, or postnatal day 180 (P180). D, Representative images of WGA (red)–stained left ventricular tissue from WT and Myh6R404Q/WT mice at P25 or P60. Scale bar=75 μm. E, Cardiomyocyte cross-sectional areas from WGA-stained left ventricular tissue from WT (n=5–6) and Myh6R404Q/WT (n=5–6) mice at postnatal day 7 (P7), P25, or P60. Minimum 50 cardiomyocytes per sample. F, Representative immunohistochemistry images for CD31 (green) costained with WGA (red) in left ventricular tissue from P7 WT and Myh6R404Q/WT mice. Nuclei are blue (DAPI). Scale bars=50 μm. G, Capillary-to-cardiomyocyte ratios in left ventricular tissue from WT (n=5–6) and Myh6R404Q/WT (n=5–6) mice at postnatal day 2, P7, or P25. Minimum 200 cardiomyocytes per sample. H, Representative fluorescence images for the intravascularly injected endothelial cell stain T-lectin (green) in left ventricular tissue from P7 WT and Myh6R404Q/WT mice. Scale bars=80 μm. I, Capillaries per mm2 in left ventricular tissue from P7 WT (n=6) and Myh6R404Q/WT (n=6) mice; 3 cross-sectional images per sample were analyzed. J through M, Immunoblots and quantification for MDM2, HIF1α, and HIF2α in left ventricular tissue lysates from P7 WT (n=6–9) and Myh6R404Q/WT (n=6–9) mice normalized to β-actin and relative to WT. N, Capillary-to-cardiomyocyte ratios were calculated from left ventricular tissue in P7 WT (n=6), Mdm2fl/+/Myh6:Cre (n=6), Myh6R404Q/WT (n=6), and Myh6R404Q/WTMdm2fl/+/Myh6:Cre (n=6) mice. Minimum 200 cardiomyocytes per sample. O, Coronary flow reserve in P25 WT (n=5), Mdm2fl/+/Myh6:Cre (n=5), Myh6R404Q/WT (n=6), and Myh6R404Q/WTMdm2fl/+/Myh6:Cre (n=5) mice. All results are shown as mean±SEM. Student or Welch t test used for I, K, L, and M; 2-way ANOVA with Tukey multiple comparison test used for B, C, E, G, N, and O. CD31 indicates cluster of differentiation 31; DAPI, 4′,6-diamidino-2-phenylindole; HIF1α, hypoxia-inducible factor 1 alpha; HIF2α, hypoxia-inducible factor 2 alpha; MDM2, murine double minute 2; Mdm2fl/+Cre, Mdm2 heterozygous floxed and Myh6:Cre; Mybpc3-/-, cardiac myosin binding protein 3 homozygous deletion; Myh6:Cre, myosin heavy chain 6:Cre recombinase; Myh6R404Q/WT, myosin heavy chain 6 arginine to glutamine substitution at amino acid 404 heterozygous; T-lectin, tomato lectin; WGA, wheat germ agglutinin; and WT, wild-type.
Figure 7.
Figure 7.
Chemical inhibition of MDM2 prevents microvascular dysfunction in 2 distinct HCM models. A, Schematic of injections of vehicle or MDM2 PROTAC (MD-224) from postnatal days 1 (P1) to 6 (P6). B, Immunoblots for MDM2, HIF1α, and HIF2α in left ventricular tissue from postnatal day 7 (P7) WT or Mybpc3−/− injected with vehicle or MD-224. C, Immunoblots for MDM2, HIF1α, and HIF2α in left ventricular tissue from P7 WT and Myh6R404Q/WT injected with vehicle or MD-224. D, Representative immunohistochemistry images for CD31 (green) costained with WGA (red) in left ventricular tissue from P7 Mybpc3−/− and Myh6R404Q/WT injected with vehicle or MD-224 from P1 to P6. Nuclei are blue (DAPI); scale bars=50 μm. E, Capillary-to-cardiomyocyte ratios in left ventricular tissue from P7 WT vehicle (n=6), WT MD-224 (n=6), Mybpc3−/− vehicle (n=6), Mybpc3−/− MD-224 (n=5), Myh6R404Q/WT vehicle (n=7), and Myh6R404Q/WT MD-224 (n=6) mice. All groups injected from P1 to P6 with either vehicle or MD-224. Minimum 200 cardiomyocytes per sample. F, Schematic of WT or Myh6R404Q/WT mice injected with vehicle or MDM2 PROTAC (MD-224) from P1 to postnatal day 24 (P24), and then analyzed at postnatal day 60 (P60). G, Representative immunohistochemistry images for CD31 (green) costained with WGA (red) in left ventricular tissue from P60 Myh6R404Q/WT mice injected with vehicle or MD-224 from P1 to P24. Nuclei are blue (DAPI). Scale bars=15 μm. H, Capillary-to-cardiomyocyte ratios in left ventricular tissue from P60 WT vehicle (n=6), WT MD-224 (n=6), Myh6R404Q/WT vehicle (n=6), and Myh6R404Q/WT MD-224 (n=6) mice. All groups injected from P1 to P24 with vehicle or MD-224. Minimum 140 cardiomyocytes per sample. I, Coronary flow reserve was calculated in P60 WT vehicle (n=6), WT MD-224 (n=6), Myh6R404Q/WT vehicle (n=5), and Myh6R404Q/WT MD-224 (n=6) mice. All results are shown as mean±SEM. Student or Welch t test used for E, H, and I. CD31 indicates cluster of differentiation 31; DAPI, 4′,6-diamidino-2-phenylindole; HIF1α, hypoxia-inducible factor 1 alpha; HIF2α, hypoxia-inducible factor 2 alpha; MDM2, murine double minute 2; Mybpc3-/-, cardiac myosin binding protein 3 homozygous deletion; Myh6R404Q/WT, myosin heavy chain 6 arginine to glutamine substitution at amino acid 404 heterozygous; PROTAC, proteolysis targeting chimera; WGA, wheat germ agglutinin; and WT, wild-type.

References

    1. Maron BJ, Bonow RO, Cannon RO, Leon MB, Epstein SE. Hypertrophic cardiomyopathy Interrelations of clinical manifestations, pathophysiology, and therapy (2). N Engl J Med. 1987;316:844–852. doi: 10.1056/NEJM198704023161405 - PubMed
    1. McNally EM, Barefield DY, Puckelwartz MJ. The genetic landscape of cardiomyopathy and its role in heart failure. Cell Metab. 2015;21:174–182. doi: 10.1016/j.cmet.2015.01.013 - PMC - PubMed
    1. Marian AJ, Braunwald E. Hypertrophic cardiomyopathy: genetics, pathogenesis, clinical manifestations, diagnosis, and therapy. Circ Res. 2017;121:749–770. doi: 10.1161/CIRCRESAHA.117.311059 - PMC - PubMed
    1. Bos JM, Towbin JA, Ackerman MJ. Diagnostic, prognostic, and therapeutic implications of genetic testing for hypertrophic cardiomyopathy. J Am Coll Cardiol. 2009;54:201–211. doi: 10.1016/j.jacc.2009.02.075 - PubMed
    1. Teekakirikul P, Eminaga S, Toka O, Alcalai R, Wang L, Wakimoto H, Nayor M, Konno T, Gorham JM, Wolf CM, et al. Cardiac fibrosis in mice with hypertrophic cardiomyopathy is mediated by non-myocyte proliferation and requires Tgf-beta. J Clin Invest. 2010;120:3520–3529. doi: 10.1172/JCI42028 - PMC - PubMed

Publication types

Substances