. 2023 Oct 23;12(10):1360.
doi: 10.3390/biology12101360.

Dopaminergic Input Regulates the Sensitivity of Indirect Pathway Striatal Spiny Neurons to Brain-Derived Neurotrophic Factor

Affiliations

Dopaminergic Input Regulates the Sensitivity of Indirect Pathway Striatal Spiny Neurons to Brain-Derived Neurotrophic Factor

Maurilyn Ayon-Olivas et al. Biology (Basel). .

Abstract

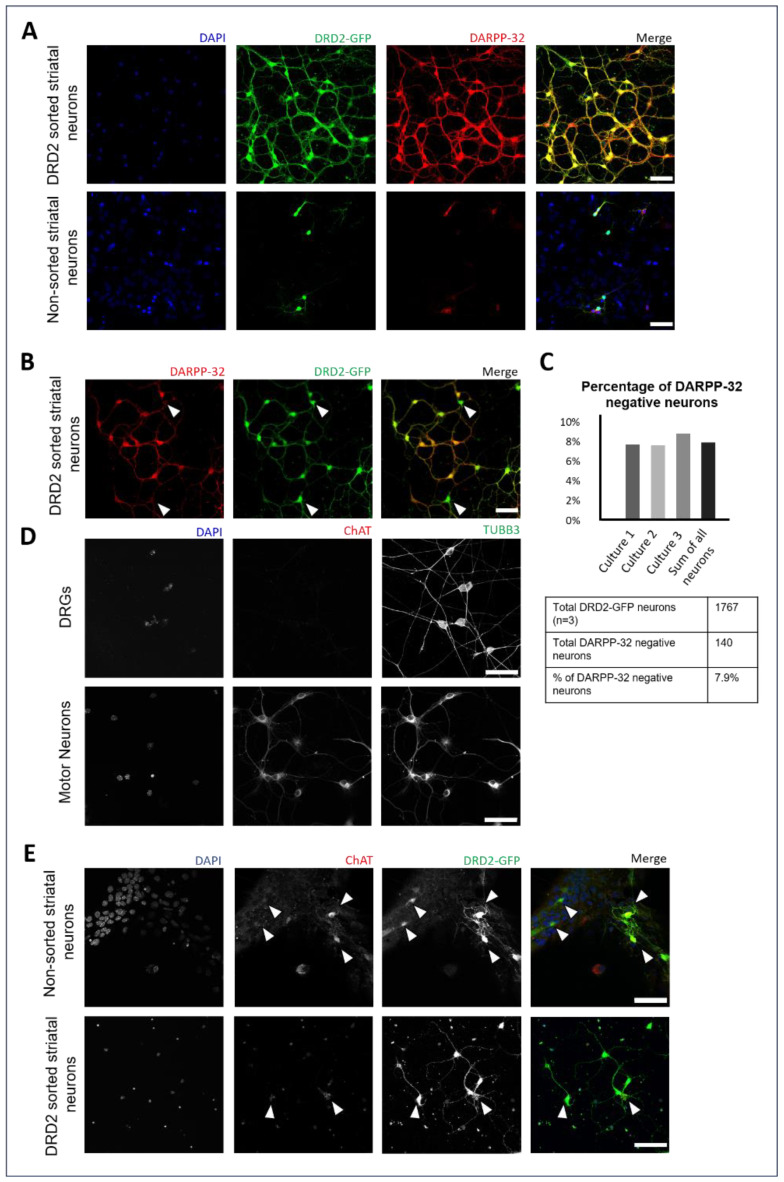
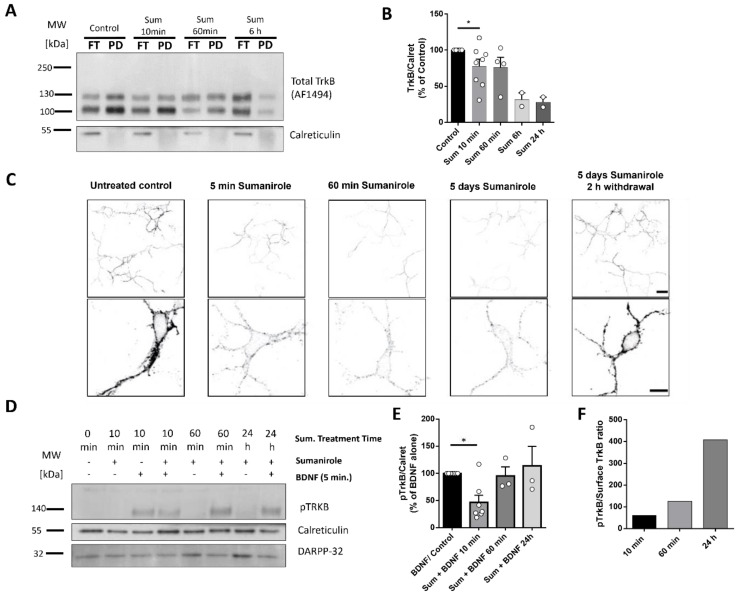
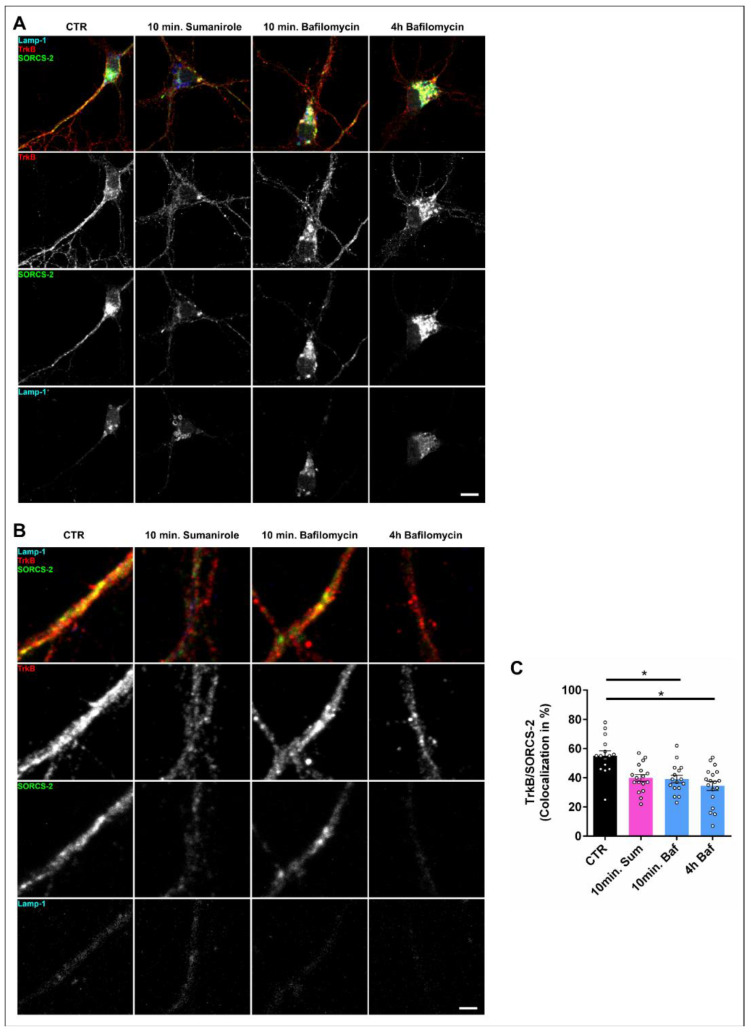
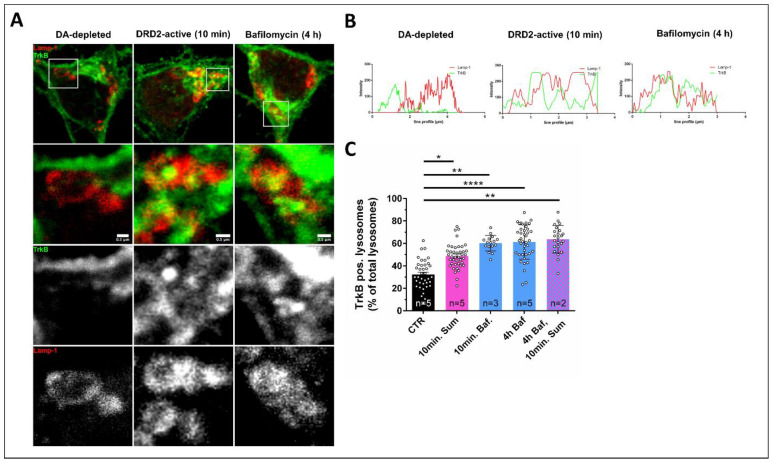
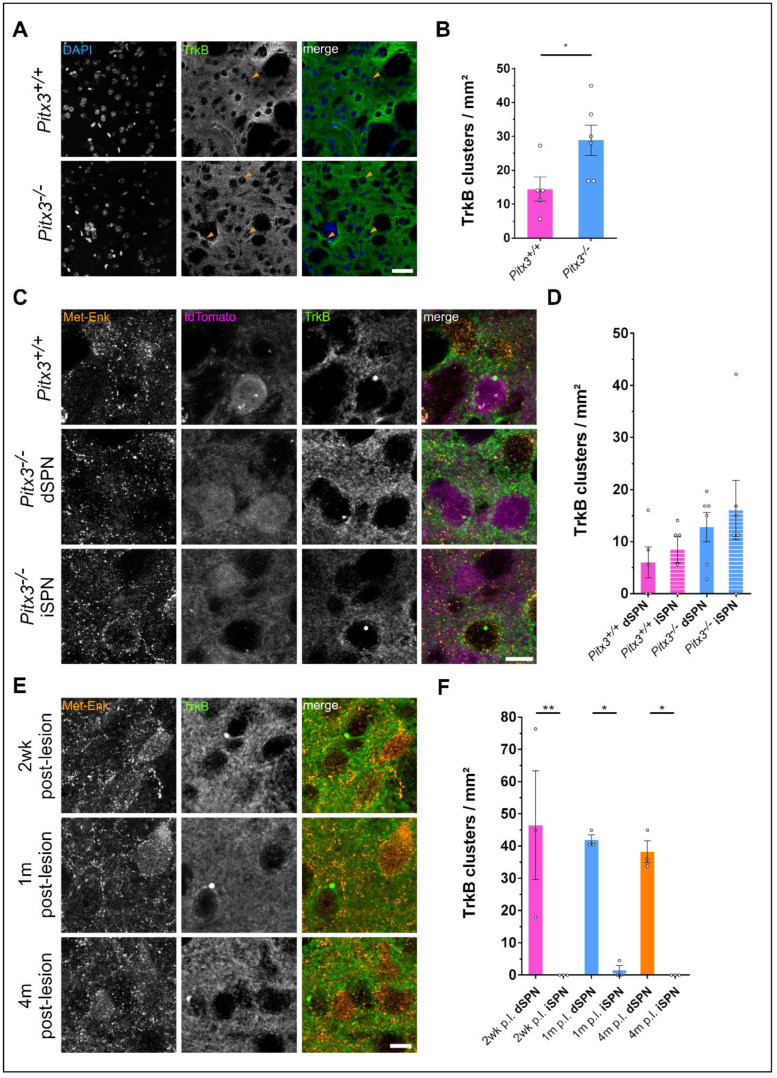
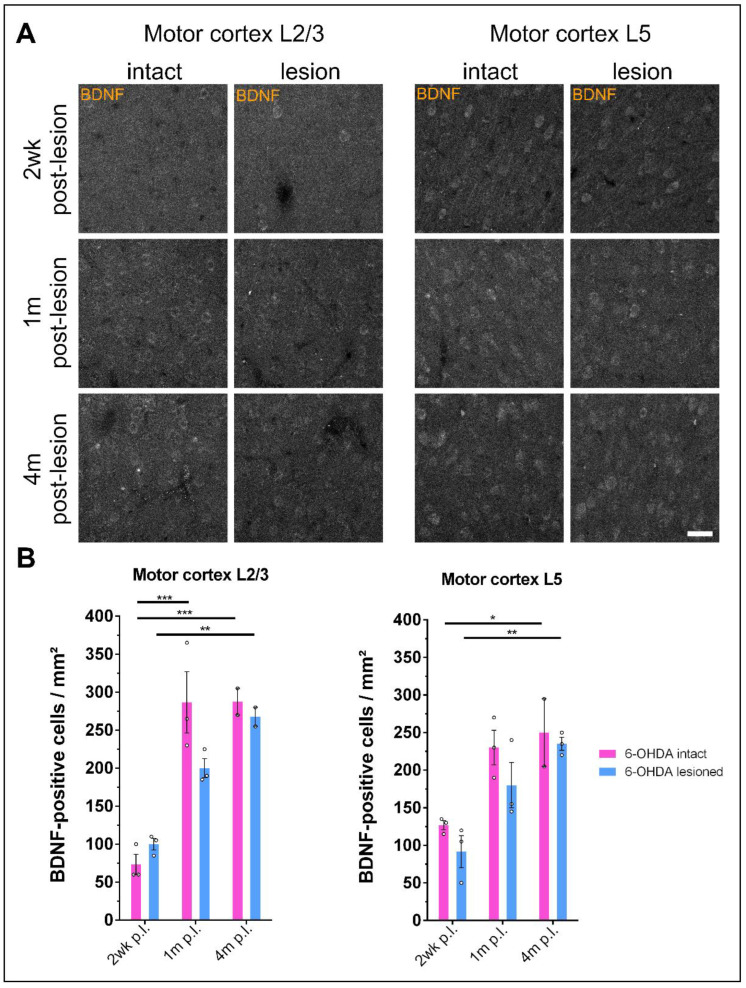
Motor dysfunction in Parkinson's disease (PD) is closely linked to the dopaminergic depletion of striatal neurons and altered synaptic plasticity at corticostriatal synapses. Dopamine receptor D1 (DRD1) stimulation is a crucial step in the formation of long-term potentiation (LTP), whereas dopamine receptor D2 (DRD2) stimulation is needed for the formation of long-term depression (LTD) in striatal spiny projection neurons (SPNs). Tropomyosin receptor kinase B (TrkB) and its ligand brain-derived neurotrophic factor (BDNF) are centrally involved in plasticity regulation at the corticostriatal synapses. DRD1 activation enhances TrkB's sensitivity for BDNF in direct pathway spiny projection neurons (dSPNs). In this study, we showed that the activation of DRD2 in cultured striatal indirect pathway spiny projection neurons (iSPNs) and cholinergic interneurons causes the retraction of TrkB from the plasma membrane. This provides an explanation for the opposing synaptic plasticity changes observed upon DRD1 or DRD2 stimulation. In addition, TrkB was found within intracellular structures in dSPNs and iSPNs from Pitx3-/- mice, a genetic model of PD with early onset dopaminergic depletion in the dorsolateral striatum (DLS). This dysregulated BDNF/TrkB signaling might contribute to the pathophysiology of direct and indirect pathway striatal projection neurons in PD.

Keywords: BDNF; DRD2; GPCR; Pitx3; TrkB; basal ganglia; cholinergic interneurons; cortico-striatal synapse; iSPNs; indirect pathway; synaptic plasticity.


Conflict of interest statement

The authors declare no conflict of interest.

Figures

Figure 1
Figure 1
Enrichment of DRD2 neurons and identification of DRD2-expressing interneurons. Fluorescence-based sorting of primary striatal neurons expressing D2 dopamine receptors. (A) Immunocytochemistry of spiny projection neurons (DIV7) expressing DRD2-eGFP, DARPP-32, and DAPI (upper panel) compared to non-sorted primary striatal neurons (lower panel). (B) Identification of DRD2 interneurons which do not express DARPP-32. (C) Quantification of DRD2-eGFP-positive and DARPP-32-negative neurons indicates a 7.9% presence of DRD2 interneurons in sorted cultures (n = 3). (D) Dorsal root ganglionic sensory neurons (DRGs; upper panel) and spinal motor neurons (lower panel) as negative and positive controls for ChAT expression, respectively. (E) Non-sorted striatal cultures (upper panel) and sorted DRD2 neurons (lower panel) showing GFP-positive cholinergic interneurons. Scale bars: 50 µm.
Figure 2
Figure 2
DRD2 activation with sumanirole decreases TrkB cell surface expression in iSPNs. (A) Western blot analysis of cell surface biotinylated flow cytometry-enriched DRD2-positive neurons at DIV 7-8 stimulated with sumanirole maleate (Sum). TrkB cell surface expression decreases gradually over time after stimulation of DRD2 for 10 min, 60 min, 6 h, and 24 h (see Figure S3). FT—flow through; PD—pull down. (B) Quantification of band intensity for TrkB cell surface expression, as shown in A. Data are shown as the mean ± SEM in % of untreated controls; Statistical analysis was performed using a one sample t-test using a mean of 100 (control). Number of replicates per condition are indicated in the figure as single data points. A confidence level of p ≤ 0.05 was set. p-values are indicated in the text and significant p-values are indicated in the figure. (C) Cell surface TrkB immunostaining of DRD2-eGFP-enriched neurons (DIV7) treated with sumanirole for 5 min, 60 min, and 5 days, and withdrawal for 2 h after 5 days of treatment compared against untreated controls maintained in the dopamine-depleted conditions. Scale bars: 20 µm (upper panel) and 10 µm (lower panel). (D) Western blot analysis of cell surface pTrkB induction of flow cytometry-enriched DRD2-positive neurons at DIV 7–8 stimulated with sumanirole maleate (Sum). TrkB phosphorylation is not observed under the control conditions or with sumanirole alone (lanes 1 and 2). Incubation with 10 ng/mL BDNF for 5 min induces TrkB phosphorylation (lane 3). Preincubation with 500 nM sumanirole maleate for 5 min followed by 10 ng/mL BDNF for another 5 min causes a significant reduction in pTrkB. Reduced pTrkB levels are not seen at later stages of preincubation with sumanirole at 60 min and 24 h. (E) Quantification of results from Western blots, as shown in D, from 3 independent experiments (n = 3). Statistical analysis was performed using a one-sample t-test. The control was set to 100%. Data are shown as the mean ± SEM in % of BDNF alone (n numbers are indicated in the graph for each condition as individual data points). A confidence level of p ≤ 0.05 was set. * p ≤ 0.05; empty circles represents individual data points All p-values are indicated in the text. (F) Ratio of pTrkB to cell surface-exposed TrkB in samples incubated with sumanirole for 10 min, 60 min, and 24 h (mean values of pTrkB/Surface TrkB: 10 min, 60.1; 60 min, 125.8; 24 h, 407.9.
Figure 3
Figure 3
DRD2 activation with sumanirole removes TrkB from the peripheral dendrites in iSPNs. (A) TrkB and SORCS-2 immunoreactivity in purified DRD2-SPNs. Neurons were stimulated with sumanirole for 10 min or bafilomycin for 10 min or 4 h and compared with untreated controls. DRD2 activation with sumanirole reduces surface TrkB expression in iSPNs. Prolonged treatment with bafilomycin leads to an accumulation of SORCS-2- and Lamp-1-positive structures in the soma but not in the dendrites of iSPNs. Scale bar: 10 µm. (B) TrkB immunoreactivity in the peripheral dendrites of DRD2 neurons. Sumanirole treatment leads to a retraction of TrkB from the peripheral dendrites and less association with the cargo receptor SORCS-2. The bafilomycin treatment also decreased TrkB/SORCS-2 association. Scale bar: 2 µm. (C) Quantification of TrkB/SORCS-2 colocalization in peripheral dendrites stimulated with sumanirole (Sum) or bafilomycin (Baf). Data are shown as the mean ± SEM in % of TrkB/SORCS-2 colocalization. n = 3 for every condition. One-way ANOVA with Tukey’s multiple comparisons test. * p < 0.05.
Figure 4
Figure 4
DRD2 activation with sumanirole leads to Lamp-1-associated intracellular TrkB clusters. (A) High magnification confocal microscopy shows that in iSPNs, TrkB is located at the plasma membrane. DRD2 activation induces TrkB’s retraction from the cell surface and the inhibition of its translocation to the cell surface. These images show the formation of intracellular TrkB clusters after the activation of DRD2, which are closely associated with Lamp-1-positive structures. (B) Exemplary line scans of TrkB and Lamp-1 intensities, as shown in A. (C) Quantification of TrkB/Lamp-1 structures, as shown in A. TrkB shows an increased association with lysosomes after DRD2 activation compared with the DA-depleted control. Data are shown as the mean ± SEM in % of all Lamp-1-positive structures. Number of biological replicates (cultures) per condition are indicated in the figure. One-way ANOVA with Tukey’s multiple comparisons test. * p < 0.05; ** p < 0.01; **** p < 0.001.
Figure 5
Figure 5
Dopamine depletion leads to TrkB cluster formation in striatal spiny projection neurons. (A) Upon dopamine depletion in the Pitx3−/− mouse model, increased numbers of cytosolic TrkB clusters (marked by arrowheads) occur in the dorsolateral striatum. Scale bar: 40 µm. (B) Quantification of TrkB clusters, as shown in (A). TrkB clusters occur at a higher frequency in Pitx3−/− than in wild-type control animals. Data are shown as the mean ± SEM. n = 5 for Pitx3+/+ and n = 6 for Pitx3−/−. Unpaired t-test (p = 0.0376). (C) TrkB clusters are found at perinuclear regions both in direct (tdTomato) and in indirect pathway (Met-Enk) spiny projection neurons. Scale bar: 10 µm. (D) Quantification of TrkB clusters, as shown in C. Data are shown as the mean ± SEM. n = 5 for Pitx3+/+ and n = 6 for Pitx−/−. One-way ANOVA with Tukey’s multiple comparisons test: Pitx3+/+ dSPN vs. Pitx3−/− dSPN: p = 0.6254; Pitx3+/+ iSPN vs. Pitx3−/− iSPN: p = 0.5326. (E) After 6-OHDA-induced lesion of the medial forebrain bundle in rats, the subsequent dopamine depletion leads to the formation of TrkB clusters in the dorsolateral striatum. These clusters occur exclusively in dSPNs, with no significant differences in their number at different time points after the lesion. dSPNs were identified as being negative for Met-Enkephalin, a marker for iSPNs. Scale bar: 10 µm. (F) Quantification of TrkB clusters shown in E. Data are shown as the mean ± SEM. n = 3 for every time point. One-way ANOVA with Tukey’s multiple comparisons test. * p < 0.05; ** p < 0.01.
Figure 6
Figure 6
BDNF levels progressively increase in the motor cortex of 6-OHDA-treated rats. (A) After acute dopamine depletion using the 6-OHDA lesion model, rats show increasing BDNF expression in the motor cortex with prolonged time after the lesion both on the intact and lesioned side. Scale bar: 40 µm. (B) Quantification of BDNF expression, as shown in A. Data are shown as the mean ± SEM. n = 2–3 for every time point. One-way ANOVA with Tukey’s multiple comparisons test. * p < 0.05; ** p < 0.01; *** p < 0.001.

References

    1. Checkoway H., Lundin J.I., Kelada S.N. Neurodegenerative diseases. IARC Sci. Publ. 2011;163:407–419. - PubMed
    1. Damier P., Hirsch E.C., Agid Y., Graybiel A.M. The substantia nigra of the human brain: II. Patterns of loss of dopamine-containing neurons in Parkinson’s disease. Brain. 1999;122:1437–1448. doi: 10.1093/brain/122.8.1437. - DOI - PubMed
    1. Fearnley J.M., Lees A.J. Ageing and Parkinson’s disease: Substantia nigra regional selectivity. Brain. 1991;114:2283–2301. doi: 10.1093/brain/114.5.2283. - DOI - PubMed
    1. Morrish P.K., Rakshi J.S., Bailey D.L., Sawle G.V., Brooks D.J. Measuring the rate of progression and estimating the preclinical period of Parkinson’s disease with 18F-dopa PET. J. Neurol. Neurosurg. Amp. Psychiatry. 1998;64:314–319. doi: 10.1136/jnnp.64.3.314. - DOI - PMC - PubMed
    1. Lim S.-Y., Lang A.E. The nonmotor symptoms of Parkinson’s disease—An overview. Mov. Disord. 2010;25:S123–S130. doi: 10.1002/mds.22786. - DOI - PubMed

LinkOut - more resources