. 2023 Oct 19;13(10):938.
doi: 10.3390/bios13100938.

Analytical Validation of a Spiral Microfluidic Chip with Hydrofoil-Shaped Pillars for the Enrichment of Circulating Tumor Cells

Affiliations

Analytical Validation of a Spiral Microfluidic Chip with Hydrofoil-Shaped Pillars for the Enrichment of Circulating Tumor Cells

Begum Sen-Dogan et al. Biosensors (Basel). .

Abstract

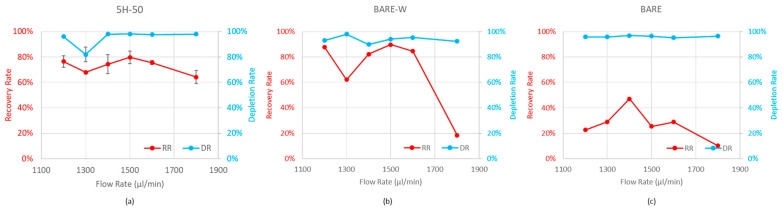
The isolation of circulating tumor cells (CTCs) from peripheral blood with high efficiency remains a challenge hindering the utilization of CTC enrichment methods in clinical practice. Here, we propose a microfluidic channel design for the size-based hydrodynamic enrichment of CTCs from blood in an epitope-independent and high-throughput manner. The microfluidic channel comprises a spiral-shaped part followed by a widening part, incorporating successive streamlined pillars, that improves the enrichment efficiency. The design was tested against two benchmark designs, a spiral microfluidic channel and a spiral microfluidic channel followed by a widening channel without the hydrofoils, by processing 5 mL of healthy blood samples spiked with 100 MCF-7 cells. The results proved that the design with hydrofoil-shaped pillars perform significantly better in terms of recovery (recovery rate of 67.9% compared to 23.6% in spiral and 56.7% in spiral with widening section), at a cost of slightly lower white blood cell (WBC) depletion (depletion rate of 94.2% compared to 98.6% in spiral and 94.2% in spiral with widening section), at 1500 µL/min flow rate. For analytical validation, the design was further tested with A549, SKOV-3, and BT-474 cell lines, yielding recovery rates of 62.3 ± 8.4%, 71.0 ± 6.5%, and 82.9 ± 9.9%, respectively. The results are consistent with the size and deformability variation in the respective cell lines, where the increasing size and decreasing deformability affect the recovery rate in a positive manner. The analysis before and after the microfluidic chip process showed that the process does not affect cell viability.

Keywords: circulating tumor cell (CTC) separation; computational fluid dynamics; inertial hydrodynamics; microfluidic channel.


Conflict of interest statement

Ender Yildirim and Ozge Zorlu have a patent titled “Method of microfluidic particle separation enhancement and the device thereof” issued to Mikro Biyosistemler Elektronik Sanayi ve Ticaret A.Ş. The funders had no role in the design of the study; in the collection, analyses, or interpretation of data; in the writing of the manuscript; or in the decision to publish the results.

Figures

Figure 1
Figure 1
(a) Typical Archimedean spiral microfluidic channel with separation wall at the outlet section. (b) Spiral microfluidic channel with widening outlet section. (c) Spiral microfluidic channel with widening outlet section and hydrofoils.
Figure 2
Figure 2
(a) Dean vortex across the channel and the equilibrium position of a particle. (b) Lateral equilibrium positions of 10 µm and 14 µm diameter particles at the exit of the spiral channel.
Figure 3
Figure 3
Two-dimensional model for analysis of the widening outlet section with hydrofoils.
Figure 4
Figure 4
Experimental setup for microfluidic sample processing. The fluid flow is regulated with a flow controller supplied by compressed N2 line. Flow rate is adjusted with the feedback control based on the readings of a thermal flow sensor. Channel is observed using an inverted microscope.
Figure 5
Figure 5
Microfabricated silicon–glass microfluidic chips. (a): BARE design, (b): BARE-W design, (c): 5H-50 design. Insets show the SEM images of separation regions for each chip design.
Figure 6
Figure 6
Bright-field and fluorescent images showing the focusing lines for 10 µm beads and 18.7 µm beads along the different channel designs at different flow rates. Fluorescent images were generated by overlaying the pseudocolored bright-field images for 18.7 µm beads (red) and 10 µm beads (green) at a 1500 µL/min flow rate.
Figure 7
Figure 7
(a): Different focusing lines of fluorescently stained MCF-7 cells and WBCs inside 5H-50, BARE-W, and BARE chip designs, together with their corresponding bright-field images at 1500 µL/min flow rate. (b): Normalized lateral position (x/w) of MCF-7 cells and WBCs across the channel of 5H-50. The diameter of the data markers represents the normalized intensity. It is noted that MCF-7 cells were focused at secondary and tertiary positions (indicated by arrows) in addition to the primary equilibrium position. The data for fluorescent intensity distribution along the channel width were extracted on the red dotted lines drawn in the separation region as presented in (a).
Figure 8
Figure 8
Variation in MCF-7 recovery and WBC depletion rates against flow rate when 1 × 10⁵ cells/mL was used for (a) 5H-50, (b) BARE-W, and (c) BARE (b) chips. Optimal results were obtained at the design flow rate of 1500 µL/min in both 5H-50 and BARE-W.
Figure 9
Figure 9
WBC depletion and MCF-7 recovery rates obtained from 5H-50, BARE-W, and BARE chip designs in spiking experiments. Data were collected by spiking 100 MCF-7 cells in 5 mL of whole blood at 1500 µL/min. Data show the average of at least three experiments with standard deviation.
Figure 10
Figure 10
The relationship between spiked and collected MCF-7 cells. Data were generated through 27 independent experiments carried out at varying MCF-7-spiking rates. The linear regression was calculated to be R2 = 0.9856.
Figure 11
Figure 11
Recovery rates obtained with MCF-7 (n = 8), A549 (n = 5), SKOV-3 (n = 7), and BT-474 (n = 5) cancer cell lines spiked into healthy blood sample (5 mL).

References

    1. Micalizzi D.S., Maheswaran S., Haber D.A. A Conduit to Metastasis: Circulating Tumor Cell Biology. Genes Dev. 2017;31:1827–1840. doi: 10.1101/gad.305805.117. - DOI - PMC - PubMed
    1. Agashe R., Kurzrock R. Circulating Tumor Cells: From the Laboratory to the Cancer Clinic. Cancers. 2020;12:2361. doi: 10.3390/cancers12092361. - DOI - PMC - PubMed
    1. Bardia A., Haber D.A. Solidifying Liquid Biopsies: Can Circulating Tumor Cell Monitoring Guide Treatment Selection in Breast Cancer? J. Clin. Oncol. 2014;32:3470–3471. doi: 10.1200/JCO.2014.57.1505. - DOI - PubMed
    1. Masuda T., Hayashi N., Iguchi T., Ito S., Eguchi H., Mimori K. Clinical and Biological Significance of Circulating Tumor Cells in Cancer. Mol. Oncol. 2016;10:408–417. doi: 10.1016/j.molonc.2016.01.010. - DOI - PMC - PubMed
    1. Keller L., Pantel K. Unravelling Tumour Heterogeneity by Single-Cell Profiling of Circulating Tumour Cells. Nat. Rev. Cancer. 2019;19:553–567. doi: 10.1038/s41568-019-0180-2. - DOI - PubMed

LinkOut - more resources