Review
. 2023 Oct 19;13(10):939.
doi: 10.3390/bios13100939.

Quantitative Imaging of Genetically Encoded Fluorescence Lifetime Biosensors

Affiliations
Review

Quantitative Imaging of Genetically Encoded Fluorescence Lifetime Biosensors

Cong Quang Vu et al. Biosensors (Basel). .

Abstract

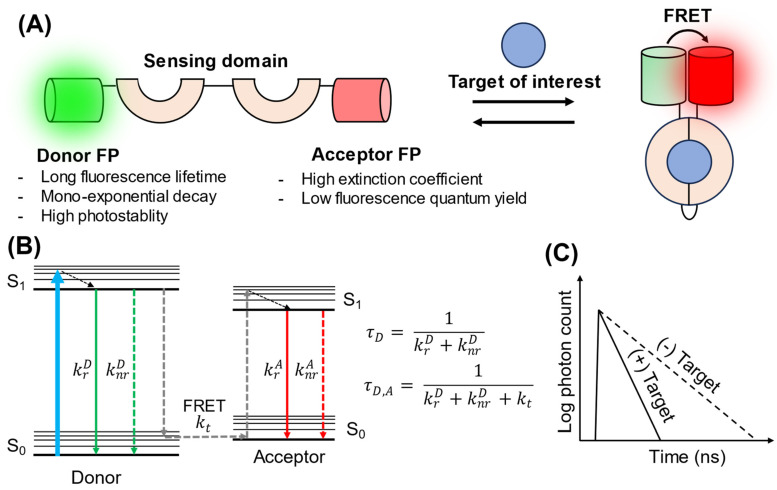
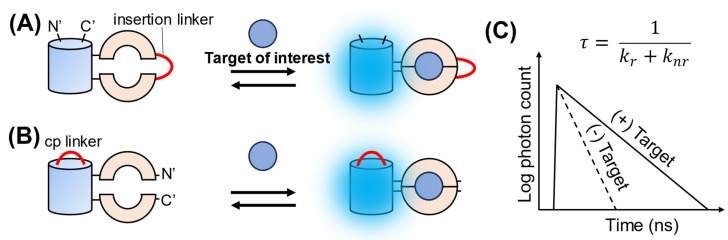
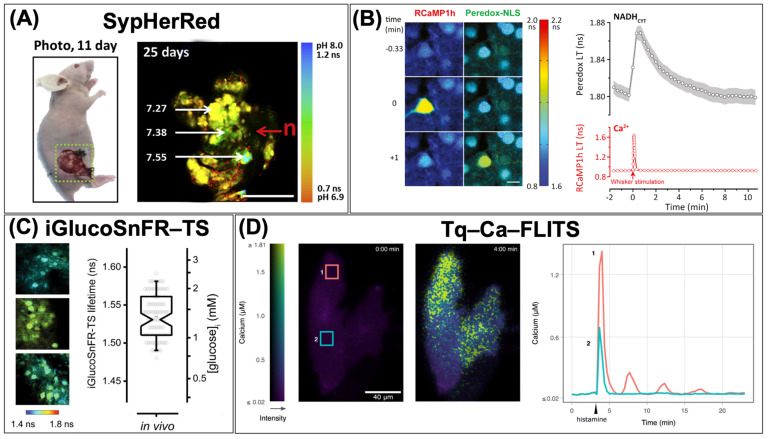
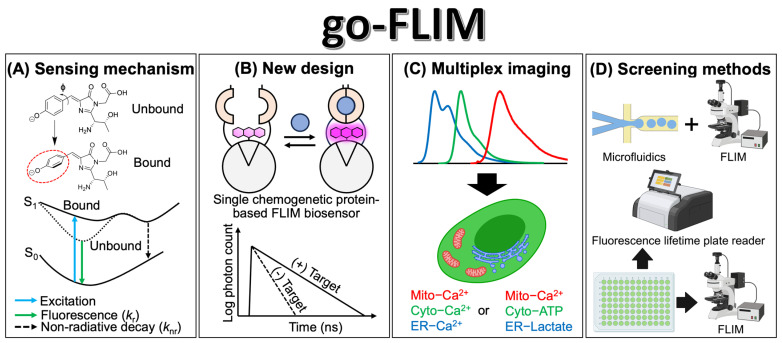
Genetically encoded fluorescence lifetime biosensors have emerged as powerful tools for quantitative imaging, enabling precise measurement of cellular metabolites, molecular interactions, and dynamic cellular processes. This review provides an overview of the principles, applications, and advancements in quantitative imaging with genetically encoded fluorescence lifetime biosensors using fluorescence lifetime imaging microscopy (go-FLIM). We highlighted the distinct advantages of fluorescence lifetime-based measurements, including independence from expression levels, excitation power, and focus drift, resulting in robust and reliable measurements compared to intensity-based approaches. Specifically, we focus on two types of go-FLIM, namely Förster resonance energy transfer (FRET)-FLIM and single-fluorescent protein (FP)-based FLIM biosensors, and discuss their unique characteristics and benefits. This review serves as a valuable resource for researchers interested in leveraging fluorescence lifetime imaging to study molecular interactions and cellular metabolism with high precision and accuracy.

Keywords: FLIM; FRET–FLIM; fluorescent proteins; genetically encoded fluorescence lifetime biosensors; quantitative imaging.


Conflict of interest statement

The authors declare no conflict of interest.

Figures

Figure 1
Figure 1
Schematic illustration of the design and sensing mechanism of FRET–FLIM biosensors. (A) Design of FRET–FLIM biosensors. A donor and acceptor FP are fused to a sensing domain that undergoes a conformational change upon binding to its target. This change brings the two FPs into close proximity, inducing FRET. (B) Jablonski diagram of FRET–FLIM [16]. S0 and S1 represent the ground state and excited states, respectively. Here, krD is the radiative rate constant of the donor; knrD is the nonradiative rate constant of the donor; kt is the energy transfer rate constant; krA is the radiative rate constant of the acceptor; knrA is the nonradiative rate constant of the acceptor; τD is the fluorescence lifetime when only the donor is present; and τD,A is the fluorescence lifetime of the donor in the presence of an acceptor in the FRET pair. (C) Schematic representation of fluorescence decay in the presence and absence of the target. When FRET occurs, elevated kt results in a shortened fluorescence lifetime for the donor.
Figure 2
Figure 2
Schematic illustration of the design and FLIM response of single-FP-based FLIM biosensors. (A) Insertion type and (B) circular permutation (cp) type. For the insertion type, the sensing domain is split into two sections, each interconnected by an insertion linker. For the cp type, the FP is divided into two sections, each bridged by a cp linker. (C) Schematic illustration of the FLIM response. Upon binding to the target of interest, the non-radiative rate constant (knr) may be altered (to be discussed later), causing changes in fluorescence lifetime (𝜏).
Figure 3
Figure 3
Cellular quantitative imaging using single-FP-based FLIM biosensors. (A) Quantification of pH in tumors by SypHerRed (reproduced with permission from Ref. [41]). (B) Measurement of cytosolic NADH/NAD+ ratio with Peredox and Ca2+ concentration with RCaMP1h in neuronal cells in response to whisker stimulation (reproduced with permission from Ref. [43]). (C) Mapping glucose concentration in cortical neurons of awake mice using iGlucoSnFR–TS. Fluorescence lifetime images (left) and the quantification of glucose concentration (right) (reproduced with permission from Ref. [44]). (D) Monitoring Ca2+ levels in endothelial cells with Tq–Ca–FLITS before and after stimulation with histamine. Fluorescence lifetime images (left) and quantifying Ca2+ concentration in ROI1 and ROI2 (right) (reproduced with permission from Ref. [27]).
Figure 4
Figure 4
The promising future of go-FLIM development. (A) A schematic representation illustrating the proposed sensing mechanism of single-FP-based FLIM biosensors. A red circle indicates the rotation of chromophore. (B) Conceptual design of a single chemogenetic protein-based FLIM biosensor and its FLIM response. (C) Representation of multiplex imaging employing go-FLIMs that target various analytes across different organelles such as the mitochondria (mito), cytoplasm (cyto), and endoplasmic reticulum (ER). (D) Introduction of methodologies for the screening of go-FLIM. Illustrations were created with BioRender.com.

References

    1. Chalfie M., Tu Y., Euskirchen G., Ward W.W., Prasher D.C. Green Fluorescent Protein as a Marker for Gene Expression. Science. 1994;263:802–805. doi: 10.1126/science.8303295. - DOI - PubMed
    1. Miyawaki A., Llopis J., Heim R., McCaffery J.M., Adams J.A., Ikura M., Tsien R.Y. Fluorescent indicators for Ca2+ based on green fluorescent proteins and calmodulin. Nature. 1997;388:882–887. doi: 10.1038/42264. - DOI - PubMed
    1. Zhao Y., Araki S., Wu J., Teramoto T., Chang Y.F., Nakano M., Abdelfattah A.S., Fujiwara M., Ishihara T., Nagai T., et al. An expanded palette of genetically encoded Ca2+ indicators. Science. 2011;333:1888–1891. doi: 10.1126/science.1208592. - DOI - PMC - PubMed
    1. Arai S., Kriszt R., Harada K., Looi L.-S., Matsuda S., Wongso D., Suo S., Ishiura S., Tseng Y.-H., Raghunath M., et al. RGB-Color Intensiometric Indicators to Visualize Spatiotemporal Dynamics of ATP in Single Cells. Angew. Chem. Int. Ed. 2018;57:10873–10878. doi: 10.1002/anie.201804304. - DOI - PMC - PubMed
    1. Jing M., Li Y., Zeng J., Huang P., Skirzewski M., Kljakic O., Peng W., Qian T., Tan K., Zou J., et al. An optimized acetylcholine sensor for monitoring in vivo cholinergic activity. Nat. Methods. 2020;17:1139–1146. doi: 10.1038/s41592-020-0953-2. - DOI - PMC - PubMed

MeSH terms

LinkOut - more resources