. 2023 Oct 11;12(20):2431.
doi: 10.3390/cells12202431.

Identification of BRCC3 and BRCA1 as Regulators of TAZ Stability and Activity

Affiliations

Identification of BRCC3 and BRCA1 as Regulators of TAZ Stability and Activity

Silvia Sberna et al. Cells. .

Abstract

TAZ (WWTR1) is a transcriptional co-activator regulated by Hippo signaling, mechano-transduction, and G-protein couple receptors. Once activated, TAZ and its paralogue, YAP1, regulate gene expression programs promoting cell proliferation, survival, and differentiation, thus controlling embryonic development, tissue regeneration, and aging. YAP and TAZ are also frequently activated in tumors, particularly in poorly differentiated and highly aggressive malignancies. Yet, mutations of YAP/TAZ or of their upstream regulators do not fully account for their activation in cancer, raising the possibility that other upstream regulatory pathways, still to be defined, are altered in tumors. In this work, we set out to identify novel regulators of TAZ by means of a siRNA-based screen. We identified 200 genes able to modulate the transcriptional activity of TAZ, with prominence for genes implicated in cell-cell contact, cytoskeletal tension, cell migration, WNT signaling, chromatin remodeling, and interleukins and NF-kappaB signaling. Among these genes we identified was BRCC3, a component of the BRCA1 complex that guards genome integrity and exerts tumor suppressive activity during cancer development. The loss of BRCC3 or BRCA1 leads to an increased level and activity of TAZ. Follow-up studies indicated that the cytoplasmic BRCA1 complex controls the ubiquitination and stability of TAZ. This may suggest that, in tumors, inactivating mutations of BRCA1 may unleash cell transformation by activating the TAZ oncogene.

Keywords: BRCA1; BRCC3; TAZ; WWTR1; YAP1; post-translational regulation.


Conflict of interest statement

The authors declare no conflict of interest. The funders had no role in the design of the study; in the collection, analyses, or interpretation of data; in the writing of the manuscript; or in the decision to publish the results.

Figures

Figure 1
Figure 1
Identification of genes regulating TAZ activity by an siRNA screen. (a) Outline of the siRNA screen. (b,c) Dot plot of TEAD reporter activity and cell viability (Z-score normalized values). The different classes of control siRNA (c) and hits (d) are highlighted in colors. (d) Pie chart of the different classes of hits. (e) Gene Ontology network of the genes identified as regulators of TAZ activity.
Figure 2
Figure 2
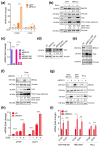
BRCC3, BRCA1, and other BRCA−1 complex components repress TAZ activity. (a,b) First, 150.000 pSLIK–TAZS89A–8xTEAD–LUC MCF10A cells were transfected with siRNA against BRCC3 or with a non−targeting sequence (siGFP) as control, in the presence or in absence of 2 µg/mL of doxycycline. After 48 h from transfection, cells were collected. (a) RT–qPCR analysis. The bar plot shows cDNA levels of two TAZ target genes, CTGF, and CYR61, normalized on GAPDH housekeeping gene and expressed as fold change. T–test was applied to evaluate the statistical significance: * p value < 0.05 ** p value < 0.01 *** p value < 0.005. (b) WB analysis, vinculin was used as loading control. (c,d) Silencing of BARD1 and BRCA2 in MCF10A cells. RT–qPCR and WB analysis were performed after 48 h from the transfection in sub-confluent condition. (c) Bar plots showing the expression levels of BRCA2 and BARD1. T–test was applied to evaluate the statistical significance: *** p value < 0.005 **** p value < 0.001. (d) WB analysis, vinculin was used as loading control. (eg) Analysis of TAZ and BRCA1 protein level by WB, following BRCA1−KD in the reported cell lines. (b,dg) The normalized densitometric values of the WB bands are reported below the WB snapshots. (h,i) Analysis of TAZ target genes by RT–qPCR in (h) pSLIK–TAZS89A–8xTEAD–LUC MCF10A cells and (i) MDA–MB–231, KEK–293T, and HeLa cells.
Figure 3
Figure 3
Silencing BRCA1 alters TAZ protein levels without affecting its intracellular distribution. For the evaluation of TAZ by Immunofluorescence analysis, HeLa cells were transfected with siBRCA1 (#458) or with a non−targeting siRNA, as control (siC). After 48 h, sub−confluent cells were fixed and stained with two TAZ antibodies. (a) Representative images at 100× magnification, scale bar = 30 µm, in blue Dapi stained nuclei, in red TAZ protein detected by the C22 antibody, in green TAZ protein stained with the C188 antibody. (b) Dot plot showing the quantification of the mean intensity of TAZ relative signal per cell detected with the C22 and the C188 antibody. Raw data were analyzed through the Fiji software (version 2.14.0/1.54f). Sample size: 80 cells. Mann−Whitney test was applied to run statistical analysis: **** p value < 0.0001.
Figure 4
Figure 4
Evidence of the intracellular proximity of TAZ and BRCA1. (a) HeLa cells were transfected with the pQCX–TAZwt–Myc–tag and the pMH–BRCA1–FLAG plasmids to overexpress TAZ and BRCA1. After 48 h from the transfection, sub-confluent cells were fixed and processed. Dot plot showing the quantification of the PLA–foci per cell. Cells were stained with only one primary antibody (TAZ or BRCA1) or with secondary probes only (no primary antibodies) as technical negative controls. Raw data were analyzed by ImageJ software. Cell area was measured by an ImageJ plugin that predicts polygonal shapes around the DAPI signal. Sample size: 590 cells per condition. Mann–Whitney test was applied to run statistical analysis: **** p value <0.0001. (b,c) MCF10A–rtTA–Cas9–sgROSA and –sgTAZ (#2) cells were seeded in six wells on glass coverslip in presence of 1 µg/mL of doxycycline to induce Cas9 expression. After 72 h sub-confluent cells were fixed and processed. (b) Representative micrographs at 100× magnification of PLA–foci detected in MCF10A cells wild type for TAZ (sgROSA) or knock-out for TAZ (sgTAZ). In blue the nuclei stained with DAPI, in red the PLA signal showing TAZ–BRCA1 proximity. (c) Dot plot of the number of PLA foci per cell. Sample size: 635 cells per condition. Mann-Whitney test was applied to run statistical analysis: **** p value < 0.0001. (d,e) HeLa and MCF10A cells were transfected with plasmids to overexpress TAZ and BRCA1. After 48 h, sub-confluent cells were fixed in PFA 4% and processed for IF and PLA analysis. (d) Representative images at 100× magnification: in blue Dapi stained nuclei, in red PLA-dots, in green TAZ overexpression detected by IF. (e) Bar plot showing the fraction of PLA dots per cell co-localizing with Dapi signal (nuclear proximity) or with TAZ signal but not with the Dapi (cytosolic proximity). Images were analysed with the ImageJ software. Sample size: 94 HeLa cells and 40 MCF10A cells overexpressing TAZ.
Figure 5
Figure 5
Hippo signaling is epistatic over BRCA1 regulation. (a,b) WB analysis of Hippo pathway components (LATS1, MOB1, MST2, and LATS2) in (a) MCF10A–pSLIK–TAZS89A, and (b) MDA–MB–231, HEK–293T, and HeLa. Cells were transfected with siBRCA1 (#458) or with a non–targeting siRNA (siC) as control. After 48 h, cells were lysed for protein extraction. Vinculin was used as loading control. (c) WB analysis of HEK–293A cells wild-type (WT) or KO for LATS1, LATS2 or both (dKO). Cells were transfected with siBRCA1 (#458) or with a non-targeting siRNA (siC) as control for 48 h. Vinculin was used as loading control. (d) WB analysis of HEK–293A cells wild type (WT) or double knock-out for LATS1,2 (dKO). Cells were first transfected siRNA against BRCA1 (#458) or with a non-targeting siRNA (siC), and then, 24 h later, with pEGFP C3–LATS1 plasmid or an empty vector (pEGFP–EV). Cells were collected 48 h from the first transfection and processed for protein analysis. Vinculin was used as loading control. The normalized densitometric values of the WB bands are reported below the WB snapshots.
Figure 6
Figure 6
Regulation of TAZ by BRCA1 is mainly by post–translational. (ac) RT–qPCR analysis of (a) MCF10A–pSLIK–TAZS89A–8xTEAD–LUC cells, (b) MDA–MB–231, HEK–293T and HeLa cells, and (c) HEK-293A cells wild type (WT), single KO for LATS1 and LATS2 or dKO. cDNA levels were normalized to either GAPDH or RPLPO housekeeping genes and expressed as fold change. T–test was applied to evaluate the statistical significance: * p value < 0.05 *** p value < 0.005 **** p value < 0.001. (d,e) WB analysis of confluent MCF10A cells treated with 5µM of the proteasome inhibitor MG132 for 6 h. (e) Densitometric analysis of the WB shown in (d). TAZ signal was normalized to Vinculin signal and expressed as fold change compared to the not-treated condition (-).
Figure 7
Figure 7
BRCA1 regulates TAZ ubiquitylation (a,b) WB analysis of confluent MCF10A transfected with siBRCA1 (#458) or with a non-targeting sequence (siC), and treated with CHX for the indicated times. (b) Densitometric analysis of the WB shown in (a). (c,d) Analysis of TAZ ubiquitylation by immunoprecipitation (IP) and WB analysis. HEK–293A cells were transfected with siBRCA1 (#458) or a mock siRNA (siC). After 48 h, cells were transfected with plasmids encoding for TAZ (pMSCV-HA-TAZ) and Ubiquitin (pcDNA3–FLAG–Ub). At 72 h from the first transfection, cells were treated with 5 µM of proteasome inhibitor MG132 for 6 h. 2.5% of the immunoprecipitated lysate (Input) was loaded to assess the fold enrichment in TAZ IP. The normalized densitometric values of the WB bands are reported below the WB snapshots.
Figure 8
Figure 8
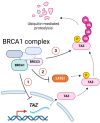
Model of how BRCA1 and BRCC3 control TAZ. BRCA1/BRCC3 control TAZ activity by modulating (1) TAZ transcription (2) LATS1 protein level (3) TAZ ubiquitylation and proteasomal degradation. Created with BioRender.com (accessed on 4 October 2023).

References

    1. Dong J., Feldmann G., Huang J., Wu S., Zhang N., Comerford S.A., Gayyed M.F., Anders R.A., Maitra A., Pan D. Elucidation of a universal size-control mechanism in Drosophila and mammals. Cell. 2007;130:1120–1133. doi: 10.1016/j.cell.2007.07.019. - DOI - PMC - PubMed
    1. Liu C.Y., Zha Z.Y., Zhou X., Zhang H., Huang W., Zhao D., Li T., Chan S.W., Lim C.J., Hong W., et al. The hippo tumor pathway promotes TAZ degradation by phosphorylating a phosphodegron and recruiting the SCFbeta-TrCP E3 ligase. J. Biol. Chem. 2010;285:37159–37169. doi: 10.1074/jbc.M110.152942. - DOI - PMC - PubMed
    1. Zhao B., Li L., Tumaneng K., Wang C.Y., Guan K.L. A coordinated phosphorylation by Lats and CK1 regulates YAP stability through SCF(beta-TRCP) Genes. Dev. 2010;24:72–85. doi: 10.1101/gad.1843810. - DOI - PMC - PubMed
    1. Heng B.C., Zhang X., Aubel D., Bai Y., Li X., Wei Y., Fussenegger M., Deng X. An overview of signaling pathways regulating YAP/TAZ activity. Cell Mol. Life Sci. 2021;78:497–512. doi: 10.1007/s00018-020-03579-8. - DOI - PMC - PubMed
    1. Martin-Belmonte F., Perez-Moreno M. Epithelial cell polarity, stem cells and cancer. Nat. Rev. Cancer. 2011;12:23–38. doi: 10.1038/nrc3169. - DOI - PubMed

Publication types

MeSH terms