. 2023 Oct 18;12(20):2474.
doi: 10.3390/cells12202474.

Long Prehensile Protrusions Can Facilitate Cancer Cell Invasion through the Basement Membrane

Affiliations

Long Prehensile Protrusions Can Facilitate Cancer Cell Invasion through the Basement Membrane

Shayan S Nazari et al. Cells. .

Abstract

A basic process in cancer is the breaching of basement-membrane barriers to permit tissue invasion. Cancer cells can use proteases and physical mechanisms to produce initial holes in basement membranes, but how cells squeeze through this barrier into matrix environments is not well understood. We used a 3D invasion model consisting of cancer-cell spheroids encapsulated by a basement membrane and embedded in collagen to characterize the dynamic early steps in cancer-cell invasion across this barrier. We demonstrate that certain cancer cells extend exceptionally long (~30-100 μm) protrusions through basement membranes via actin and microtubule cytoskeletal function. These long protrusions use integrin adhesion and myosin II-based contractility to pull cells through the basement membrane for initial invasion. Concurrently, these long, organelle-rich protrusions pull surrounding collagen inward while propelling cancer cells outward through perforations in the basement-membrane barrier. These exceptionally long, contractile cellular protrusions can facilitate the breaching of the basement-membrane barrier as a first step in cancer metastasis.

Keywords: 3D culture; basement membrane; cell protrusion; collagen; contractility; cytoskeleton; integrin; invasion; myosin II; spheroid.


Conflict of interest statement

The authors declare no conflict of interest.

Figures

Figure 1
Figure 1
Timelapse imaging of spheroid-invasion assay and confocal imaging of long protrusions during initial breaching of the basement membrane. (A,B) Timelapse phase-contrast imaging of cancer-cell protrusions and invading cells extending from tumor spheroids over 50 h. Note that protrusions form between 0 h and 10 h. White arrowheads indicate a long protrusion of interest that extends over 30 h into the surrounding collagen gel, as the collagen is concurrently pulled toward the spheroid. Black arrowhead marks a fiduciary particle in the collagen that is translocated toward the spheroid during invasion. (C) Confocal immunofluorescence microscopy showing F-actin (green, stained with phalloidin), collagen IV (Coll IV, red), collagen I (magenta), and DAPI-stained nuclei (blue) of long protrusions generated by single-spheroid cancer cells that extend out of the basement membrane and into collagen gel before, during, and after cell breaching of the basement membrane (note the locations of the blue nuclei). Scale bars: (A), 100 µm; (A inset and C), 20 µm.
Figure 2
Figure 2
Collagen displacement and subsequent cell invasion require myosin II contractility. (A) A region of interest (red dashed line) used to generate a kymograph from a timelapse video of MDA-MB-231BO tumor spheroid cells invading through a basement membrane and into the surrounding collagen gel over 60 h. (B) Kymograph of spheroid in A demonstrating the movement of collagen over time: the x-axis = time; y-axis = distance in µm. Collagen movement towards the expanding spheroid (bottom of kymograph) occurs during early protrusion and subsequent cell invasion through the BM during the initial 18 h; collagen displacement (bracketed regions 1 and 2), is followed by outward streaming cells into the collagen gel (region 2). (C) Spheroids treated with the myosin II ATPase inhibitor blebbistatin or DMSO vehicle control imaged over 18 h. (D) Kymographs used to quantify collagen displacement in panel C. Cyan and magenta dashed lines indicate the extent of collagen movement over 18 h for control and blebbistatin-treated spheroids, respectively. (E) Kymograph analyses indicate collagen displacement was dramatically inhibited by the myosin II inhibitor compared to its control. (F) Quantification of numbers of nuclei invading outside the perimeters of the spheroids. (G) Comparisons of SCC9 oral cancer cells’ invasion into the collagen hydrogel in vehicle control versus blebbistatin over 36 h. (H) Kymograph analysis of SCC9-mediated collagen displacement comparing vehicle control to blebbistatin treatment. Collagen displacement was measured from four computer-selected regions surrounding each individual spheroid. Number of independent experiments N = 3; number of spheroids in each experiment n = 3–8. **** p < 0.0001. Mean value ± SEM. Scale bars: (C) and (G), 100 µm.
Figure 3
Figure 3
Long protrusions generate tension within the collagen microenvironment. (A) Maximum-intensity project (MIP) of MDA-MB-231BO cells expressing mNeon Green LifeAct (green). Eight hours after embedding spheroids in collagen gels, cells form protrusions into the surrounding collagen matrix (red). The image is a maximum-intensity projection of 10 µm. (B) The same cell (white dashed box in panel A) shown only at a single Z plane immediately before (Pre) and at 2 s and 60 s after a focused two-photon beam severs the protrusions (arrowheads). Vertical yellow dashed line indicates position of the kymograph shown in panel C. (C) Kymograph depicts the time of protrusion severing (black stripe) and the relatively small release of tension within the ECM after protrusion collapse. White dashed boxes (magnified on the right) illustrate the subtle changes 2 s and 60 s after cell and ECM severing. Vertical dashed yellow line demonstrates a small change at 2 s, followed by continued ECM relaxation over 60 s. (D) Analysis of collagen movement 2 s and 60 s after severing of a protrusion; box indicates lower and upper quartile and whiskers indicate 10th and 90th percentiles. N = 9, n = 48. * p ≤ 0.001. Scale bars: (A) and (B) 25 µm.
Figure 4
Figure 4
Quantitative comparison of effects of cytoskeletal inhibitors on rates of collagen displacement and protrusion count. (A) Representative images of spheroids 18 h after treatment with different inhibitors that directly or indirectly affect cytoskeletal components. (B) Kymographs were generated for each condition, and the distance of collagen displacement from time 0 to 18 h was quantified. (C) After 8 h of timelapse live imaging, control spheroids extended protrusions into the surrounding collagen. However, spheroids treated with blebbistatin, latrunculin A, and nocodazole failed to generate extensive protrusions. (D) Quantification of long protrusions shown in panel C, defined as 30 µm or longer, extending from each spheroid after control and inhibitor treatments. Data are based on pooled data from 3 independent experiments with at least 3 spheroids per experiment; similar results were obtained in all 3 experiments. Statistical analysis by one-way ANOVA with Dunnett’s test in comparison to the DMSO control: **** p < 0.0001, N = 3, n = 3–7. Mean value ± SEM. Scale bars: (A) 100 µm, (C) 30 µm.
Figure 5
Figure 5
Key role of attachment via α2β1 integrin in collagen displacement, and comparison of contributions of proteases versus myosin contractility in collagen displacement and invasion. (A) Representative images of inhibition by integrin β1 and α2β1 anti-functional antibodies of spheroid invasion into collagen gels compared to controls. Spheroids were treated with function-blocking antibodies to integrins and then imaged over 18 h. (B) Collagen translocation from time 0 to 18 h for each condition. (C) Representative images of spheroids after 18 h treatment with a broad protease inhibitor (BB-94), and/or myosin inhibitor (blebbistatin) and their effects on cell protrusions and invasion. (D) Collagen displacement after treatment with broad-spectrum protease inhibitors, tissue inhibitors of metalloproteinases (TIMPs 2 and 3), contractility inhibitors of myosin II and ROCK, and combinations of BB-94 and GM6001 with blebbistatin. Statistical analysis by one-way ANOVA with Dunnett’s test in comparison to the DMSO control: **** p < 0.0001, *** p < 0.0008, N = 3, n = 3–7. Mean value ± SEM. Scale bar: 100 µm.
Figure 6
Figure 6
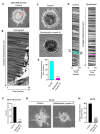
Composition of the very long protrusions extending from spheroids through the BM into collagen matrix. (A) Representative image of a long cellular protrusion into a 3D collagen gel by electron microscopy, revealing organelles including endoplasmic reticulum (ER) and mitochondria. (B) Representative images of immunofluorescence localization of various organelles and cytoskeletal proteins analyzed in the inhibition studies cited previously or observed by electron-microscopy imaging; green, phalloidin to stain F-actin; magenta, the indicated component; blue, nuclei. Scale bars: (A) 2 µm; (B) 10 µm.
Figure 7
Figure 7
Schematic summary. See text in Discussion for details.

References

    1. Siegel R.L., Miller K.D., Jemal A. Cancer statistics, 2019. CA Cancer J. Clin. 2019;69:7–34. doi: 10.3322/caac.21551. - DOI - PubMed
    1. Gerstberger S., Jiang Q., Ganesh K. Metastasis. Cell. 2023;186:1564–1579. doi: 10.1016/j.cell.2023.03.003. - DOI - PMC - PubMed
    1. Fares J., Fares M.Y., Khachfe H.H., Salhab H.A., Fares Y. Molecular principles of metastasis: A hallmark of cancer revisited. Signal Transduct. Target Ther. 2020;5:28. doi: 10.1038/s41392-020-0134-x. - DOI - PMC - PubMed
    1. Friedl P., Alexander S. Cancer invasion and the microenvironment: Plasticity and reciprocity. Cell. 2011;147:992–1009. doi: 10.1016/j.cell.2011.11.016. - DOI - PubMed
    1. Sekiguchi R., Yamada K.M. Basement Membranes in Development and Disease. Curr. Top. Dev. Biol. 2018;130:143–191. doi: 10.1016/bs.ctdb.2018.02.005. - DOI - PMC - PubMed

Publication types

LinkOut - more resources