

Experimental and Simulation Study of Solar-Powered Air-Gap Membrane Distillation Technology for Water Desalination
- PMID: 37887993
- PMCID: PMC10608935
- DOI: 10.3390/membranes13100821
Experimental and Simulation Study of Solar-Powered Air-Gap Membrane Distillation Technology for Water Desalination
Abstract
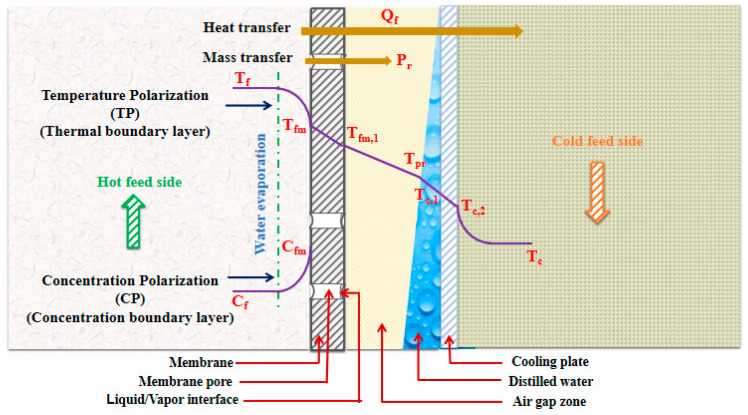
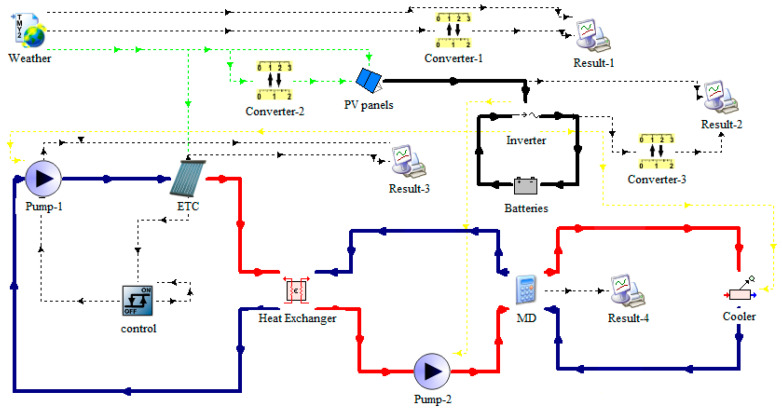
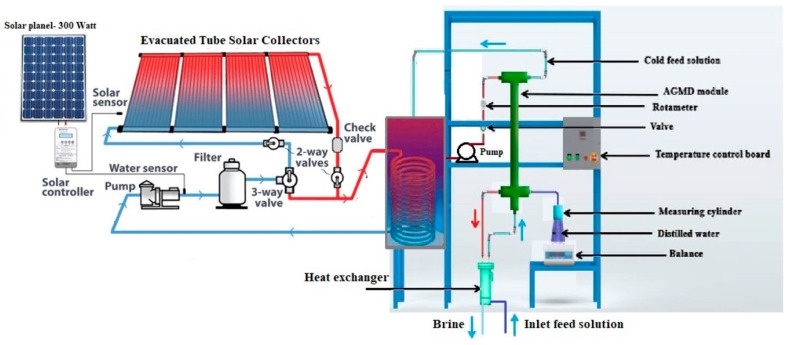
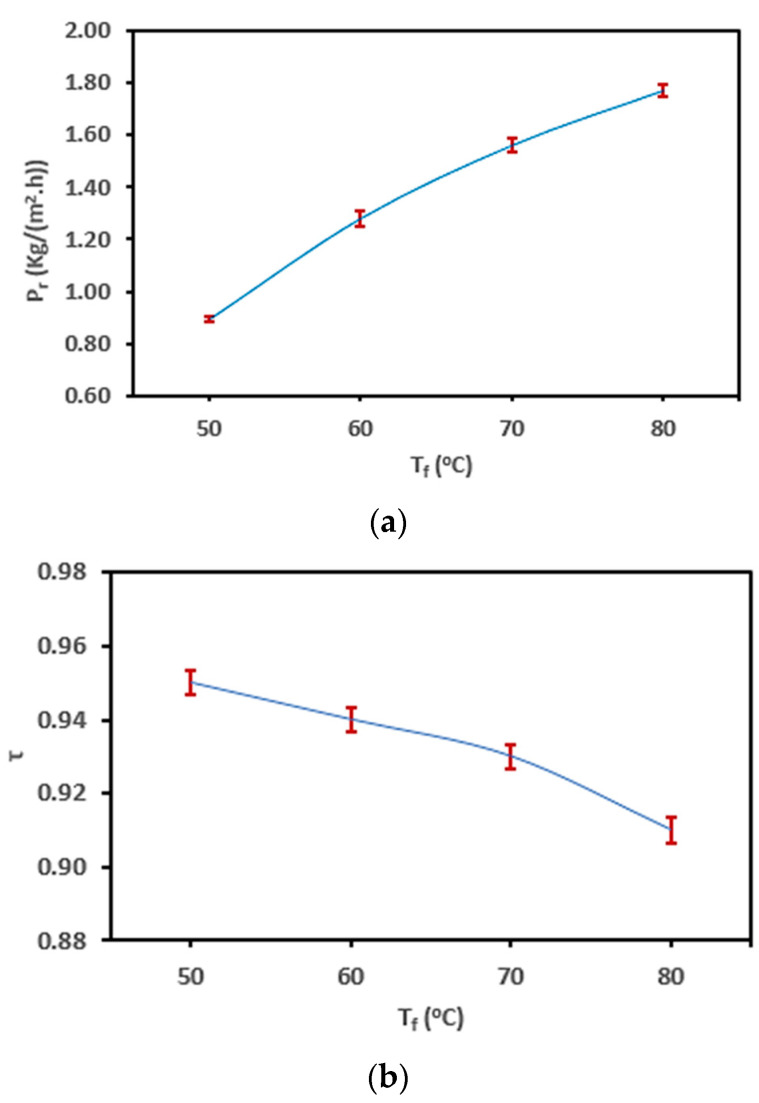
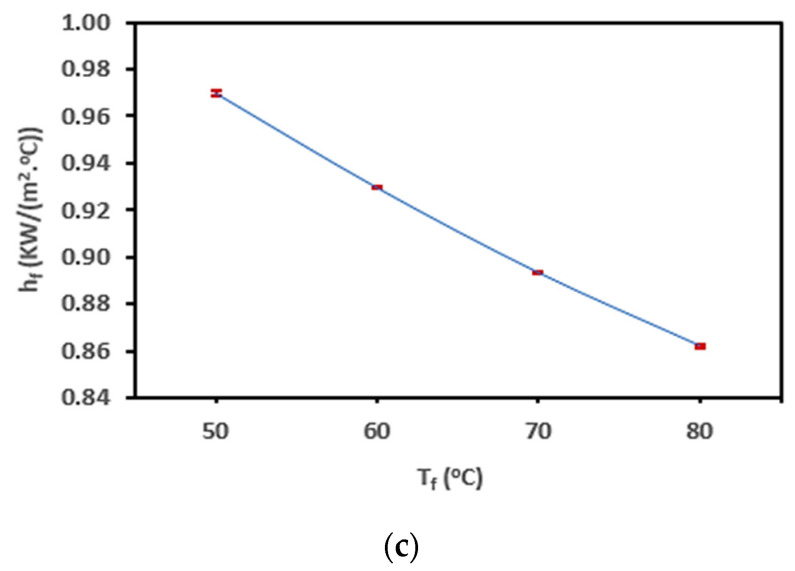
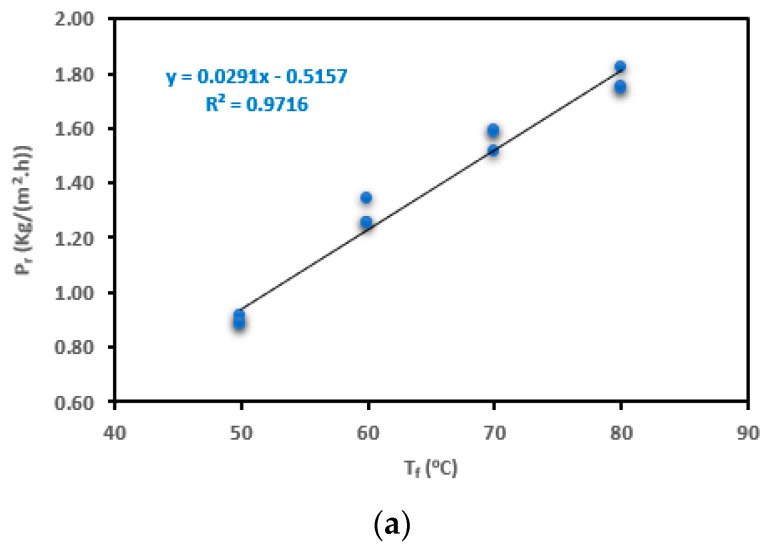
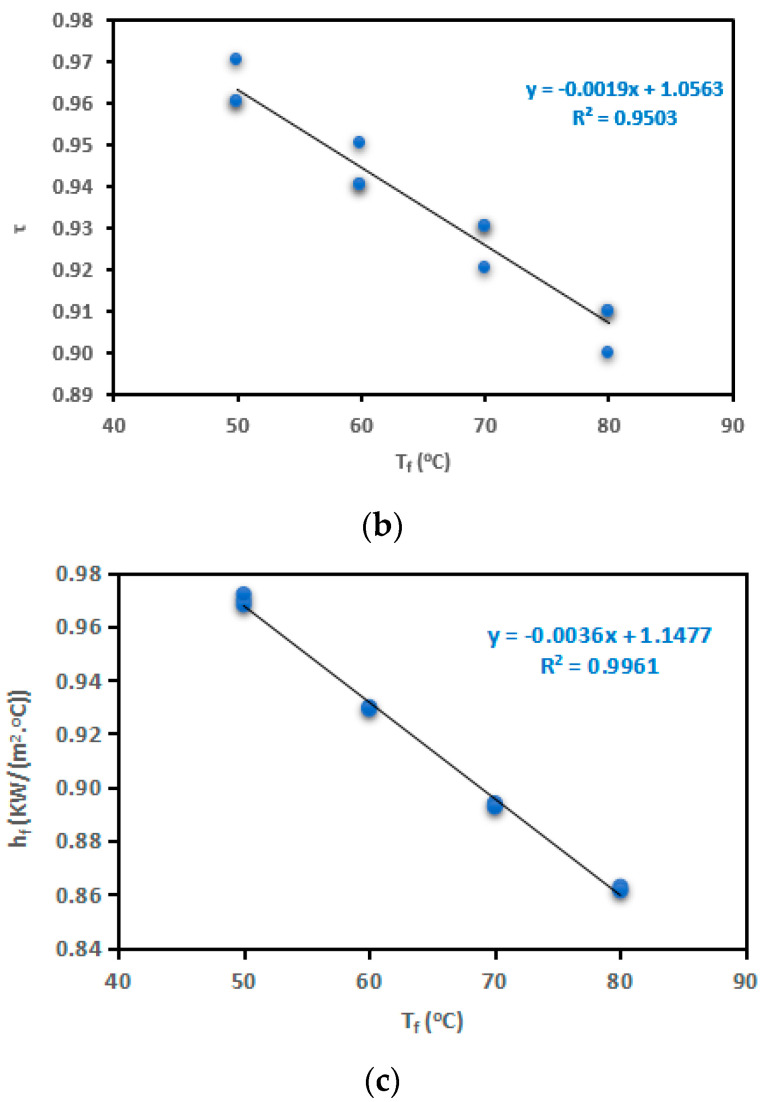
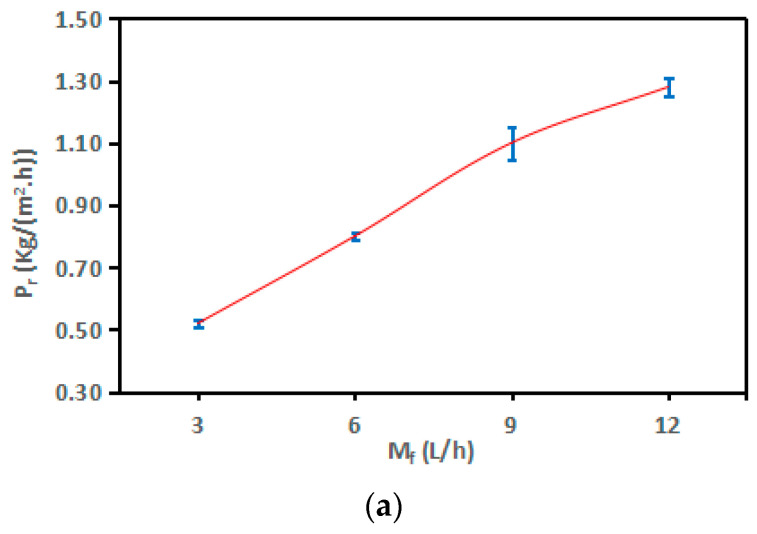
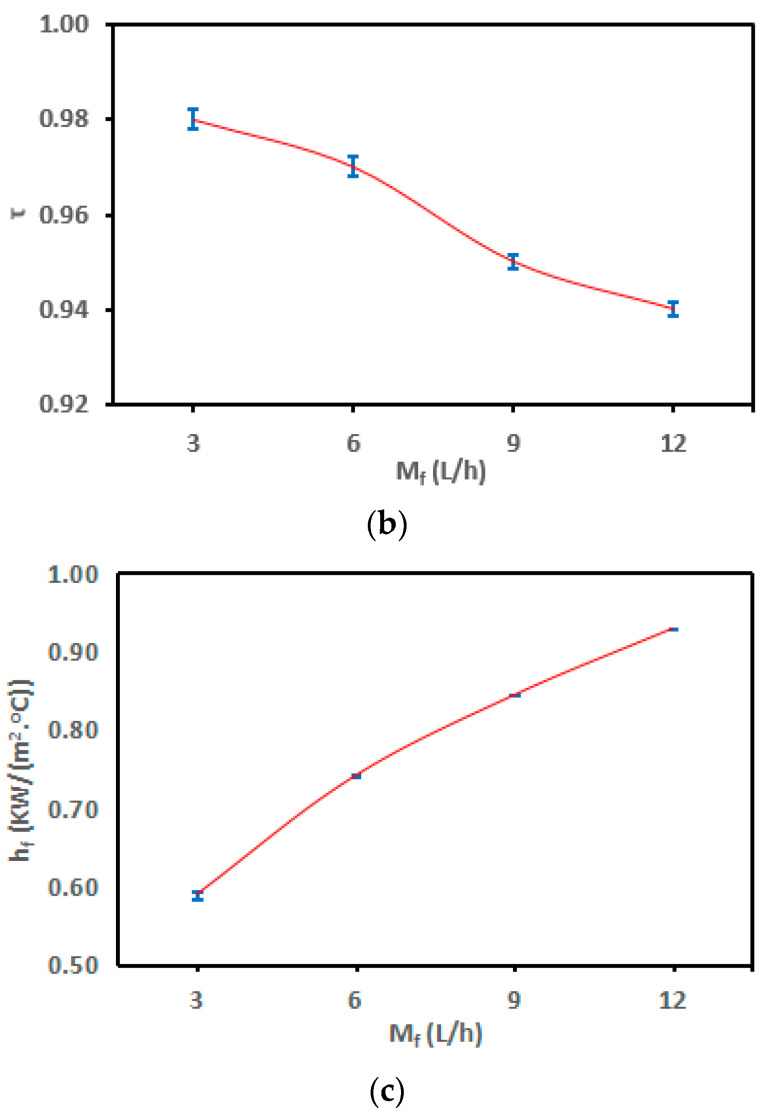
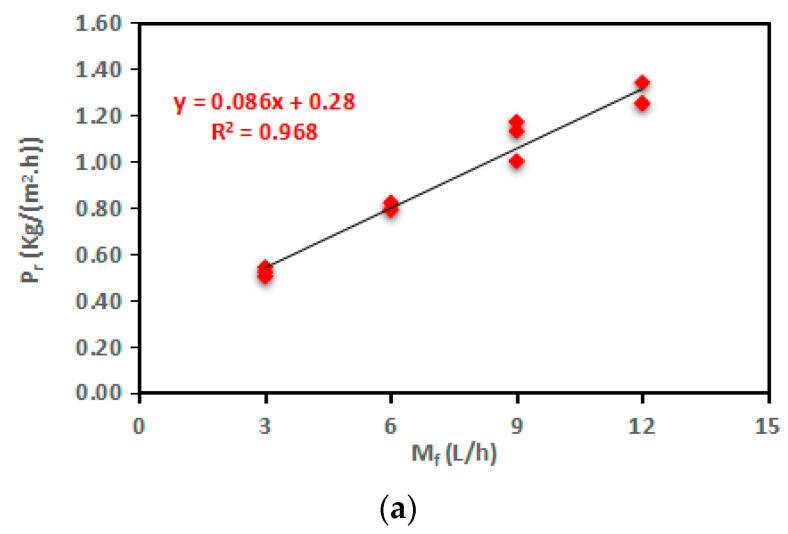
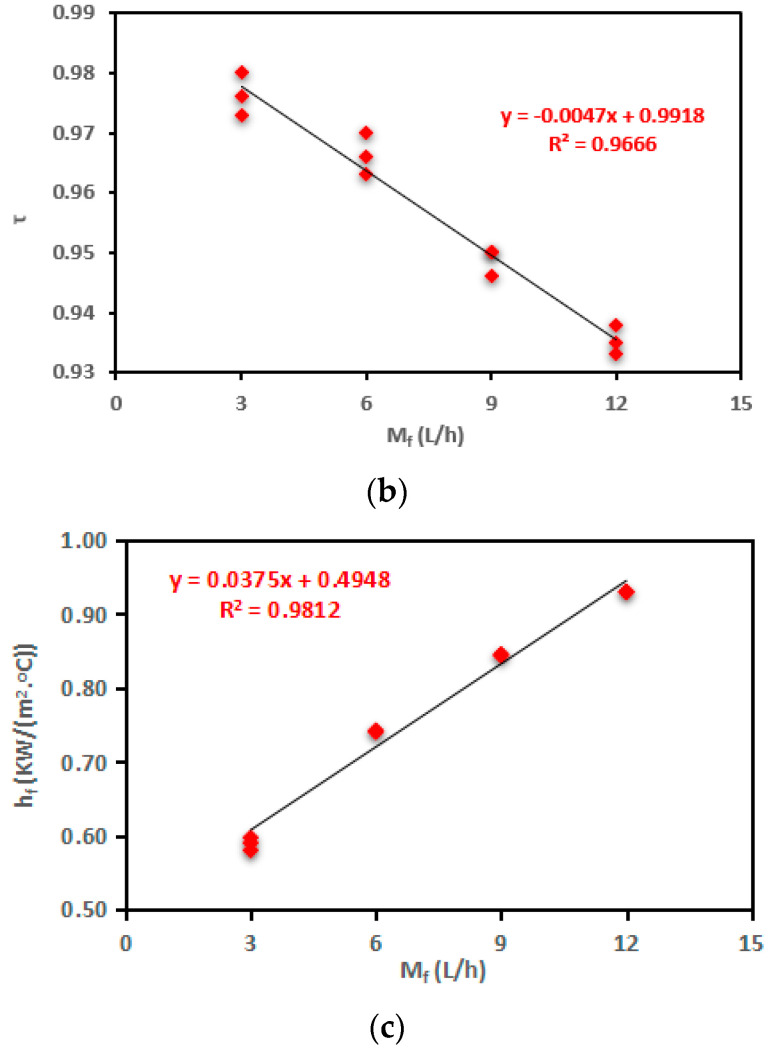
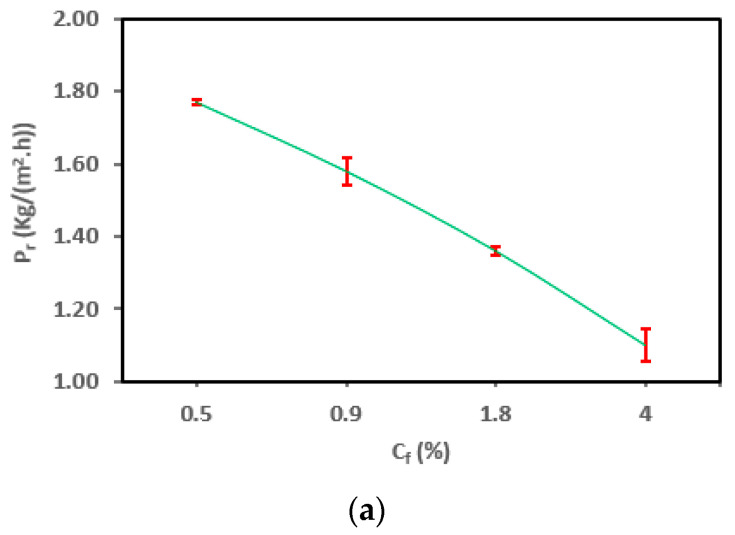
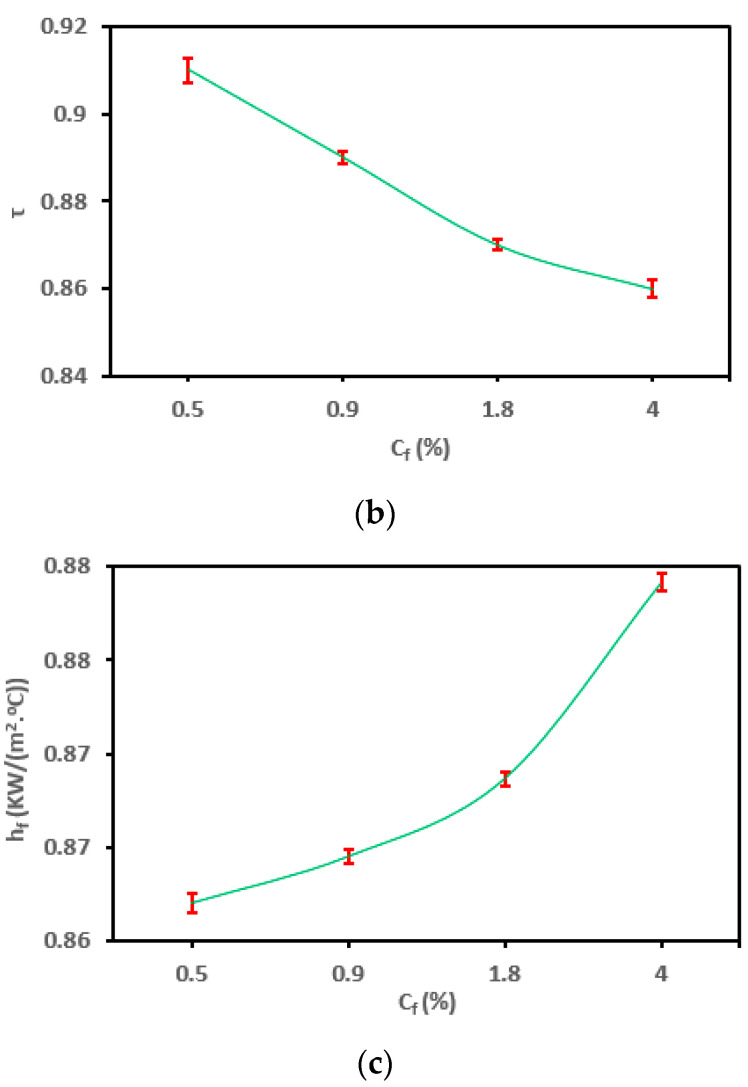
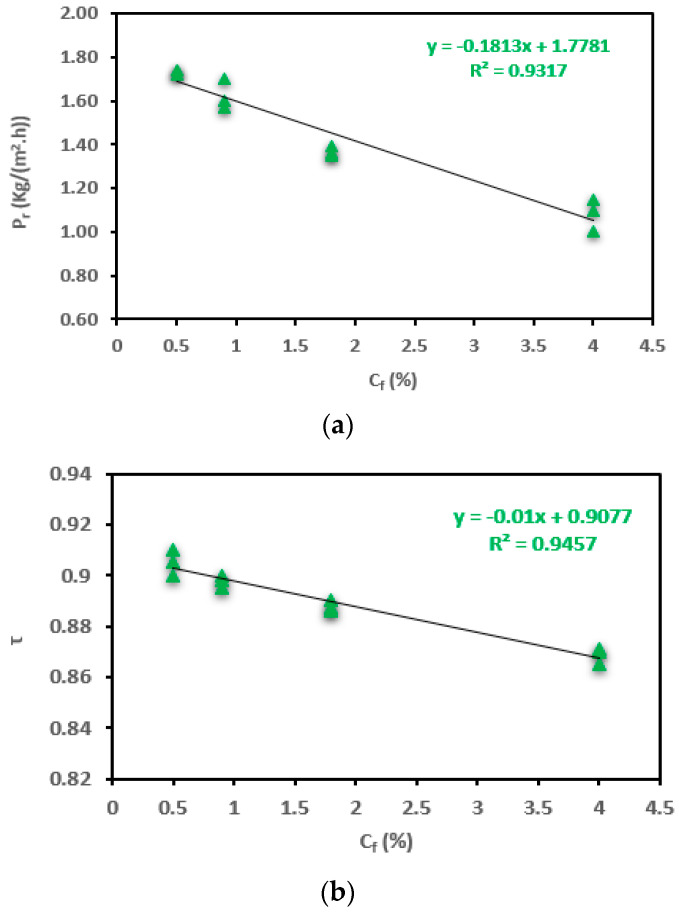
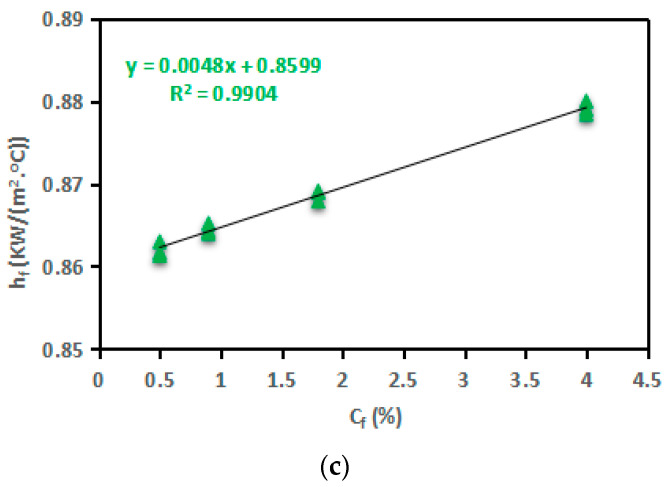
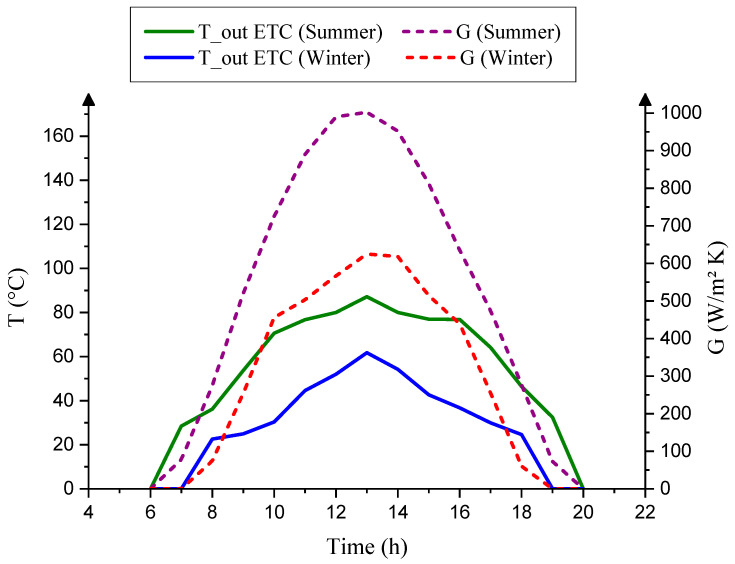
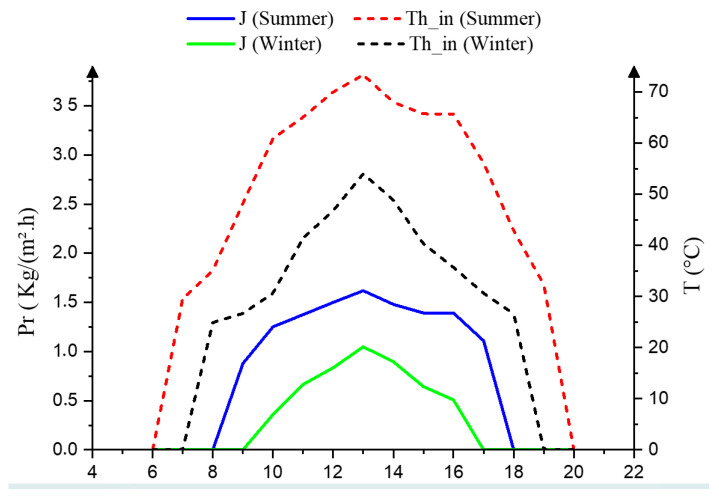
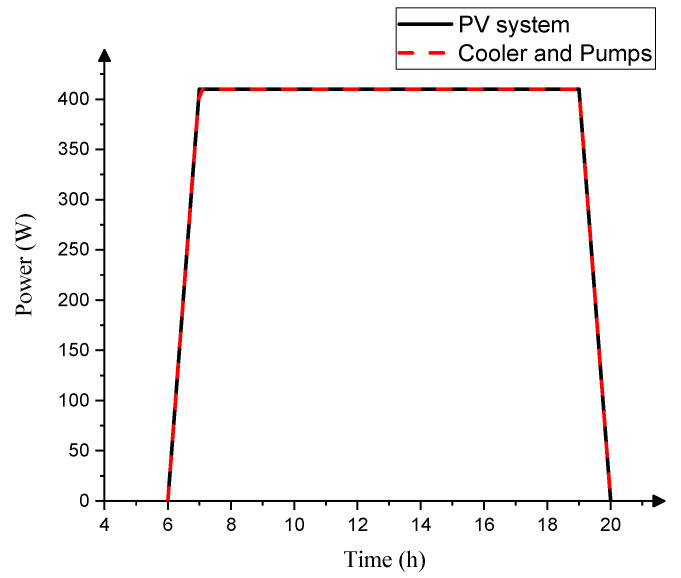
This work aimed to investigate temperature polarization (TP) and concentration polarization (CP), which affect solar-powered air-gap membrane distillation (SP-AGMD) system performance under various operating conditions. A mathematical model for the SP-AGMD system using the experimental results was performed to calculate the temperature polarization coefficient (τ), interface temperature (Tfm), and interface concentration (Cfm) at various salt concentrations (Cf), feed temperatures (Tf), and flow rates (Mf). The system of SP-AGMD was simulated using the TRNSYS program. An evacuated tube collector (ETC) with a 2.5 m2 surface area was utilized for solar water heating. Electrical powering of cooler and circulation water pumps in the SP-AGMD system was provided using a photovoltaic system. Data were subjected to one-way analysis of variance (ANOVA) and Spearman's correlation analysis to test the significant impact of operating conditions and polarization phenomena at p < 0.05. Statistical analysis showed that Mf induced a highly significant difference in the productivity (Pr) and heat-transfer (hf) coefficients (p < 0.001) and a significant difference in τ (p < 0.05). Great F-ratios showed that Mf is the most influential parameter. Pr was enhanced by 99% and 146%, with increasing Tf (60 °C) and Mf (12 L/h), respectively, at a stable salt concentration (Cf) of 0.5% and a cooling temperature (Tc) of 20 °C. Also, the temperature increased to 85 °C when solar radiation reached 1002 W/m2 during summer. The inlet heat temperature of AGMD increased to 73 °C, and the Pr reached 1.62 kg/(m2·h).
Keywords: AGMD; Spearman’s correlation analysis; evacuated tube collector; mathematical modeling; polarization phenomena.
Conflict of interest statement
The authors declare no conflict of interest.
Figures
References
-
- Zhang Y., Peng Y., Ji S., Li Z., Chen P. Review of thermal efficiency and heat recycling in membrane distillation processes. Desalination. 2015;367:223–239. doi: 10.1016/j.desal.2015.04.013. - DOI
-
- Mabrouk A.N., Elhenaw Y., Abdelkader M., Shatat M. The impact of baffle orientation on the performance of the hollow fiber membrane distillation. Desalination Water Treat. 2017;58:35–45. doi: 10.5004/dwt.2017.0030. - DOI
-
- Abu-Zeid M.A.E.-R., ElMasry G. Experimental evaluation of two consecutive air-gap membrane distillation modules with heat recovery. Water Sci. Technol. Water Supply. 2020;20:1678–1691. doi: 10.2166/ws.2020.077. - DOI
-
- Abu-Zeid M.E.R., Lu X., Zhang S. Influence of Module Length on Water Desalination Using Air Gap Membrane Distillation Process: An Experimental Comparative Study. Arab. J. Sci. Eng. 2021;44:2445–2451. doi: 10.1007/s13369-021-05628-1. - DOI
Grants and funding
LinkOut - more resources
Full Text Sources
Research Materials
Miscellaneous
