. 2023 Oct 12;14(10):513.
doi: 10.3390/jfb14100513.

Hst1/Gel-MA Scaffold Significantly Promotes the Quality of Osteochondral Regeneration in the Temporomandibular Joint

Affiliations

Hst1/Gel-MA Scaffold Significantly Promotes the Quality of Osteochondral Regeneration in the Temporomandibular Joint

Yiyang Du et al. J Funct Biomater. .

Abstract

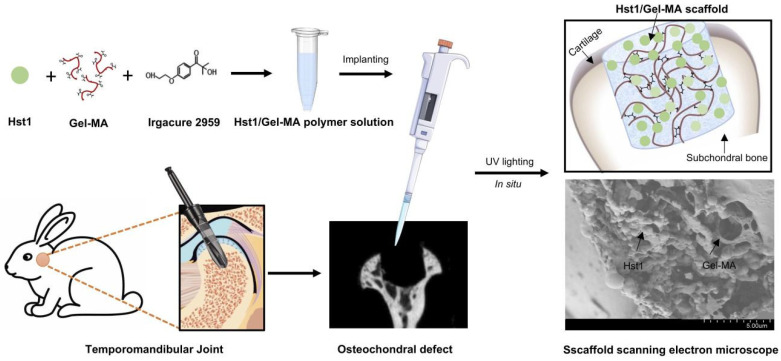
Objective: Our aim was to evaluate the capacity of the human salivary histatin-1-functionalized methacrylic gelatin scaffold to control osteochondral tissue regeneration and repair in vivo in rabbits with major temporomandibular joint dimensional abnormalities.

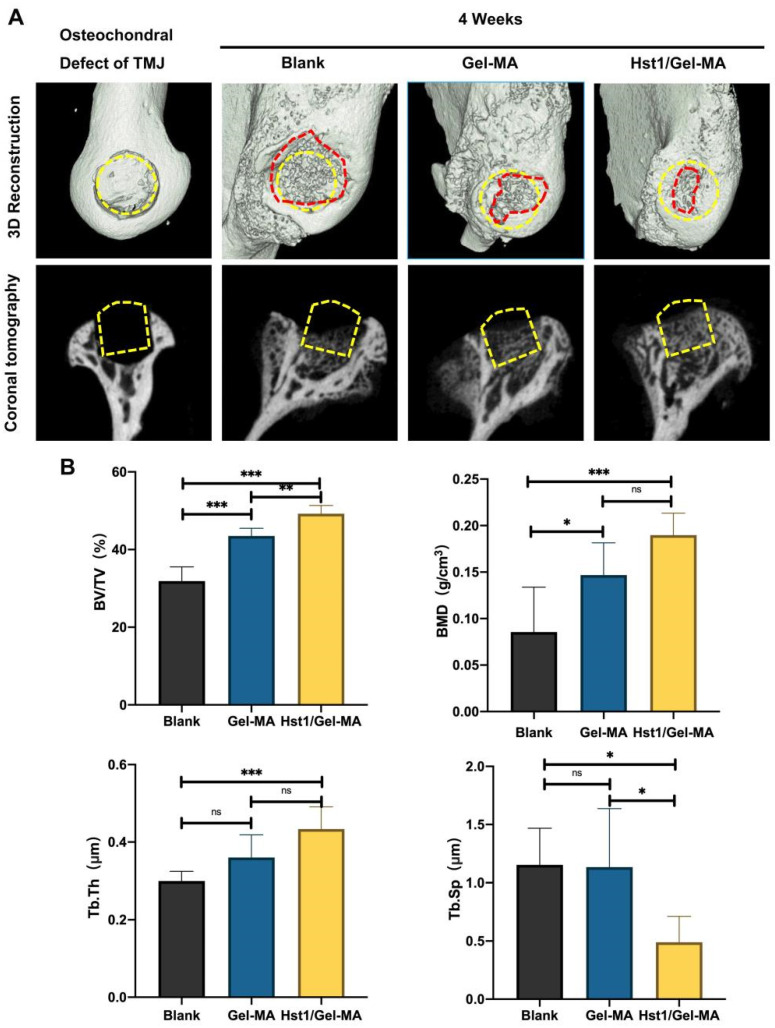
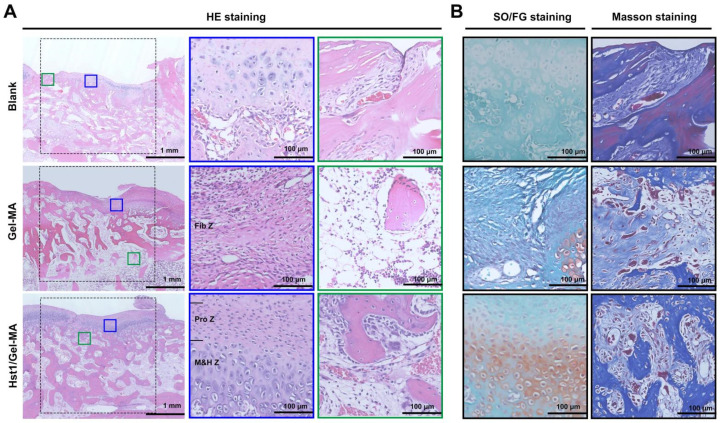
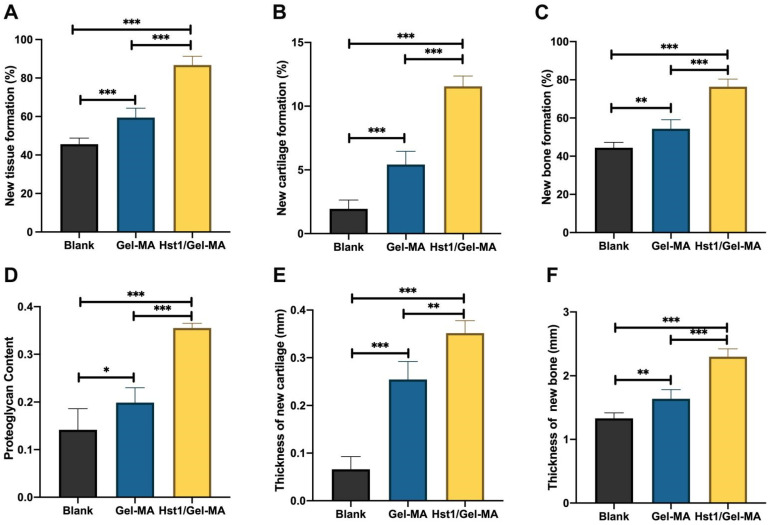
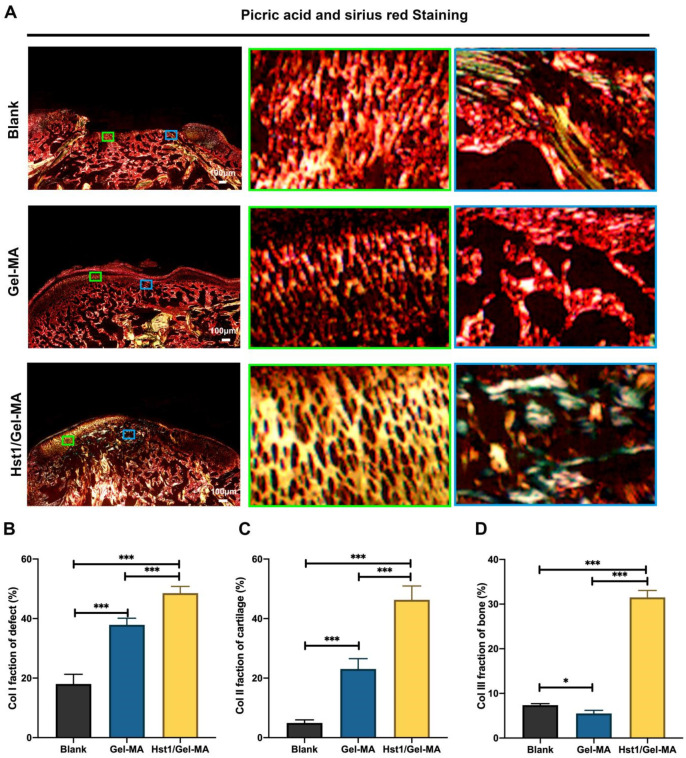
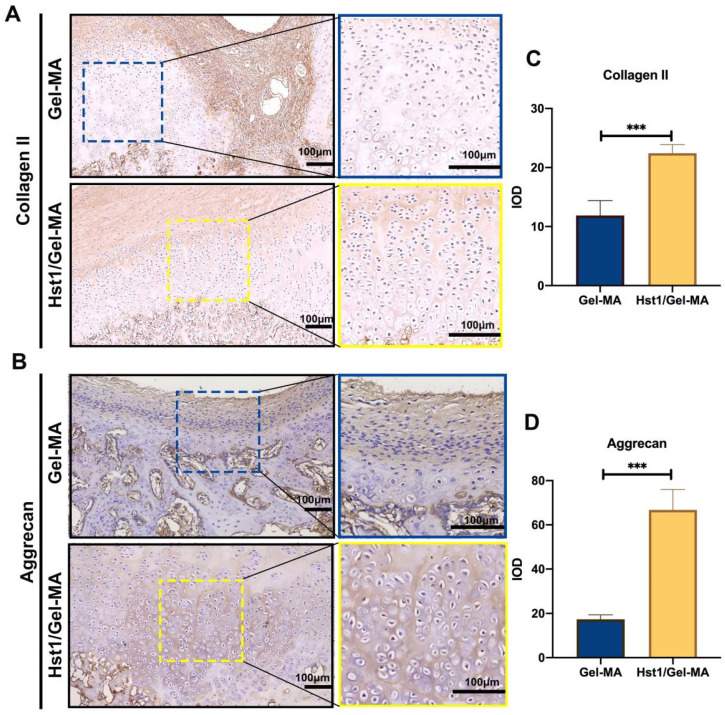
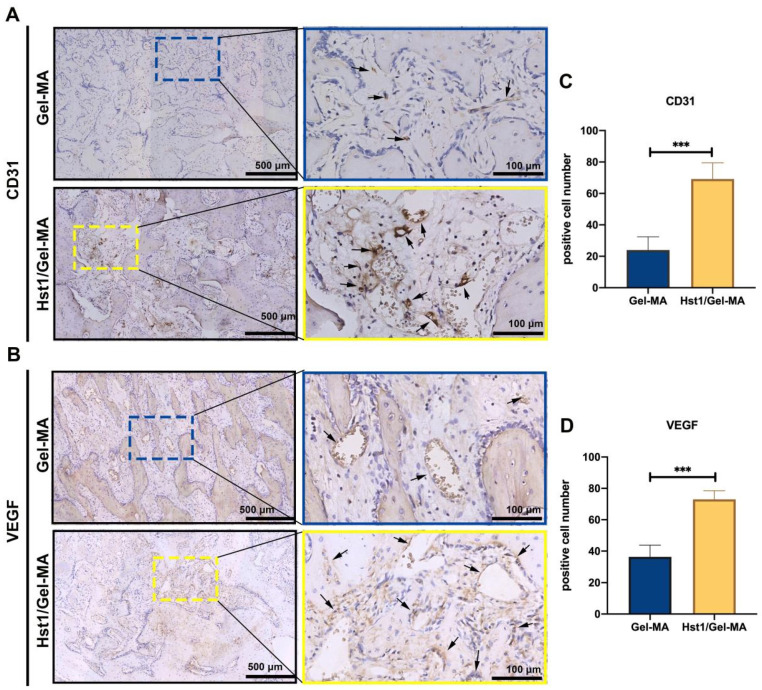
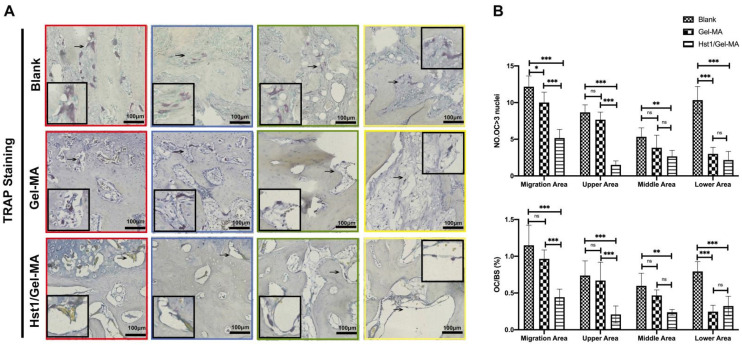
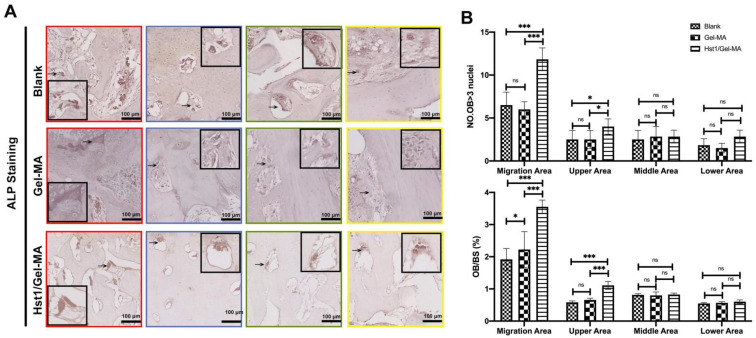
Materials and methods: In order to compare human salivary histatin-1-functionalized methacrylic gelatin scaffolds to the Blank and Gel-MA hydrogel groups, scaffolds were implanted into osteochondral lesions of a critical size (3 × 3 mm) in the anterior region of the condyle of the temporomandibular joint in New Zealand white rabbits. At 4 weeks after implantation, the repair was evaluated using macroscopic examination, histology, and micro-CT analysis.

Results: In the comparison of the composite scaffold group with the Blank and Gel-MA groups, analysis of the healed tissue revealed an improved macroscopic appearance in the composite scaffold group. Regeneration was induced by host cell migration in the Hst1/Gel-MA scaffold group.

Conclusions: The current study offers a viable method for in vivo cartilage repair that does not require cell transplantation. Future clinical applications of this strategy's optimization have many potential advantages.

Keywords: cartilage; in vivo; osteochondral; tissue engineering.


Conflict of interest statement

The authors have stated that they have no possible conflicts of interest in relation to the research, writing, or publishing of this paper.

Figures

Scheme 1
Scheme 1
Procedures of Hst1/Gel-MA scaffold implantation in rabbit mandibular condylar osteochondral defect (3 mm × 3 mm).
Figure 1
Figure 1
Schematic diagram of subchondral bone division. The red frame is defined as the migration area, located at the lower part of the cartilage at the edge of the defect. The green frame is defined as the middle area, located in the center of the defect. The blue frame is defined as the upper area, located in the upper part of the subchondral bone. The yellow box is defined as the lower area, located at bottom of the subchondral bone defect.
Figure 2
Figure 2
Representative micro-CT images and quantitative morphometric analysis of rabbit mandibular condylar osteochondral defects. (A) Three-dimensional reconstruction and representative coronal images of the osteochondral defect model, in which yellow circles and boxes indicate the extent of the original defect and red dashed lines show the extent of the defect at 4 weeks. (B) Metrological analysis of bone volume/total volume (BV/TV), trabecular thickness (Tb.Th), trabecular spacing (Tb. Sp), and bone mineral density (BMD). Error bars are mean ± SD (n = 6, * p < 0.05, ** p < 0.01, and *** p < 0.001).
Figure 3
Figure 3
HE, SO/FG, and Masson staining of rabbit mandibular condylar osteochondral defects. (A) HE staining. Black dashed boxes show the extent of the original defects (3 mm × 3 mm), blue solid boxes are magnified images of newly formed articular cartilage, and green solid boxes are magnified images of newly formed subchondral bone. (B) SO/FG staining of new cartilage center, Masson staining of newly formed subchondral bone.
Figure 4
Figure 4
Histological evaluation of rabbit condylar osteochondral defects at 4 weeks postoperative. (A) New tissue formation, (B) new cartilage formation, (C) new bone formation, (D) evaluation of proteoglycans in the cartilage matrix, (E) thickness of new cartilage, (F) thickness of new bone. Error bars are mean ± SD (n = 6, * p < 0.05, ** p < 0.01, and *** p < 0.001).
Figure 5
Figure 5
Polarized light microscopy images of Sirius red-stained condylar osteochondral defects at 4 weeks postoperative. (A) Polarized light Sirius red staining microscopy. The solid green box shows the distribution of Col II (colorful reticular distribution) in the new cartilage and the solid blue box shows the distribution of Col III (greenish) in the new subchondral bone. (B) Metrological analysis of the Col I fraction of defect. (C) Metrological analysis of the Col II fraction of cartilage. (D) Metrological analysis of the Col III fraction of the subchondral bone. Error bars are mean ± SD (n = 6, * p < 0.05, and *** p < 0.001).
Figure 6
Figure 6
Immunohistochemical micrographs and quantitative analysis of cartilage matrix markers Col II and aggrecan were performed in the Gel-MA and Hst1/Gel-MA groups at 4 weeks postoperative. (A) Immunohistochemical micrographs of collagen II. (B) Immunohistochemical micrographs of aggrecan. (C) Expression of collagen II at 4 weeks. (D) Expression of aggrecan at 4 weeks. Error bars are mean ± SD (n = 6, *** p < 0.001).
Figure 7
Figure 7
Immunohistochemical micrographs and quantitative analysis of angiogenic markers CD31 and VEGF were performed in the Gel-MA and Hst1/Gel-MA groups at 4 weeks postoperative. Black arrows indicate positively stained vessels. (A) Immunohistochemical micrographs of CD31. (B) Immunohistochemical micrographs of VEGF. (C) Expression of CD31 at 4 weeks. (D) Expression of VEGF at 4 weeks. Error bars are mean ± SD (n = 6, and *** p < 0.001).
Figure 8
Figure 8
TRAP staining of micrographs and quantitative analysis of osteoclasts were performed in mandibular condylar subchondral bone at 4 weeks postoperative. Red boxes represent areas of cartilage migration. Blue boxes represent the upper part of the defect centre. Green boxes represent the middle part of the defect centre. Yellow boxes represent the lower part of the defect centre. Black arrows indicate positive staining areas. (A) TRAP staining of micrographs of the subchondral bone. (B) Metrological analysis of osteoclasts. Error bars are mean ± SD (n = 6, * p < 0.05, ** p < 0.01, and *** p < 0.001).
Figure 9
Figure 9
ALP staining of micrographs and quantitative analysis of osteoblasts were performed for mandibular condylar subchondral bone at 4 weeks postoperative. Red boxes represent areas of cartilage migration. Blue boxes represent the upper part of the defect centre. Green boxes represent the middle part of the defect centre. Yellow boxes represent the lower part of the defect centre. Black arrows indicate positive staining areas. (A) ALP staining of micrographs of the subchondral bone. (B) Metrological analysis of osteoblasts. Error bars are mean ± SD (n = 6, * p < 0.05, *** p < 0.001).

Similar articles

Cited by

References

    1. Symons N.B.B. The development of the human mandibular joint. J. Anat. 1952;86:326–332. - PMC - PubMed
    1. Chiang H., Jiang C.C. Repair of Articular Cartilage Defects: Review and Perspectives. J. Formos. Med. Assoc. 2009;108:87–101. doi: 10.1016/S0929-6646(09)60039-5. - DOI - PubMed
    1. Dormer N.H., Busaidy K., Berkland C.J., Detamore M.S. Osteochondral interface regeneration of rabbit mandibular condyle with bioactive signal gradients. J. Oral Maxillofac. Surg. 2011;69:e50–e57. doi: 10.1016/j.joms.2010.12.049. - DOI - PMC - PubMed
    1. Newman A.P. Articular Cartilage Repair. Am. J. Sports Med. 1998;26:309–324. doi: 10.1177/03635465980260022701. - DOI - PubMed
    1. Hunziker E.B. Articular cartilage repair: Basic science and clinical progress. A review of the current status and prospects. Osteoarthr. Cartil. 2002;10:432–463. doi: 10.1053/joca.2002.0801. - DOI - PubMed

LinkOut - more resources