. 2023 Oct 20;9(10):233.
doi: 10.3390/jimaging9100233.

Super-Resolved Dynamic 3D Reconstruction of the Vocal Tract during Natural Speech

Affiliations

Super-Resolved Dynamic 3D Reconstruction of the Vocal Tract during Natural Speech

Karyna Isaieva et al. J Imaging. .

Abstract

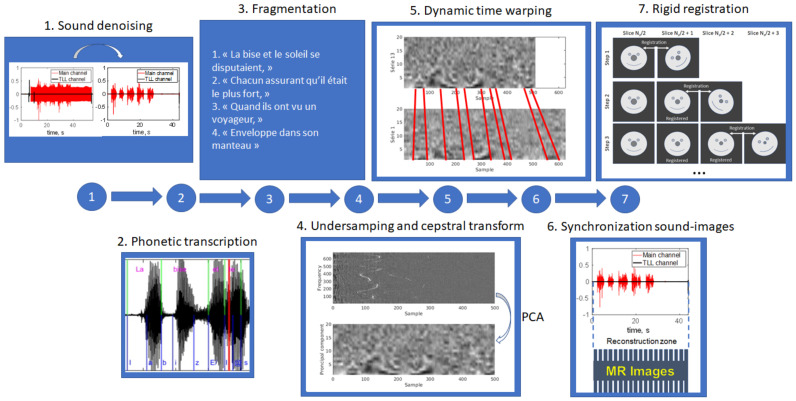
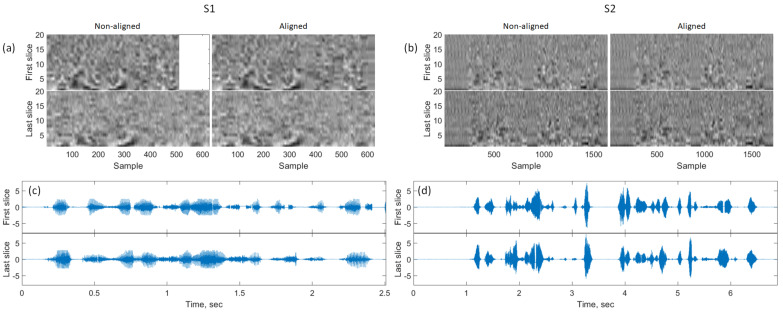
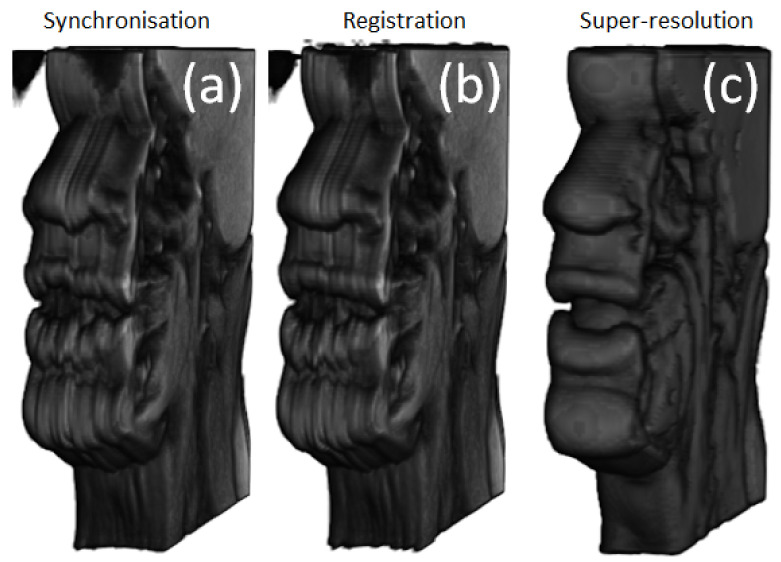
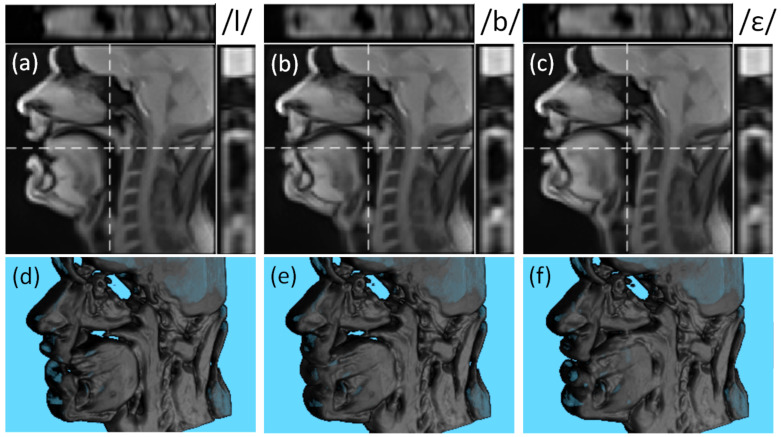
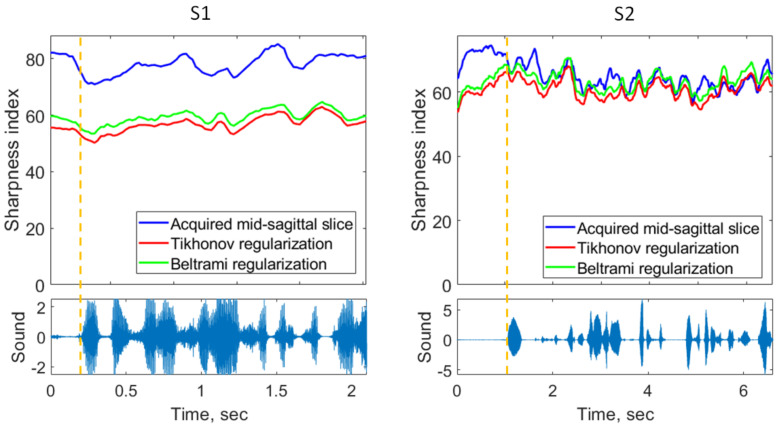
MRI is the gold standard modality for speech imaging. However, it remains relatively slow, which complicates imaging of fast movements. Thus, an MRI of the vocal tract is often performed in 2D. While 3D MRI provides more information, the quality of such images is often insufficient. The goal of this study was to test the applicability of super-resolution algorithms for dynamic vocal tract MRI. In total, 25 sagittal slices of 8 mm with an in-plane resolution of 1.6 × 1.6 mm2 were acquired consecutively using a highly-undersampled radial 2D FLASH sequence. The volunteers were reading a text in French with two different protocols. The slices were aligned using the simultaneously recorded sound. The super-resolution strategy was used to reconstruct 1.6 × 1.6 × 1.6 mm3 isotropic volumes. The resulting images were less sharp than the native 2D images but demonstrated a higher signal-to-noise ratio. It was also shown that the super-resolution allows for eliminating inconsistencies leading to regular transitions between the slices. Additionally, it was demonstrated that using visual stimuli and shorter text fragments improves the inter-slice consistency and the super-resolved image sharpness. Therefore, with a correct speech task choice, the proposed method allows for the reconstruction of high-quality dynamic 3D volumes of the vocal tract during natural speech.

Keywords: dynamic MRI; magnetic resonance imaging; speech; super-resolution; vocal tract.


Conflict of interest statement

The authors declare no conflict of interest.

Figures

Figure 1
Figure 1
Schematic illustration of the acquisition strategies employed for subjects S1 and S2. The blue rectangles denote slices.
Figure 2
Figure 2
Schematic illustration of the pre-processing pipeline.
Figure 3
Figure 3
The ROIs used for the rigid registration (yellow), as the background region (red), and as the foreground region (green).
Figure 4
Figure 4
Illustration of the sound alignment quality. (a,b): First 20 principal components of the cepstrum for S1 and S2, correspondingly. (c,d): Examples of sound recordings after the dynamic time warping. Note the white spaces are present in a few places due to the piece-wise alignment.
Figure 5
Figure 5
Examples of visualization of the alignment quality in two different coronal planes: the glottis region (on the left for each subject) and the lips region (on the right for each subject) for S1 and S2. The non-aligned slices are on the left of each pair and the aligned ones are on the right of each pair.
Figure 6
Figure 6
A rendered 3D volume of S1 illustrating different processing steps. (a) After temporal alignment only. (b) After rigid registration. (c) After super-resolution application.
Figure 7
Figure 7
Examples of the reconstructed super-resolved 3D volume of S1 for phonemes/l/ (a,d), /b/ (b,e), and /ε/ (c,f). The subfigures (ac) show the mid-sagittal slice, the central axial slice (on the top and denoted as the horizontal dashed line), and the central coronal slice (on the right and denoted as the vertical dashed line). The subfigures (df) demonstrate the rendered super-resolved 3D volumes.
Figure 8
Figure 8
Examples of super-resolved mid-sagittal slices of S2 (a,c) in comparison to the native 2D mid-sagittal slices (b,d). The Beltrami regularization was used for the super-resolution.
Figure 9
Figure 9
Examples of the super-resolution failure for S1: super-resolved mid-sagittal slices (a,d), native 2D mid-sagittal slices (b,e), and adjacent to the mid-sagittal slices (c,f). Beltrami regularization was used for the super-resolution. The red arrows point to the blurry regions discussed in the text.
Figure 10
Figure 10
Upper plots: examples of sharpness index change in time for mid-sagittal slices of S1 and S2. Lower plots: corresponding sound recordings. The dashed vertical orange line shows the beginning of the speech.
Figure 11
Figure 11
Average and standard deviation of the sharpness index for each slice of S1 and S2.
Figure 12
Figure 12
Distributions of the smoothness metric S for the subjects S1 and S2. Note the vertical axis is in logarithmic scale.
Figure 13
Figure 13
Illustration of the smoothness evaluation steps on highly mobile and moderately mobile regions for S1. (a) Results of the Canny edge detection on the mid-sagittal slice image from the super-resolved volume with Tikhonov regularization. The yellow circle indicates the position of a highly mobile region (upper lip) corresponding to the curves (bd). (b) Pixel values (blue circles) and the smoothing spline fitting curve (red line) for fixed in-plane position for different slices extracted from the registered volume. (c) The same as (b) extracted from the super-resolved volume with Tikhonov regularization. (d) The same as (b) extracted from the super-resolved volume with Beltrami regularization. (eh): The same for a moderately mobile region in the tongue body. The values in the upper left corner correspond to the smoothness metrics.

References

    1. Lingala S.G., Sutton B.P., Miquel M.E., Nayak K.S. Recommendations for Real-Time Speech MRI. J. Magn. Reson. Imaging. 2016;43:28–44. doi: 10.1002/jmri.24997. - DOI - PMC - PubMed
    1. Katz W.F., Mehta S., Wood M., Wang J. Using Electromagnetic Articulography with a Tongue Lateral Sensor to Discriminate Manner of Articulation. J. Acoust. Soc. Am. 2017;141:EL57–EL63. doi: 10.1121/1.4973907. - DOI - PMC - PubMed
    1. Badin P. Fricative Consonants: Acoustic and X-Ray Measurements. J. Phon. 1991;19:397–408. doi: 10.1016/S0095-4470(19)30331-6. - DOI
    1. Al-hammuri K., Gebali F., Thirumarai Chelvan I., Kanan A. Tongue Contour Tracking and Segmentation in Lingual Ultrasound for Speech Recognition: A Review. Diagnostics. 2022;12:2811. doi: 10.3390/diagnostics12112811. - DOI - PMC - PubMed
    1. Fabre D., Hueber T., Girin L., Alameda-Pineda X., Badin P. Automatic Animation of an Articulatory Tongue Model from Ultrasound Images of the Vocal Tract. Speech Commun. 2017;93:63–75. doi: 10.1016/j.specom.2017.08.002. - DOI

LinkOut - more resources