. 2023 Oct 17;15(10):616.
doi: 10.3390/toxins15100616.

Crotoxin Modulates Macrophage Phenotypic Reprogramming

Affiliations

Crotoxin Modulates Macrophage Phenotypic Reprogramming

Camila Lima Neves et al. Toxins (Basel). .

Abstract

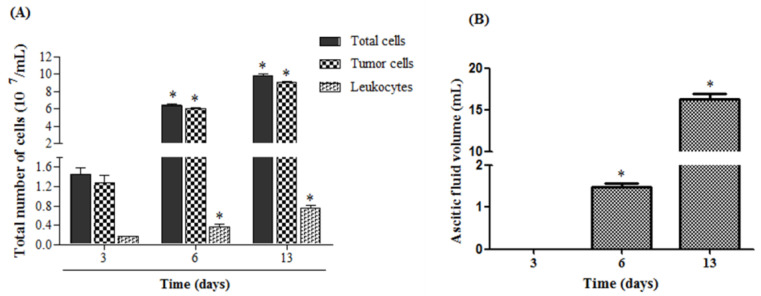
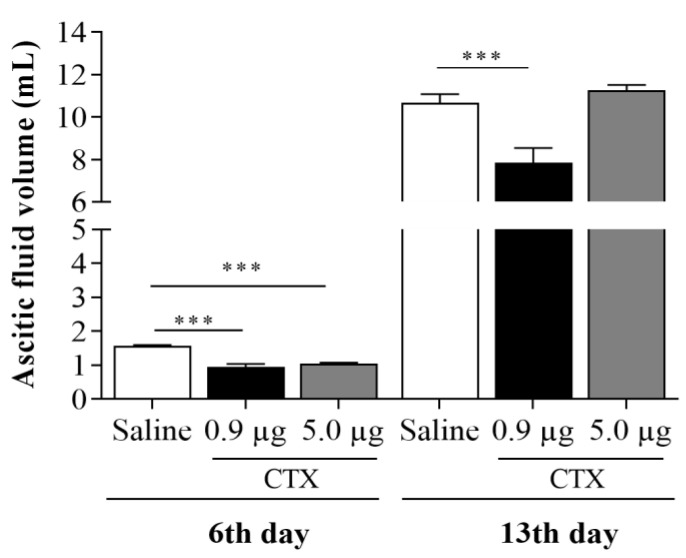
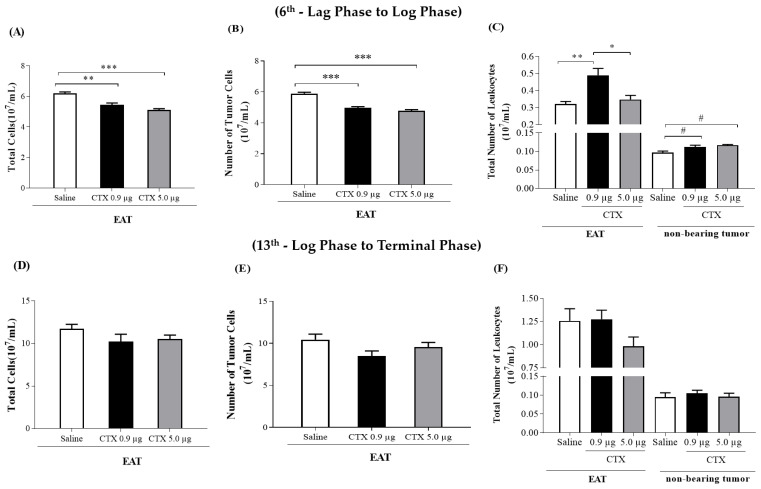
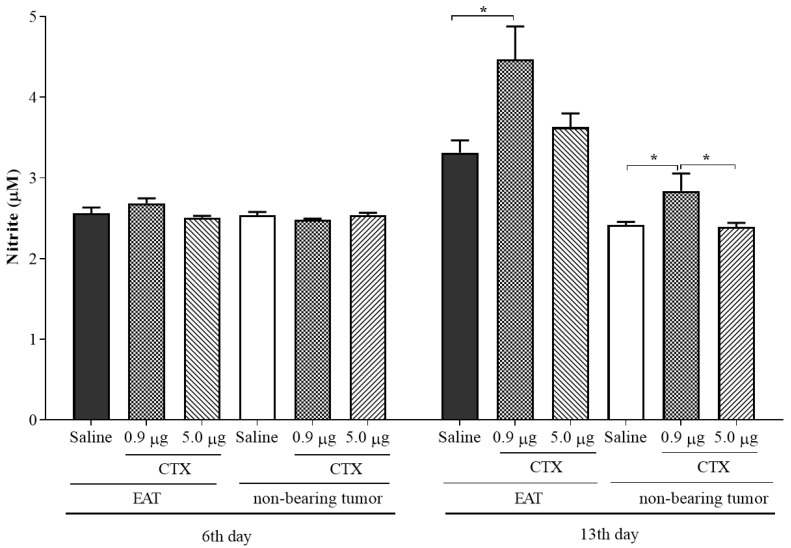
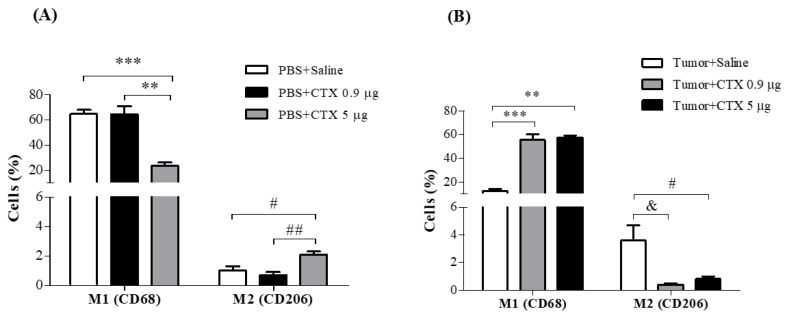
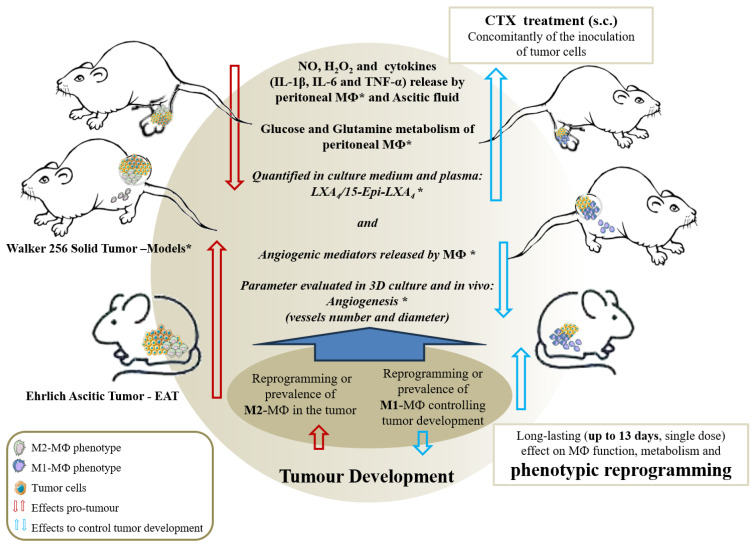
Macrophage plasticity is a fundamental feature of the immune response since it favors the rapid and adequate change of the functional phenotype in response to the pathogen or the microenvironment. Several studies have shown that Crotoxin (CTX), the major toxin of the Crotalus durissus terrificus snake venom, has a long-lasting antitumor effect both in experimental models and in clinical trials. In this study, we show the CTX effect on the phenotypic reprogramming of macrophages in the mesenchymal tumor microenvironment or those obtained from the peritoneal cavity of healthy animals. CTX (0.9 or 5 μg/animal subcutaneously) administered concomitantly with intraperitoneal inoculation of tumor cells (1 × 10⁷/0.5 mL, injected intraperitoneally) of Ehrlich Ascitic Tumor (EAT) modulated the macrophages phenotype (M1), accompanied by increased NO production by cells from ascites, and was evaluated after 13 days. On the other hand, in healthy animals, the phenotypic profile of macrophages was modulated in a dose-dependent way at 0.9 μg/animal: M1 and at 5.0 μg/animal: M2; this was accompanied by increased NO production by peritoneal macrophages only for the dose of 0.9 μg/animal of CTX. This study shows that a single administration of CTX interferes with the phenotypic reprogramming of macrophages, as well as with the secretory state of cells from ascites, influencing events involved with mesenchymal tumor progression. These findings may favor the selection of new therapeutic targets to correct compromised immunity in different systems.

Keywords: cytokines; immunomodulatory effect; macrophage plasticity; rattlesnake; tumor microenvironment.


Conflict of interest statement

The authors declare no conflict of interest. The funders had no role in the design of the study; in the collection, analyses or interpretation of data; in the writing of the manuscript; or in the decision to publish the results.

Figures

Figure 1
Figure 1
Temporal evolution of ascites induced by Ehrlich tumor cells. The animals were inoculated with EAT (1 × 10⁷ cells/0.5 mL), and after the 3rd, 6th and 13th day of tumor cell inoculation, it was determined in (A) the total and differential count (leukocyte and tumor) in a hemocytometer Neubauer and in (B) the volume of ascitic fluid collected from the abdominal cavity. Values are expressed as mean ± SEM of 3–4 animals per group. * p < 0.001, compared to the respective groups over the 3-day period.
Figure 2
Figure 2
Effect of CTX on the volume of the ascites fluid. The animals were inoculated with EAT (1 × 10⁷ cells/0.5 mL) and treated concomitantly with different doses of CTX (0.9 µg/animal and 5.0 µg/animal, in 100 µL of saline, s.c.) or saline (100 µL). On the 6th and 13th day of tumor cell inoculation, ascitic fluid was collected from the peritoneal cavity and the total volume was measured. *** p < 0.001 compared to the control group (EAT + saline) and the CTX-treated group. Values are expressed as mean ± SEM of 5–8 animals per group.
Figure 3
Figure 3
Effect of CTX on the number of cells obtained from EAT in mice. The animals were inoculated with EAT (1 × 10⁷ cells/0.5 mL PBS) or injected, i.p., with PBS and treated concomitantly with different doses of CTX (0.9 µg/animal and 5.0 µg/animal in 100 µL of saline, s.c.) or saline (100 µL). On the 6th or 13th day of the EAT inoculation, the total counts (A,D) of tumor cells (B,E) and leukocytes (C,F) were determined from the ascitic fluid and the peritoneal cavity (non-carrier animals) in a Neubauer hemocytometer. Values are expressed as mean ± SEM of 3–9 animals per group. * p < 0.05 compared to the CTX-treated group. ** p < 0.01 compared to the control group (EAT + saline). *** p < 0.001 compared to the control group (EAT + saline) and the CTX-treated group. # p < 0.05 compared to the control group (PBS + saline).
Figure 4
Figure 4
Effect of CTX on nitric oxide production. The animals were inoculated with EAT (1 × 10⁷ cells/0.5 mL PBS) or injected, i.p., with PBS (non-tumor-bearing animals) and treated concomitantly with different doses of CTX (0.9 µg/animal and 5.0 µg/animal in 100 µL saline, s.c.) or saline (100 µL). After the 6th or 13th day of tumor cell inoculation, the supernatant from each group was transferred to a reading plate and Griess reagent (1:1, v/v) was added. Then, the plate was read in an ELISA reader at 550 nm. The reading values were compared with a standard curve of sodium nitrite (NaNO2) and the results were expressed as µmoles of nitrite in the ascitic fluid (tumor-bearing animals) or in the peritoneal lavage of the non-tumor-bearing animals. Values are expressed as mean ± SEM of 4–9 animals per group. * p < 0.05, compared to the respective control (EAT + saline and PBS + saline) and the experimental groups treated with CTX.
Figure 5
Figure 5
Effect of CTX on macrophage reprogramming. (A) Animals injected intraperitoneally with PBS (0.5 mL) (non-tumor-bearing animal group) and (B) tumor-bearing animals group (inoculated with EAT 1 × 10⁷ cells/0.5 mL); both were treated concomitantly with different doses of CTX (0.9 and 5.0 µg/animal in 100 µL of saline, s.c.) or saline (100 µL). On the 13th day of inoculation with PBS or tumor cells and concomitant treatment with CTX, the adherent cells from the intraperitoneal cavity were incubated with different mAbs for the macrophage phenotypes (anti-CD45, anti-F4/80, anti-CD68 and anti-CD206) labeled with distinct fluorophores and analyzed by flow cytometry. Values are expressed as the percentage of positive cells ± SEM of 4–6 animals per group in the figures of M1 and M2 phenotypes. ** p < 0.05, compared to the group treated with the dose of CTX 0.9 µg/animal. # p < 0.05, compared to the control group (saline). & p < 0.01, compared to the control group (saline). ## p < 0.05, compared to the group treated with CTX. *** p < 0.001, compared to the control group (saline).
Figure 6
Figure 6
Scheme proposed for the importance of phenotypic reprogramming of macrophages induced by CTX in the tumor microenvironment. The data found in the present study demonstrate that CTX induces phenotypic reprogramming of macrophages, with a prevalence of M1 macrophages in the tumor microenvironment. This prevalent M1 profile agrees with the CTX-induced modifications on the metabolism and secretory activity of peritoneal macrophages obtained from tumor-bearing animals * [23,32]. The stimulatory action on the metabolism of macrophages was characterized by an increase in the release of H2O2, the production of NO, the secretion of pro-inflammatory cytokines (IL-1β, TNF-α and IL-6) and the increased maximum activity of hexokinase, glucose-6-phosphate dehydrogenase and citrate synthase, accompanied by an increased secretion of LXA4 and 15-Epi-LXA4 by these cells, also characterized in in vitro studies [30,36]. All these mediators lead to the inhibition of tumor development. The present study shows for the first time that CTX induces phenotypic reprogramming, explaining the metabolism and secretory activity of macrophages compatible with the M1 profile, as previously demonstrated, with long-lasting action, since they are observed up to 13 days after the administration of a single dose of toxin [37].

References

    1. Mantovani A., Schioppa T., Porta C., Allavena P., Sica A. Role of Tumor-Associated Macrophages in Tumor Progression and Invasion. Cancer Metastasis Rev. 2006;25:315–322. doi: 10.1007/s10555-006-9001-7. - DOI - PubMed
    1. Solinas G., Schiarea S., Liguori M., Fabbri M., Pesce S., Zammataro L., Pasqualini F., Nebuloni M., Chiabrando C., Mantovani A., et al. Tumor-Conditioned Macrophages Secrete Migration-Stimulating Factor: A New Marker for M2-Polarization, Influencing Tumor Cell Motility. J. Immunol. 2010;185:642–652. doi: 10.4049/jimmunol.1000413. - DOI - PubMed
    1. Allavena P., Mantovani A. Immunology in the Clinic Review Series; Focus on Cancer: Tumour-Associated Macrophages: Undisputed Stars of the Inflammatory Tumour Microenvironment. Clin. Exp. Immunol. 2012;167:195–205. doi: 10.1111/j.1365-2249.2011.04515.x. - DOI - PMC - PubMed
    1. Sica A., Schioppa T., Mantovani A., Allavena P. Tumour-Associated Macrophages Are a Distinct M2 Polarised Population Promoting Tumour Progression: Potential Targets of Anti-Cancer Therapy. Eur. J. Cancer. 2006;42:717–727. doi: 10.1016/j.ejca.2006.01.003. - DOI - PubMed
    1. Sica A., Larghi P., Mancino A., Rubino L., Porta C., Totaro M.G., Rimoldi M., Biswas S.K., Allavena P., Mantovani A. Macrophage Polarization in Tumour Progression. Semin. Cancer Biol. 2008;18:349–355. doi: 10.1016/j.semcancer.2008.03.004. - DOI - PubMed

Publication types

LinkOut - more resources