. 2023 Dec 12;11(6):e0229223.
doi: 10.1128/spectrum.02292-23. Epub 2023 Oct 27.

Fusobacterium nucleatum and its metabolite hydrogen sulfide alter gut microbiota composition and autophagy process and promote colorectal cancer progression

Affiliations

Fusobacterium nucleatum and its metabolite hydrogen sulfide alter gut microbiota composition and autophagy process and promote colorectal cancer progression

Minyu Wang et al. Microbiol Spectr. .

Abstract

Colorectal cancer (CRC) is the second most common cancer in the world; the main treatment for CRC is immunosuppressive therapy, but this therapy is only effective for a small percentage of CRC patients, so there is an urgent need for a treatment with fewer side effects and higher efficacy. This study demonstrated that Fusobacterium nucleatum with increased abundance in CRC can regulate the autophagy process and disrupt normal intestinal microbiota by producing hydrogen sulfide, factors that may be involved in the development and progression of CRC. This study may provide a reference for future CRC treatment options that are efficient and have fewer side effects.

Keywords: Fusobacterium nucleatum; autophagy; colorectal cancer; gut microbiota; hydrogen sulfide.


Conflict of interest statement

The authors declare no conflict of interest.

Figures

Fig 1
Fig 1
The H2S production capacity of Fn. (a) The detection of H2S corresponding to gradient NaHS concentrations (0, 0.2, 0.4, 0.6, 0.8, 1, 2, 4 mM from top to bottom) was measured by the bismuth chloride method. (b) The amount of H2S produced by bacteria was measured by the bismuth chloride method after administering Fn (109 CFU) gradient concentrations (0, 5, 10, 15, 20, 40, 50, 100, 200, 400 mM) of L-cysteine.
Fig 2
Fig 2
Effects of different concentrations of H2S on the survival and migration rate of three human-derived colon cancer cells. (a) Three colon cancer cell lines, RKO, HCT116, and DLD1, were given different concentrations of sodium hydrosulfide, and the survival rate of cells was determined by the CCK-8 method after 24 h. Data are presented as the mean ± SD, **P < 0.01, ***P < 0.001 (one-way analysis of variance). (b) Three colon cancer cell lines, RKO, HCT116, and DLD1, were given different concentrations of sodium hydrosulfide and scratched with a sterile tip, and the changes in the width of the scratches were observed at 0, 24, and 48 h, respectively.
Fig 3
Fig 3
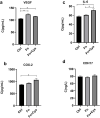
H2S at the same concentration as H2S in the intestines of CRC patients promoted the pro-inflammatory effect of colon cancer cells HCT116. The expression levels of inflammatory factors (a) VEGF, (b) COX-2, (c) IL-6, and (d) CDH17 in the cell supernatants were measured after co-culturing HCT116 with Fn or with Fn and Cys. Data are presented as the mean ± SD, *P < 0.05 (one-way analysis of variance).
Fig 4
Fig 4
Changes in cell transcriptome profile after administration of Fn or Fn with Cys to HCT116 cells. (a) Venn diagram of genes differentially expressed between two groups, C means HCT116 control group, F means CRC + Fn group, and y means CRC + Fn + Cys group. Part of the enriched Kyoto Encyclopedia of Gene and Genomes pathways and Gene Ontology terms between the HCT116 + Fn group and HCT116 group (b top and c), HCT116 + Fn + Cys group and HCT116 group (b bottom and d). Heat map of differences in gene expression between HCT116 + Fn group and HCT116 group (e), HCT116 + Fn + Cys group and HCT116 group (f).
Fig 5
Fig 5
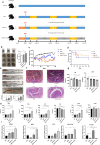
The mouse colorectal cancer model was created with AOM/DSS to observe the survival rate and the lesions of tissues of mice and to observe the expression of inflammatory factors and autophagy-related genes in mouse serum or colons by ELISA and RT-qPCR. The number of mice in each group was at least 3. (a) Schematic diagram of a mouse CRC model with AOM/DSS and the administration of bacteria and Cys. (b) The appearance of feces of mice and determination of the amount of H2S in feces. (c) Graphs of body weight changes in mice. (d) Survival curves of mice. (e) Colons of mice, the number and volume of the tumors in colons in each group. (f) H&E staining of the colons mice. Scale bar = 100 µm. (g) Determination of the expression levels of p62 and LC3II in the serum of mice by ELISA. Data are presented as the mean ± SEM, *P < 0.05, **P < 0.01 [one-way analysis of variance (ANOVA)]. (h) Expression levels of NLRP3, IL-1β in serum and VEGF, COX-2, IL-6, and CDH17 in colons of mice were determined by ELISA. Data are presented as the mean ± SEM, *P < 0.05, **P < 0.01, ***P < 0.001, ****P < 0.0001 (unpaired t-test). (i) Expression levels of autophagy-related genes in colons of mice were determined by RT-qPCR. Data are presented as the mean ± SEM, *P < 0.05, **P < 0.01, ***P < 0.001, ****P < 0.0001 (one-way ANOVA).
Fig 6
Fig 6
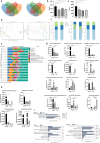
The alpha and beta diversity of bacteria and fungi were first compared between groups, respectively, followed by relative abundance of each bacterium or fungus between groups to compare the differences in composition and abundance of bacteria or fungi, respectively, and functional analysis of bacteria were used to compare the changes in signaling pathways between groups. The number of mice in the control group was 8, and the number of mice in the CRC and CRC + Fn + Cys group was 4, respectively. The number of mice in the Fn group was 5. (a) Venn diagram of OTU distribution of bacteria (left) and fungi (right). Measures of bacterial (b) and fungal (c) alpha diversity, i.e., Chao1 index. (d) PCoA analysis of beta diversity of bacteria (left) and fungi (right). (e) Combined cluster number and histogram analysis of bacteria. (f) Distribution of different types of fungi (saprotroph, symbiotroph, and pathotroph) among different groups. Differences in abundance of bacteria between groups. (g) Differences in abundance of fungi between groups. (h) Plot of predicted PICRUSt2 COG function results for bacteria. Ctrl, CRC, Fn, Cys groups represent the control, CRC, CRC + Fn, CRC + Fn + Cys groups, respectively. Data are presented as the mean ± SEM, *P < 0.05, **P < 0.01, ***P < 0.001, ****P < 0.0001 (one-way analysis of variance).
Fig 7
Fig 7
Evolutionary branching plots of LEfSe analysis for bacteria (a) and fungi (b).
Fig 8
Fig 8
Correlation network plots for each species at the genus level for bacteria (a) and fungi (b).

Similar articles

Cited by

References

    1. Kostic AD, Chun E, Robertson L, Glickman JN, Gallini CA, Michaud M, Clancy TE, Chung DC, Lochhead P, Hold GL, El-Omar EM, Brenner D, Fuchs CS, Meyerson M, Garrett WS. 2013. Fusobacterium nucleatum potentiates intestinal tumorigenesis and modulates the tumor-immune microenvironment. Cell Host Microbe 14:207–215. doi: 10.1016/j.chom.2013.07.007 - DOI - PMC - PubMed
    1. He Z, Zhao T-T, Xu H-M, Wang Z-N, Xu Y-Y, Song Y-X, Ni Z-R, Xu H, Yin S-C, Liu X-Y, Miao Z-F. 2017. Association between alcohol consumption and the risk of gastric cancer-a meta-analysis of prospective cohort studies. Oncotarget 8:84459–84472. doi: 10.18632/oncotarget.20880 - DOI - PMC - PubMed
    1. Gaines S, van Praagh JB, Williamson AJ, Jacobson RA, Hyoju S, Zaborin A, Mao J, Koo HY, Alpert L, Bissonnette M, Weichselbaum R, Gilbert J, Chang E, Hyman N, Zaborina O, Shogan BD, Alverdy JC. 2020. Western diet promotes intestinal colonization by collagenolytic microbes and promotes tumor formation after colorectal surgery. Gastroenterology 158:958–970. doi: 10.1053/j.gastro.2019.10.020 - DOI - PMC - PubMed
    1. Weir TL, Manter DK, Sheflin AM, Barnett BA, Heuberger AL, Ryan EP. 2013. Stool microbiome and metabolome differences between colorectal cancer patients and healthy adults. PLoS One 8:e70803. doi: 10.1371/journal.pone.0070803 - DOI - PMC - PubMed
    1. Vogtmann E, Goedert JJ. 2016. Epidemiologic studies of the human microbiome and cancer. Br J Cancer 114:237–242. doi: 10.1038/bjc.2015.465 - DOI - PMC - PubMed

Substances

LinkOut - more resources