. 2023 Dec 11;51(22):12092-12110.
doi: 10.1093/nar/gkad936.

The three-dimensional structure of the EBV genome plays a crucial role in regulating viral gene expression in EBVaGC

Affiliations

The three-dimensional structure of the EBV genome plays a crucial role in regulating viral gene expression in EBVaGC

Davide Maestri et al. Nucleic Acids Res. .

Abstract

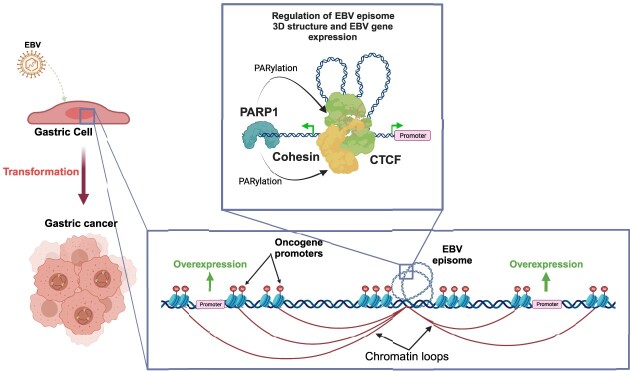
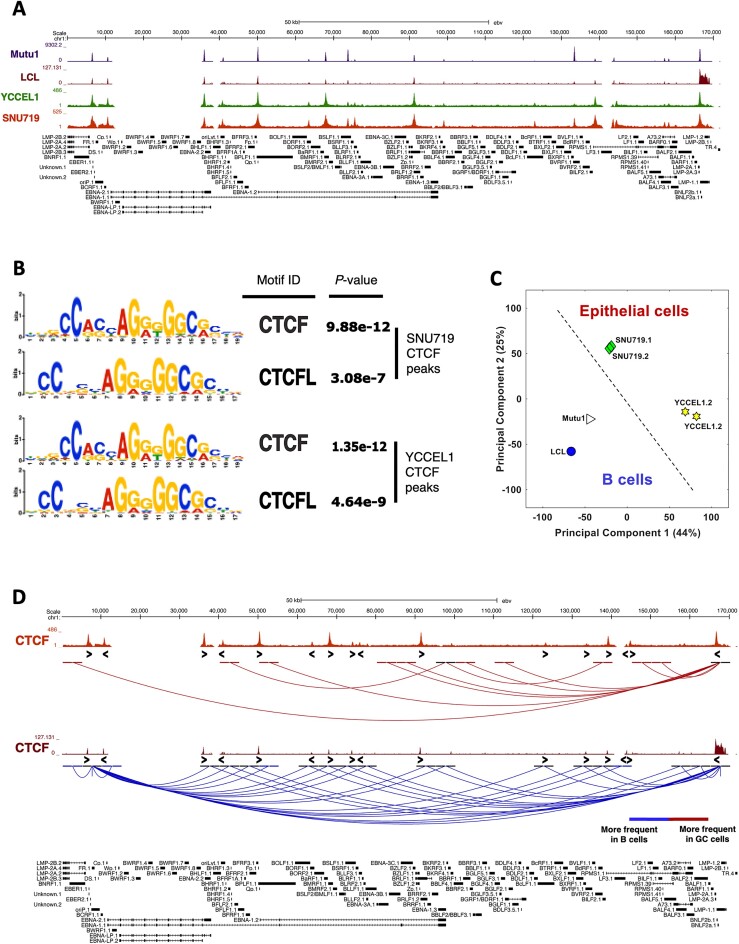
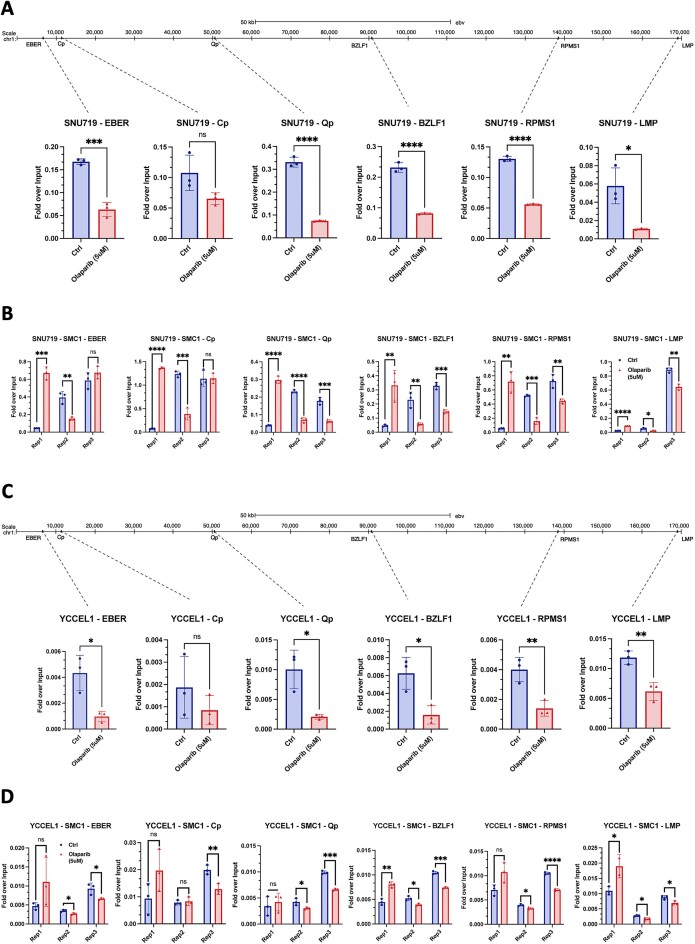
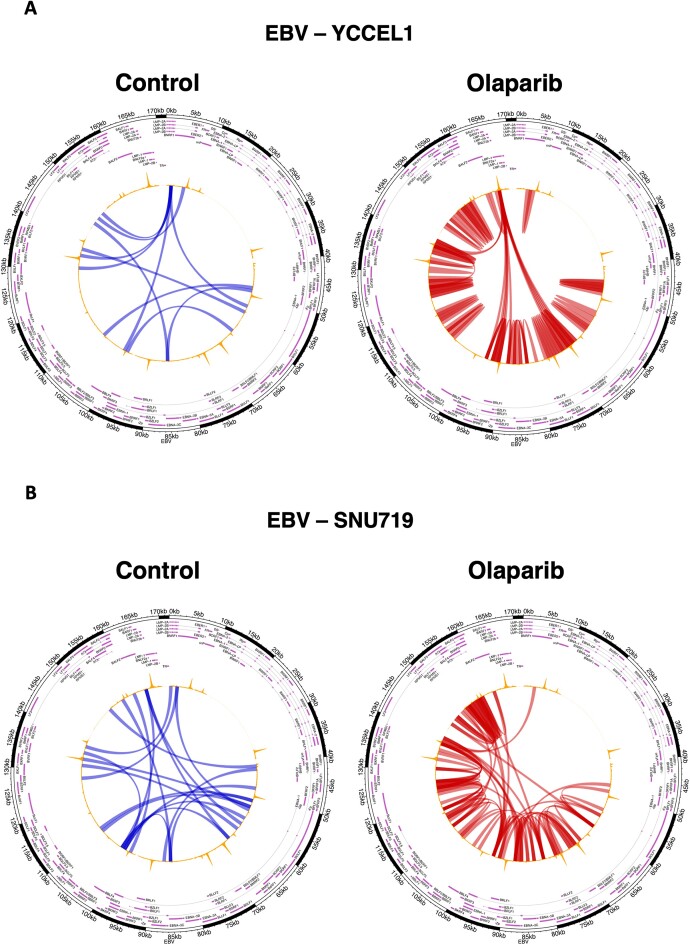
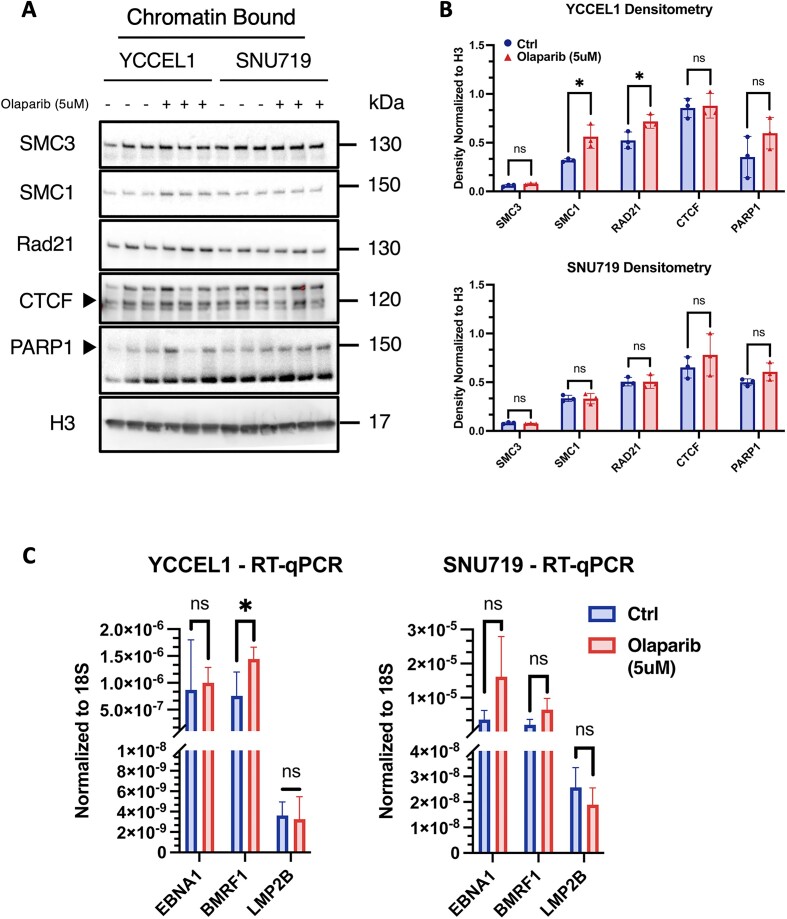
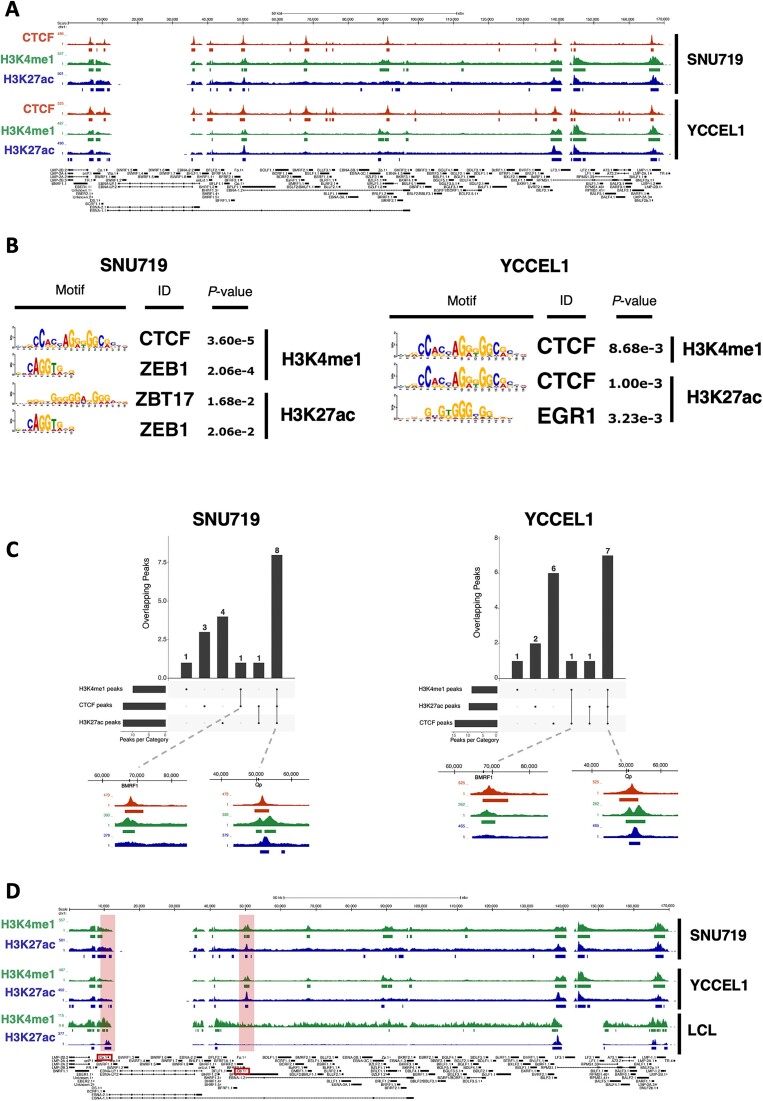
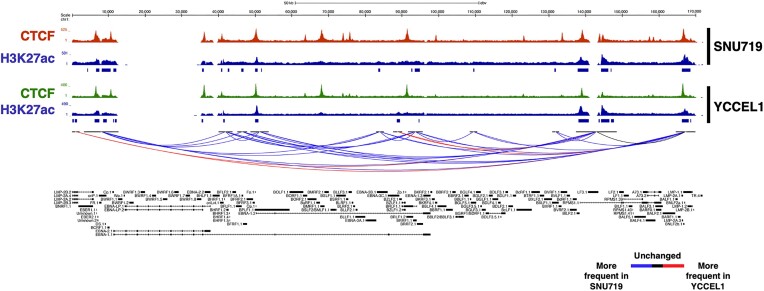
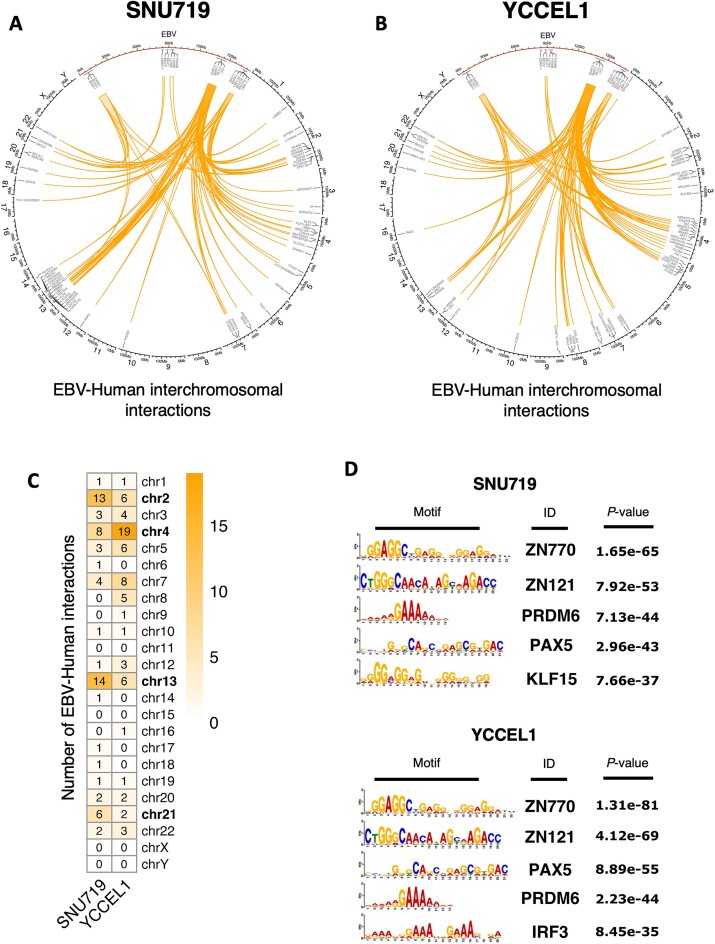
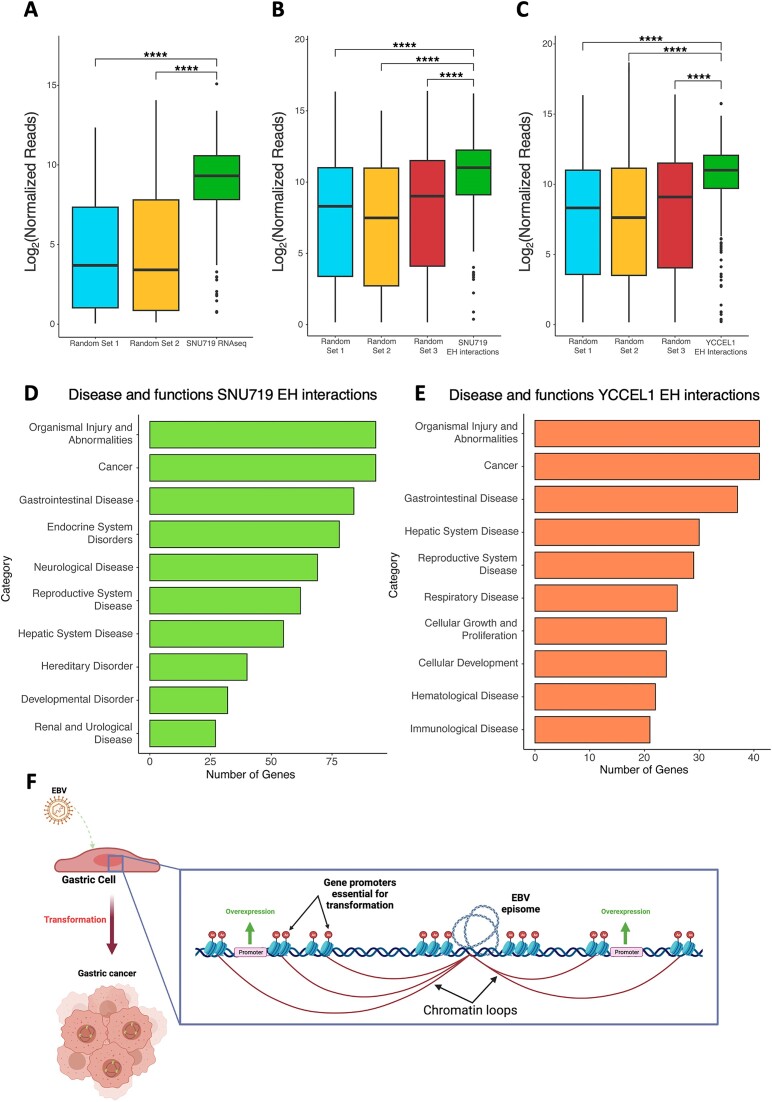
Epstein-Barr virus (EBV) establishes lifelong asymptomatic infection by replication of its chromatinized episomes with the host genome. EBV exhibits different latency-associated transcriptional repertoires, each with distinct three-dimensional structures. CTCF, Cohesin and PARP1 are involved in maintaining viral latency and establishing episome architecture. Epstein-Barr virus-associated gastric cancer (EBVaGC) represents 1.3-30.9% of all gastric cancers globally. EBV-positive gastric cancers exhibit an intermediate viral transcription profile known as 'Latency II', expressing specific viral genes and noncoding RNAs. In this study, we investigated the impact of PARP1 inhibition on CTCF/Cohesin binding in Type II latency. We observed destabilization of the binding of both factors, leading to a disrupted three-dimensional architecture of the episomes and an altered viral gene expression. Despite sharing the same CTCF binding profile, Type I, II and III latencies exhibit different 3D structures that correlate with variations in viral gene expression. Additionally, our analysis of H3K27ac-enriched interactions revealed differences between Type II latency episomes and a link to cellular transformation through docking of the EBV genome at specific sites of the Human genome, thus promoting oncogene expression. Overall, this work provides insights into the role of PARP1 in maintaining active latency and novel mechanisms of EBV-induced cellular transformation.


Figures

Graphical Abstract
Graphical Abstract
Figure 1.
Figure 1.
The three-dimensional structure of the viral genome differs in all latency types and reflects the viral gene expression state. (A) CTCF ChIP-seq profiles in latency Type I (Mutu, purple), III (LCL, brown) and II (YCCEL1, green and SNU719, dark red), normalized to input DNA. (B) Motif analysis for the CTCF ChIP-seq peaks identified in the latency Type II cell lines. (C) Principal Component Analysis (PCA) based on the 3D structure of the viral genome. (D) UCSC Genome Browser linearized visualization of the unique interactions found in HiC experiment in gastric cancer cell lines (dark red) and in B cells (blue) (FDR < 5%). CTCF motif directionality is represented by arrowheads under CTCF ChIP-seq peaks.
Figure 2.
Figure 2.
PARP1 inhibition alters CTCF/Cohesin binding. (A) CTCF ChIP-qPCR in SNU719 cell line following PARP1 inhibition with 5uM Olaparib treatment for the main CTCF binding sites. (B) ChIP-qPCR in SNU719 cell line following PARP1 inhibition for SMC1 Cohesin subunit in all three replicates for the same CTCF binding sites. (C) CTCF ChIP-qPCR in YCCEL1 cell line following PARP1 inhibition with 5uM Olaparib treatment for the main CTCF binding sites. (D) ChIP-qPCR in YCCEL1 cell line following PARP1 inhibition for SMC1 Cohesin subunit in all three replicates for the same CTCF binding sites. Data are presented as %input. N = 3, Mean ± SD. The t test P values for the Olaparib/Ctrl comparison are indicated as asterisks (**** P ≤  0.0001, *** P ≤ 0.001, ** P ≤ 0.01, * P ≤ 0.05).
Figure 3.
Figure 3.
Viral chromatin looping is altered by PARP1 inhibition. (A) Circular visualization of the interactions derived from HiC matrices in YCCEL1 cell line. The arches represent the DNA-DNA interactions at 1 kb scale. The blue arches represent the interactions found more frequently in the control samples, while the red ones represent those found more frequently in the Olaparib treated samples (FDR < 5%). (B) Circular visualization (as described in A) of the interactions derived from HiC matrices in SNU719 cell line. In all plots CTCF ChIP-seq track is represented in yellow on top of the arches.
Figure 4.
Figure 4.
PARP1 inhibition alters viral gene expression. (A) Western Blot of chromatin-bound fraction of Cohesin subunits, CTCF and PARP1 proteins extracted from YCCEL1 and SNU719 cell lines following PARP1 inhibition (N = 3). Molecular weights are indicated on the side. (B) Densitometry analysis of the western blot described in (A). Data are normalized on the H3 histone density. The t test P values for the Olaparib/Ctrl comparison are indicated as asterisks (*P ≤ 0.05). (C) RT-qPCR of EBNA1, BMRF1 and LMP2B viral genes following Olaparib treatment. Bar graph represents the average expression of three biological replicates per treatment, each normalized to 18S expression, respectively (N = 3, mean ± SD). Paired Student's t test assuming equal variance (two-tailed) was used to compare the experiments (* P ≤ 0.05).
Figure 5.
Figure 5.
CTCF co-localizes with enhancer histone marks. (A) UCSC Genome Browser tracks for CTCF (dark red), H3K4me1 (green), H3K27ac (blue) on the EBV genome in both SNU719 (top) and YCCEL1 (bottom) cell lines. (B) Transcription factor motif analysis for H3K4me1 (top) and H3K27ac (bottom) peaks in SNU719 (left) and YCCEL1 (right) cell lines. (C) UpSet plot of the overlap between CTCF and H3K4me1 and H3K27ac histone marks. On the bottom, magnified ChIP-seq tracks for CTCF and both histone marks are shown. (D) H3K4me1 and H3K27ac ChIP-seq tracks on the EBV genome in SNU719 (top), YCCEL1 (middle) and LCL (bottom) cell lines.
Figure 6.
Figure 6.
HiChIP analysis reveals distinct three-dimensional structures and enhancer interactions in SNU719 and YCCEL1 cell lines. UCSC Genome Browser tracks of CTCF (dark red and green) and H3K27ac (blue) on the EBV genome in SNU719 (top) and YCCEL1 (bottom) cell lines. On the bottom of the image are show the unique H3K27ac-rich interactions (FDR < 1%) in both cell lines (blue = more frequent in SNU719, red = more frequent in YCCEL1, black = no difference in frequency between cell lines).
Figure 7.
Figure 7.
EBV enhancer regions are tethered to specific loci across the host genome. (A) Circos plot of EBV–human interchromosomal interactions for SNU719 cell line. EBV is represented in red and enlarged on the top section of the plot. EBV–human interactions are represented as orange arches. Some of the genes near the interaction points are annotated. (B) Circos plot of EBV–human interchromosomal interactions for YCCEL1 cell line (as described in (A). (C) Heatmap showing the number of interactions occurring between EBV and the Human chromosomes in both cell lines. (D) Transcription factor motif analysis of EBV–human interaction regions on the Human genome for SNU719 (top) and YCCEL1 (bottom) cell lines.
Figure 8.
Figure 8.
Functional role of EBV–human interactions: gene expression analysis reveals strong viral enhancers associated with gastric cancers. (A) Boxplot comparing the normalized reads for genes near EBV–human interactions to two different random gene sets in SNU719 cell line (****P ≤  0.0001). (B) Boxplot comparing the normalized reads for genes near EBV–human interactions found in SNU719 to three different random gene sets in TCGA datasets from biopsies of EBV + gastric malignances (****P ≤  0.0001). (C) Boxplot (as described in B) for EBV–human interactions found in YCCEL1 cell line (****P ≤  0.0001). (D) Ingenuity Pathway Analysis (IPA) of genes found near EBV–human interaction sites in SNU719 cell line. (E) IPA (as described in D) of genes found near EBV–human interaction sites in YCCEL1 cell line. (F) Model of the supposed mechanism of EBV-driven cell transformation. The figure was created with BioRender.com.

References

    1. Smatti M.K., Al-Sadeq D.W., Ali N.H., Pintus G., Abou-Saleh H., Nasrallah G.K.. Epstein–Barr virus epidemiology, serology, and genetic variability of LMP-1 oncogene among healthy population: an update. Front. Oncol. 2018; 8:211. - PMC - PubMed
    1. Caruso L.B., Maestri D., Tempera I.. Three-dimensional chromatin structure of the EBV genome: a crucial factor in viral infection. Viruses. 2023; 15:1088. - PMC - PubMed
    1. Morgan S.M., Tanizawa H., Caruso L.B., Hulse M., Kossenkov A., Madzo J., Keith K., Tan Y., Boyle S., Lieberman P.M.et al. .. The three-dimensional structure of Epstein–Barr virus genome varies by latency type and is regulated by PARP1 enzymatic activity. Nat. Commun. 2022; 13:187. - PMC - PubMed
    1. Price A.M., Luftig M.A.. To be or not IIb: a multi-step process for Epstein–Barr virus latency establishment and consequences for B cell tumorigenesis. PLoS Pathog. 2015; 11:e1004656. - PMC - PubMed
    1. Tempera I., Wiedmer A., Dheekollu J., Lieberman P.M.. CTCF prevents the epigenetic drift of EBV latency promoter Qp. PLoS Pathog. 2010; 6:e1001048. - PMC - PubMed

Publication types