. 2023 Nov 27;51(21):11652-11667.
doi: 10.1093/nar/gkad919.

LSM14B is essential for oocyte meiotic maturation by regulating maternal mRNA storage and clearance

Affiliations

LSM14B is essential for oocyte meiotic maturation by regulating maternal mRNA storage and clearance

Yanling Wan et al. Nucleic Acids Res. .

Abstract

Fully grown oocytes remain transcriptionally quiescent, yet many maternal mRNAs are synthesized and retained in growing oocytes. We now know that maternal mRNAs are stored in a structure called the mitochondria-associated ribonucleoprotein domain (MARDO). However, the components and functions of MARDO remain elusive. Here, we found that LSM14B knockout prevents the proper storage and timely clearance of mRNAs (including Cyclin B1, Btg4 and other mRNAs that are translationally activated during meiotic maturation), specifically by disrupting MARDO assembly during oocyte growth and meiotic maturation. With decreased levels of storage and clearance, the LSM14B knockout oocytes failed to enter meiosis II, ultimately resulting in female infertility. Our results demonstrate the function of LSM14B in MARDO assembly, and couple the MARDO with mRNA clearance and oocyte meiotic maturation.


Figures

Graphical Abstract
Graphical Abstract
Figure 1.
Figure 1.
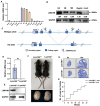
Profiling LSM14B expression in oocytes and early embryos, and generation of Lsm14b knockout mice. (A) qPCR results for Lsm14b expression in oocytes, pre-implantation embryos and somatic tissues of mice. Gapdh was used as an internal control. n = 3 biological replicates. (B) Immunoblotting results showing LSM14B expression levels in oocytes during meiotic maturation and embryos at the indicated developmental stages. LSM14B and GAPDH band densities were quantified, and LSM14B/GAPDH ratios were calculated. Total proteins from 100 oocytes were loaded in each lane. GAPDH was blotted as a loading control. (C) The Lsm14b knockout strategy in mice. (D) qPCR results for Lsm14b expression in GV oocytes of WT and Lsm14b knockout females. Gapdh was used as an internal control. n = 3 biological replicates. Error bars = SEM. *P <0.05 by two-tailed Student's t-tests. (E) Immunoblotting results showing LSM14B in GV oocytes of WT and Lsm14b knockout females. Total proteins from 100 oocytes were loaded in each lane. GAPDH is blotted as a loading control. (F) Morphology of mice and ovaries at postnatal day 56. Scale bar = 1 mm. (G) Hematoxylin staining of ovary sections from WT and Lsm14b knockout female mice. Scale bar = 200 μm. (H) Cumulative numbers of pups per female during the indicated time windows of the fertility test. The numbers of analyzed mice are indicated (n).
Figure 2.
Figure 2.
Lsm14b knockout oocytes display embryogenesis defects. (A) Representative images of oocytes derived from WT and Lsm14b knockout mice in vivo at 14 and 16 h after hCG injection. Scale bar = 100 μm. (B) Immunofluorescence analysis of oocytes collected from WT and Lsm14b knockout mice at 16 h after hCG injection. Scale bar = 20 μm. (C) The rates of SNs and NSNs collected from WT and Lsm14b knockout mice. Data are presented as the mean ± SEM. **P < 0.01. (D) The number of oocytes ovulated from WT and Lsm14b knockout mice. The numbers of analyzed mice are indicated (n). (E) The percentages of oocytes with a first polar body (PB1) at 12, 14 and 16 h after ovulation induction (via hCG injection, 5 IU). The numbers of analyzed oocytes are indicated (n). (F) The percentages of oocytes with a PB1 and a nucleus at 12, 14 and 16 h after ovulation induction (via hCG injection, 5 IU). The numbers of analyzed oocytes are indicated (n). (G) Representative images of pre-implantation embryos at different stages derived from WT and Lsm14b knockout mice. (H) Immunofluorescence staining (as indicated) of zygotes derived from WT and Lsm14b knockout mice mated with WT males. Scale bar = 20 μm. (I) The rates of one pronuclear (1PN) and 2PN zygotes collected from WT and Lsm14b knockout mice. The numbers of analyzed oocytes are indicated (n). Data are presented as the mean ± SEM. ****P < 0.0001. (J) Quantification of pre-implantation embryos derived from WT and Lsm14b knockout mice. The numbers of analyzed embryos are indicated (n). Data are presented as the mean ± SEM. ***P < 0.001 and ****P < 0.0001. (K) Schematic for WT and Lsm14b knockout oocyte meiotic maturation and early embryogenesis.
Figure 3.
Figure 3.
The distribution and function of mitochondria are impaired in Lsm14b knockout oocytes. (A) Representative immunofluorescence images of mouse oocytes at the indicated growth stages. Lsm14b-mCherry (red), counterstained with MitoTracker (green). Insets are magnifications of outlined regions. The dashed line demarcates the oocyte. Scale bar = 5 μm. (B) Intensity profiles along the yellow lines in (A). (C) Representative immunofluorescence images of GV stage oocytes collected from WT and Lsm14b knockout mice. The dashed line demarcates the oocyte. Scale bar = 5 μm. (D andE) ImageJ was used to quantitatively analyze the distribution of mitochondria in (C). (F) Representative immunofluorescence images of MI stage oocytes collected from WT and Lsm14b knockout mice. Insets are magnifications of outlined regions. The dashed line demarcates the oocyte. Scale bar = 5 μm. (G and H) ImageJ was used to quantitatively analyze the distribution of mitochondria in (F). (I) Rates of abnormal distribution of mitochondria in GV and MI stage oocytes. The number of analyzed embryos is indicated (n). Error bars show the SEM. ***P < 0.001 and ****P < 0.0001 by two-tailed Student's t-tests. (J) ATP content in WT and Lsm14b knockout oocytes. Error bars show the SEM. *P <0.05 and **P <0.01 by two-tailed Student's t-tests. (K) Representative images and quantification of CM-H2DCFDA fluorescence (green) in WT and Lsm14b knockout oocytes. Scale bar = 100 μm. Error bars show the SEM. ****P < 0.0001 by two-tailed Student's t-tests. (L) Representative RNA-FISH images of mouse GV oocytes collected from WT and Lsm14b knockout mice. mRNAs with a poly(A) tail (red), counterstained with HSP60 (green). Insets are magnifications of outlined regions. The dashed line demarcates the oocyte. Scale bar = 5 μm.
Figure 4.
Figure 4.
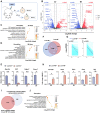
Maternal mRNA storage and clearance are defective in Lsm14b knockout oocytes. (A) Schematic for samples examined with RNA-seq. (B) Volcano plot comparing the transcripts of oocytes from WT and Lsm14b knockout mice (GV, MII stage oocytes). Transcripts that increased or decreased by >2-fold in Lsm14b knockout oocytes are highlighted in red or blue, respectively. (C andD) Bubble charts showing the down-regulated genes in GV and MII stage oocytes. (E) qPCR results showing expression levels of mRNAs encoding Mrps18a, Mzt1, Pabpn1l and Exosc3 in GV stage oocytes. Error bars shown the SEM. **P < 0.01, ***P < 0.001 and ****P < 0.0001 by two-tailed Student's t-tests. (F) Venn diagram showing the overlap of M-decay transcripts (decreased 4-fold from the GV to MII stage) in oocytes from WT and Lsm14b knockout mice. (G) Degradation patterns of maternal transcripts during the GV–MII transition in oocytes derived from WT and Lsm14b knockout mice. Each teal line represents the expression levels of one gene, and the middle red and blue lines represent the median expression levels of the two groups. (H) qPCR results for FCs of the indicated maternal transcripts in oocytes at the MII stage from WT and Lsm14b knockout females. Error bars show the SEM. *P < 0.05 and **P < 0.01 by two-tailed Student's t-tests. (I) Venn diagrams showing the overlap in transcripts. Cyan, translationally activated mRNAs during oocyte meiotic maturation; red, down-regulated mRNAs in Lsm14b knockout GV oocytes, log2FC < –1 (Lsm14b knockout versus WT oocytes). (J) Bubble charts showing the down-regulated genes in GV stage oocytes.
Figure 5.
Figure 5.
LSM14B deletion causes down-regulation of proteins with functions in meiosis maturation and early embryo development. (A) Schematic for samples examined with proteomics. (B) Volcano plot comparing the proteins of WT and Lsm14b knockout oocytes at the MII stage (14 h after hCG injection). Proteins that increased or decreased by >2-fold in Lsm14b knockout oocytes are highlighted in red or blue, respectively. (C) The three enrichment plots from the GSEA results. (D) Venn diagrams showing the overlap in proteomics. Orange, down-regulated proteins in Lsm14b knockout MII oocytes (1.5 FC, Lsm14b knockout versus WT oocytes). Blue, up- and down-regulated transcripts in Lsm14b knockout GV oocytes (>2 FC, Lsm14b knockout versus WT oocytes). (E) Representative RNA-FISH images of mouse GV oocytes collected from WT and Lsm14b knockout mice. Btg4 and CyclinB1 were labeled with 5′-Cy3-Oligo d(T)30. Insets are magnifications of outlined regions. The dashed line demarcates the oocyte. Scale bar = 5 μm. (F) Immunoblotting against ZAR1 in MII stage oocytes derived from WT and Lsm14b knockout mice; β-actin was used as the protein loading control. (G) Immunoblotting against DDX6 in MII stage oocytes derived from WT and Lsm14b knockout mice; β-actin was used as the protein loading control. (H) Immunoblotting against Cyclin B1 in MII stage oocytes derived from WT and Lsm14b knockout mice; β-actin was used as the protein loading control. (I) Immunoblotting against EIF4ENIF1 and EIF4E1B in MII stage oocytes derived from WT and Lsm14b knockout mice; β-actin was used as the protein loading control. (J) Co-IP and immunoblotting results showing the interaction between LSM14B and ZAR1. HeLa cells were transiently transfected with plasmids expressing the indicated proteins, and were harvested for Co-IP at 48 h after plasmid transfection.
Figure 6.
Figure 6.
Exogenous supplementation of Lsm14b and Zar1 mRNA rescues mitochondrial distribution defects. (A) ZAR1 and LSM14B immunofluorescence results in GV stage oocytes of Lsm14b knockout mice. Scale bar = 10 μm. (B) ImageJ was used to quantitatively analyze the intensity of ZAR1 in (A). (C) Rates of the subcortical aggregation pattern of ZAR1 in Lsm14b knockout oocytes. Error bars show the SEM. **P < 0.01 by two-tailed Student's t-tests. (D) ImageJ was used to quantitatively analyze the intensity of ZAR1 and LSM14B in (A). (E) Intensity profiles of ZAR1 and LSM14B along the yellow lines in (A). (F) Schematic of the procedure for the rescue experiment. (G) Representative immunofluorescence images of the mitochondrial distribution in Lsm14b knockout oocytes with injection at different growth stages. Scale bar = 10 μm. (H) Intensity profiles of mitochondria along the yellow lines in (G). The clusters of mitochondria are indicated by the red arrowhead. (I) Rates for an abnormal mitochondrial distribution in GV and MI stage oocytes of Lsm14b knockout mice.
Figure 7.
Figure 7.
A model for LSM14B’s role in regulating mRNA storage and clearance in oocytes. In GV oocytes, LSM14B promotes MARDO assembly together with ZAR1 and DDX6 to function in mRNA storage and clearance (including Cyclin B1, Btg4 and other mRNAs that become translationally activated) during oocyte meiotic maturation.

References

    1. Zheng W., Zhou Z., Sha Q., Niu X., Sun X., Shi J., Zhao L., Zhang S., Dai J., Cai S.et al. .. Homozygous mutations in BTG4 cause zygotic cleavage failure and female infertility. Am. J. Hum. Genet. 2020; 107:24–33. - PMC - PubMed
    1. Cheng S., Altmeppen G., So C., Welp L.M., Penir S., Ruhwedel T., Menelaou K., Harasimov K., Stützer A., Blayney M.et al. .. Mammalian oocytes store mRNAs in a mitochondria-associated membraneless compartment. Science. 2022; 378:eabq4835. - PubMed
    1. Sha Q.Q., Zhang J., Fan H.Y.. A story of birth and death: mRNA translation and clearance at the onset of maternal-to-zygotic transition in mammals. Biol. Reprod. 2019; 101:579–590. - PubMed
    1. Liu Y., Lu X., Shi J., Yu X., Zhang X., Zhu K., Yi Z., Duan E., Li L.. BTG4 is a key regulator for maternal mRNA clearance during mouse early embryogenesis. J. Mol. Cell Biol. 2016; 8:366–368. - PubMed
    1. Jiang Y., Adhikari D., Li C., Zhou X.. Spatiotemporal regulation of maternal mRNAs during vertebrate oocyte meiotic maturation. Biol. Rev. Camb. Philos. Soc. 2023; 98:900–930. - PubMed

Publication types

Associated data