. 2023 Nov 7;12(21):e030243.
doi: 10.1161/JAHA.123.030243. Epub 2023 Oct 27.

Human Plaque Myofibroblasts to Study Mechanisms of Atherosclerosis

Affiliations

Human Plaque Myofibroblasts to Study Mechanisms of Atherosclerosis

Michele F Buono et al. J Am Heart Assoc. .

Abstract

Background Plaque myofibroblasts are critical players in the initiation and advancement of atherosclerotic disease. They are involved in the production of extracellular matrix, the formation of the fibrous cap, and the underlying lipidic core via modulation processes in response to different environmental cues. Despite clear phenotypic differences between myofibroblast cells and healthy vascular smooth muscle cells, smooth muscle cells are still widely used as a cellular model in atherosclerotic research. Methods and Results Here, we present a conditioned outgrowth method to isolate and culture myofibroblast cells from plaques. We obtained these cells from 27 donors (24 carotid and 3 femoral endarterectomies). We show that they keep their proliferative capacity for 8 passages, are transcriptionally stable, retain donor-specific gene expression programs, and express extracellular matrix proteins (FN1, COL1A1, and DCN) and smooth muscle cell markers (ACTA2, MYH11, and CNN1). Single-cell transcriptomics reveals that the cells in culture closely resemble the plaque myofibroblasts. Chromatin immunoprecipitation sequencing shows the presence of histone H3 lysine 4 dimethylation at the MYH11 promoter, pointing to their smooth muscle cell origin. Finally, we demonstrated that plaque myofibroblasts can be efficiently transduced (>97%) and are capable of taking up oxidized low-density lipoprotein and undergoing calcification. Conclusions In conclusion, we present a method to isolate and culture cells that retain plaque myofibroblast phenotypical and functional capabilities, making them a suitable in vitro model for studying selected mechanisms of atherosclerosis.

Keywords: disease modeling; myofibroblast; phenotypic modulation; plaque cells; smooth muscle cell.


Figures
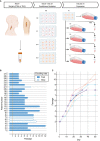
Figure 1
Figure 1. Isolation and growth of plaque myofibroblasts.
A, Conditioned outgrowth method to isolate and expand plaque myofibroblasts from fresh human atherosclerotic plaques obtained from endarterectomy patients. Plaques were obtained after surgery (D0), cut and placed in a precoated fibronectin 12‐well plate until day 14 (D14), while refreshing the culture medium every other day. At D14, atherosclerotic pieces were removed from the dish, and the cells migrated and clustered in colonies were left to grow until day 21 (D21). On D21, the cell colonies were passed to a 6‐well plate (passage 1 [p1]) and subsequently expanded. From p2 on, plaque myofibroblasts were subcultured until 70% to 80% confluency and sampled for mRNA extraction over the culture. B, Growth status of individual plaque myofibroblast lines until their latest passage. The orange dashed line indicates the end of the isolation procedure. C, Growth curves of 6 individual examples of plaque myofibroblasts showing their proliferative capacity. CEA indicates carotid endarterectomy; and TEA, thromboendarterectomy.
Figure 2
Figure 2. Characterization of plaque myofibroblasts.
A, Representative immunofluorescence images of plaque myofibroblasts obtained from 2 donors showing positivity for α‐smooth muscle (SM) actin (i–ii) and morphologic tracts via phalloidin staining (F‐actin; iii–iiii). Bars=50 μm. B, Gene expression analysis of 3 individual plaque myofibroblast donors for the canonical SM cell (SMC) markers relative to human coronary artery SMCs (HCASMCs). Each column represents 1 patient and the corresponding gene expression pattern. *P≤0.05, **P≤0.01, ***P≤0.001, ****P≤0.0001. C, Flow cytometry analysis comparing expression profiles of plaque myofibroblasts with other cell types involved in atherogenesis. The histograms show the “relative counts” on the y axis and the “relative intensity” on the x axis.
Figure 3
Figure 3. Stable transcriptome maintained over passages.
A, Principal component analysis, based on the top 500 variable genes, of plaque myofibroblasts from 12 patients. B, Box plots showing the expression of canonical smooth muscle cell (SMC) and fibroblast genes, such as ACTA2, MYH11, SMTN, FN1, COL1A1, and DCN, throughout passages (from 2 to 5). C, Differential gene expression analysis between passages 2, 3, 4, and 5.
Figure 4
Figure 4. Transcriptome characterization of plaque myofibroblasts.
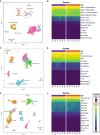
A, Uniform manifold approximation and projection (UMAP) showing different cells clusters identified in the single‐cell RNA sequencing (scRNA‐seq) of 46 atherosclerotic plaques of carotid endarterectomy donors, previously generated by our group. B, Heat map showing that plaque myofibroblasts are matched with the ACTA2+ smooth muscle cell (SMC) cluster, and specifically with the SMC1 subcluster, which represent cells with myofibroblast characteristics. The x axis corresponds to the different patients. C, UMAP of scRNA‐seq of 3 atherosclerotic plaques of carotid endarterectomies donors, generated and published by Pan et al. D, Heat map showing that plaque myofibroblasts matched with SMC‐derived intermediate cell state (ICSs), which, according to the authors, is a cluster of cells representing an intermediate state between SMCs and fibroblasts/fibrochondrocytes. The x axis corresponds to the different patients. E, UMAP of scRNA‐seq of 4 atherosclerotic coronary plaques, generated and published by Wirka et al. F, Heat map showing that plaque myofibroblasts matched with the fibromyocyte cluster, which represents cells with SMC origins and fibroblast characteristics. The x axis depicts individual patients.
Figure 5
Figure 5. Different subsets of plaque myofibroblasts.
A, Heat map showing that plaque myofibroblasts matched with the 4 smooth muscle cell (SMC) clusters, mainly with SMC1. B, Table showing the distribution of plaque myofibroblasts from 4 individual patients within the 4 SMC clusters. C, Uniform manifold approximation and projection (UMAP) generated by plotting plaque myofibroblasts with similar gene expression profiles, showing that 7 different clusters of plaque myofibroblasts can be identified. D, The 2 top genes expressed in the 7 clusters were plotted in a dot plot showing differences among plaque myofibroblast cluster profiles. E, UMAP of male and female plaque myofibroblasts showing sex‐specific patterns.
Figure 6
Figure 6. Plaque myofibroblasts have smooth muscle cell (SMC) origin.
Chromatin immunoprecipitation sequencing (ChIP‐seq) occupancy of H3K4me3 and H3K27ac in human coronary artery SMCs (HCASMCs) and plaque myofibroblasts at a specific locus of the MYH11 promoter.
Figure 7
Figure 7. Application of plaque myofibroblasts.
A, Representative fluorescence image showing GFP (green fluorescent protein)‐positive plaque myofibroblasts (biological replicate=1) 72 hours after lentiviral transduction. Bars=400 μm. B, Flow cytometry scatterplots showing GFP‐positive plaque myofibroblasts (biological replicate=2) 72 after transduction. Control nontransduced plaque myofibroblasts are shown in (i), whereas the transduced ones are in (ii). C, Representative fluorescence images of plaque myofibroblasts (biological replicate=3) and human coronary artery smooth muscle cells (HCASMCs) (individual technical replicate=3), showing the uptake of oxidized low‐density lipoprotein (oxLDL) (red) after 24 hours of exposure at different concentrations (0, 50, 100, and 200 μg/mL). Bars=200 μm. D, Bar plot showing the quantified oxLDL taken up by plaque myofibroblasts and HCASMCs when compared with untreated control (0). Normalized for confluency. ****P≤0.0001. E, Representative transmitted light images showing Alazarin red staining to visualize the deposition of calcified matrix in plaque myofibroblasts (biological replicate=1) and HASMCs after 14 and 21 days of osteogenic stimulation and expansion control culture. Bars=400 μm.

References

    1. Alexander MR, Owens GK. Epigenetic control of smooth muscle cell differentiation and phenotypic switching in vascular development and disease. Annu Rev Physiol. 2012;74:13–40. doi: 10.1146/annurev-physiol-012110-142315 - DOI - PubMed
    1. Martos‐Rodríguez CJ, Albarrán‐Juárez J, Morales‐Cano D, Caballero A, MacGrogan D, de la Pompa JL, Carramolino L, Bentzon JF. Fibrous caps in atherosclerosis form by Notch‐dependent mechanisms common to arterial media development. Arterioscler Thromb Vasc Biol. 2021;41:e427–e439. doi: 10.1161/ATVBAHA.120.315627 - DOI - PubMed
    1. Newman AAC, Serbulea V, Baylis RA, Shankman LS, Bradley X, Alencar GF, Owsiany K, Deaton RA, Karnewar S, Shamsuzzaman S, et al. Multiple cell types contribute to the atherosclerotic lesion fibrous cap by PDGFRβ and bioenergetic mechanisms. Nat Metab. 2021;3:166–181. doi: 10.1038/s42255-020-00338-8 - DOI - PMC - PubMed
    1. Hartman RJG, Owsiany K, Ma L, Koplev S, Hao K, Slenders L, Civelek M, Mokry M, Kovacic JC, Pasterkamp G, et al. Sex‐stratified gene regulatory networks reveal female key driver genes of atherosclerosis involved in smooth muscle cell phenotype switching. Circulation. 2021;143:713–726. doi: 10.1161/CIRCULATIONAHA.120.051231 - DOI - PMC - PubMed
    1. Wirka RC, Wagh D, Paik DT, Pjanic M, Nguyen T, Miller CL, Kundu R, Nagao M, Coller J, Koyano TK, et al. Atheroprotective roles of smooth muscle cell phenotypic modulation and the TCF21 disease gene as revealed by single‐cell analysis. Nat Med. 2019;25:1280–1289. doi: 10.1038/s41591-019-0512-5 - DOI - PMC - PubMed

Publication types

MeSH terms