Review
. 2024 Feb;46(1):171-181.
doi: 10.1007/s11357-023-00984-2. Epub 2023 Oct 27.

Comparative analysis of animal lifespan

Collaborators, Affiliations
Review

Comparative analysis of animal lifespan

Nicole C Riddle et al. Geroscience. 2024 Feb.

Abstract

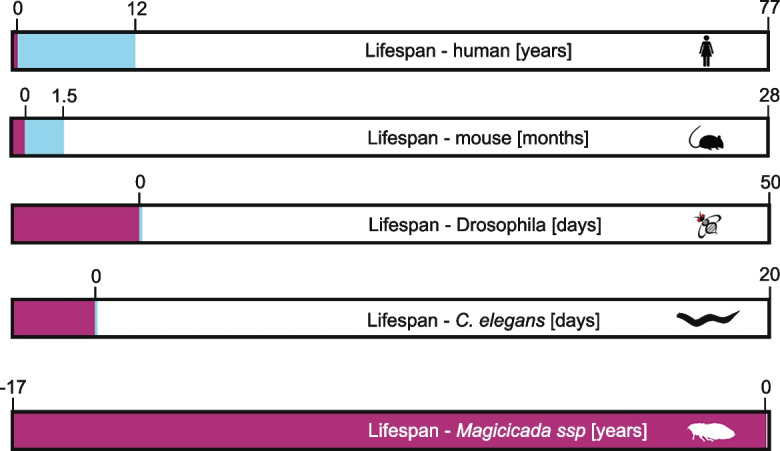
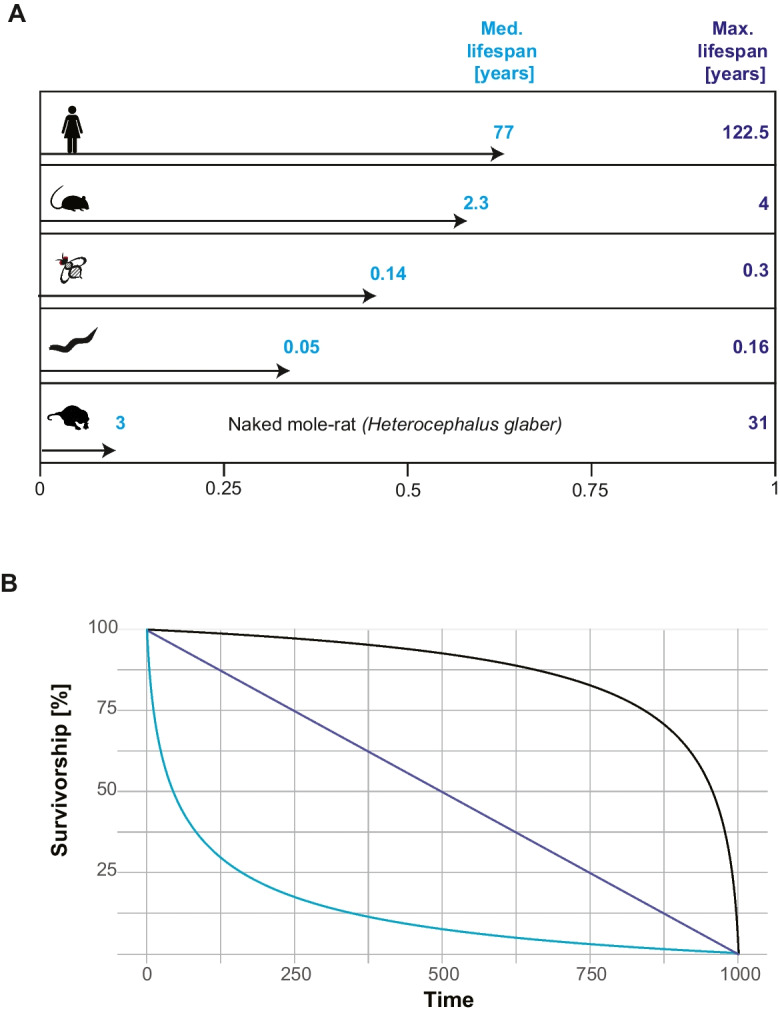
Comparative studies of aging are a promising approach to identifying general properties of and processes leading to aging. While to date, many comparative studies of aging in animals have focused on relatively narrow species groups, methodological innovations now allow for studies that include evolutionary distant species. However, comparative studies of aging across a wide range of species that have distinct life histories introduce additional challenges in experimental design. Here, we discuss these challenges, highlight the most pressing problems that need to be solved, and provide suggestions based on current approaches to successfully carry out comparative aging studies across the animal kingdom.

Keywords: Aging; Comparative biology; Lifespan; Models of aging.


Conflict of interest statement

The authors declare no competing interests.

Figures

Fig. 1
Fig. 1
How age is counted differs between organisms. Different scientific communities use different methods for how the age of an organism is counted. This diagram shows the entire life of five organisms from fertilization to death, all scaled to the same length bar. Each bar shows in the red shade the time the organism develops before the “zero” time point when the age count typically starts. The blue shade marks the time before the organism is sexually mature that is included in the age count for each species. For humans (top), the 9 months of development before birth are excluded from the age count, but the approximately 12 years prior to sexual maturity are included in the average 77-year lifespan. Similarly, for mice (second from top), the approximately 20 days of development before birth are excluded from the age count, but the approximately 6 weeks prior to sexual maturity are included in the average 28-month lifespan. For Drosophila (middle), the 10 days of development (in the egg and as larva) prior to the eclosion of the adult animal from the pupa are excluded from the age count, while the 8 h prior to sexual maturity are included in the average 50-day lifespan. For C. elegans (second from bottom), the 2.5 days prior to the adult stage (2.5 h of development prior to egg laying, 12 h development to hatching, four larval stages) are excluded from the age count, but the 8 h prior to sexual maturity are included in the approximately 20-day lifespan. Finally, in the extreme example of periodic cicadas (bottom), the 4–6 weeks of development in the egg and the 17 years of development underground are excluded from the age count, but the 4–10 days before the adult cicada reaches sexual maturity are in the approximately 1-month lifespan
Fig. 2
Fig. 2
Approaches to identifying animals of comparable ages between species. A Relative age. Relative age is calculated by dividing an individual’s age by the maximum lifespan reported for the species. Thus, ages for any species are scaled to the range of 0–1. Above, this is illustrated for humans, mice, Drosophila, C. elegans, and the naked mole rat. The arrow indicates the median lifespan reported for these species, which highlights one of the problems of this approach. Depending on how much the maximum reported lifespan deviates from the median lifespan, it can be much harder or easier to collect animals in the upper ranges of relative age. B Percent survivorship. Percent survivorship is recorded starting with 100% of all animals being alive at the 0-time point and 0% of animals being alive at the maximum lifespan (1000) for the animal (time in arbitrary units on the X-axis; % survivorship on the Y-axis). Three idealized survivorship curves are shown. In black is a type I survivorship curve, where most individuals survive until fairly close to the maximum lifespan when the rate of death increases sharply and many animals die in a short period of time. In purple is a type II survivorship curve, where animals die at a more or less constant rate throughout their lifespan. Animal populations with a type III survivorship curve show high levels of deaths early in life, but after this period show much slower, relatively constant rates of deaths. While % survivorship can be used to compare species with a variety of survivorship curves, this diagram illustrates that for any given % survivorship, the animals might be in very different fractions of their total lifespan

References

    1. Alper SJ, Bronikowski AM, Harper JM. Comparative cellular biogerontology: where do we stand? Exp gerontol. 2015;71:109–117. doi: 10.1016/j.exger.2015.08.018. - DOI - PubMed
    1. Ma S, Gladyshev VN. Molecular signatures of longevity: insights from cross-species comparative studies. Semin cell dev biol. 2017;70:190–203. doi: 10.1016/j.semcdb.2017.08.007. - DOI - PMC - PubMed
    1. Sanchez JR, et al. Multifactorial processes to slowing the biological clock: insights from a comparative approach. Exp gerontol. 2015;71:27–37. doi: 10.1016/j.exger.2015.08.017. - DOI - PubMed
    1. Lee R, Mason A. Cost of aging. Finance dev. 2017;54(1):7–9. - PMC - PubMed
    1. Van Houtven G, Honeycutt AA, Gilman B, McCall NT, Throneburg WW, Sykes KE. Costs of illness among older adults: an analysis of six major health conditions with significant environmental risk factors [Internet]. Research Triangle Park (NC): RTI Press; 2008 - PubMed

Publication types