. 2024 Jan 16;84(2):276-290.
doi: 10.1158/0008-5472.CAN-23-0902.

HSF1 Inhibits Antitumor Immune Activity in Breast Cancer by Suppressing CCL5 to Block CD8+ T-cell Recruitment

Affiliations

HSF1 Inhibits Antitumor Immune Activity in Breast Cancer by Suppressing CCL5 to Block CD8+ T-cell Recruitment

Curteisha Jacobs et al. Cancer Res. .

Abstract

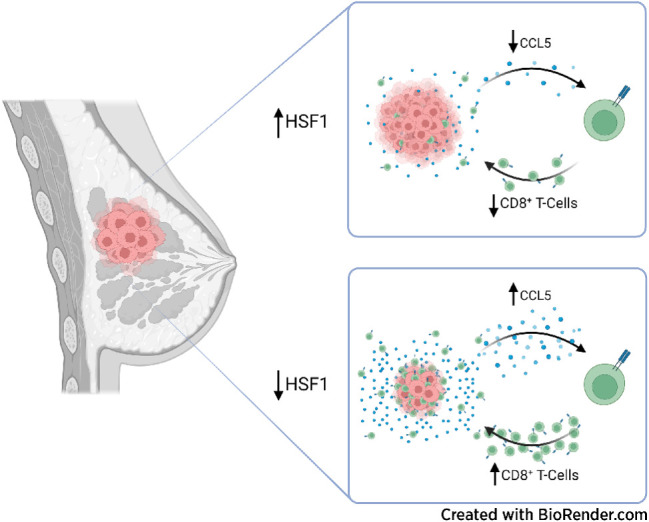
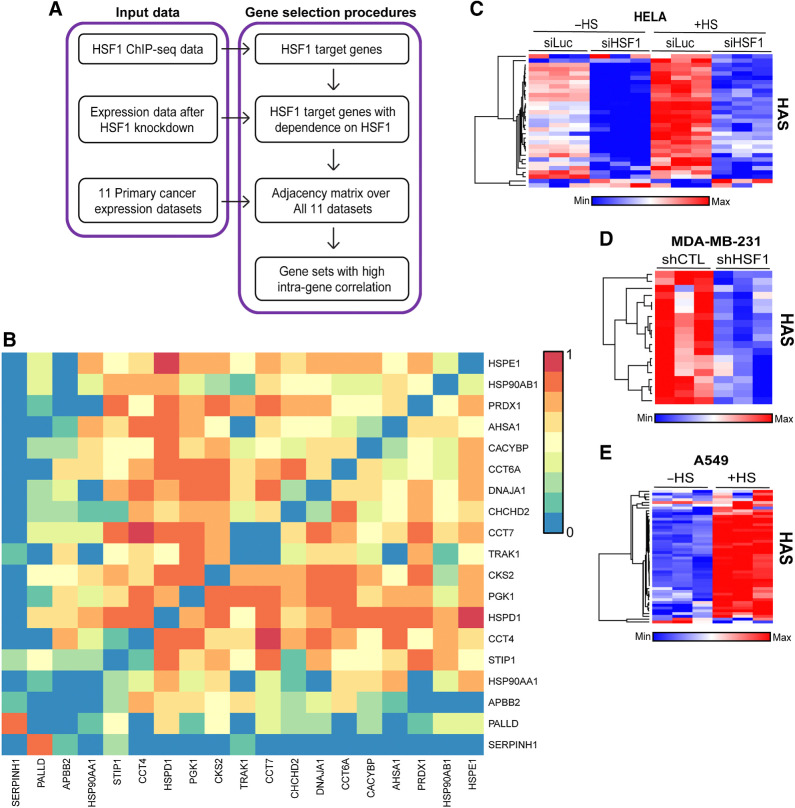
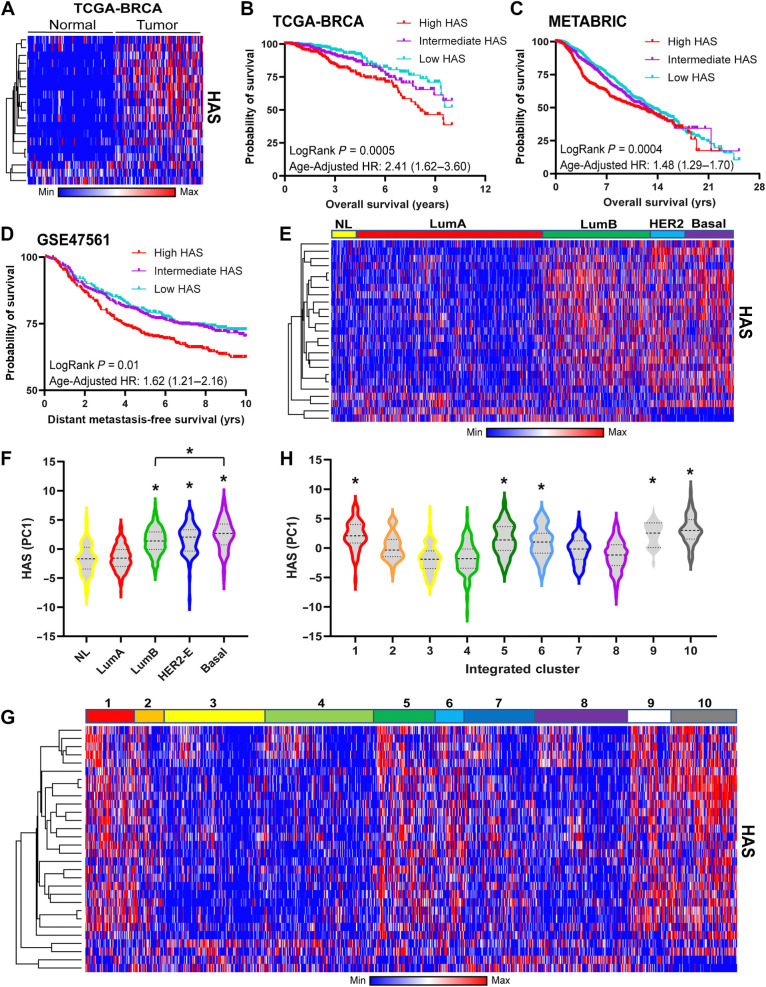
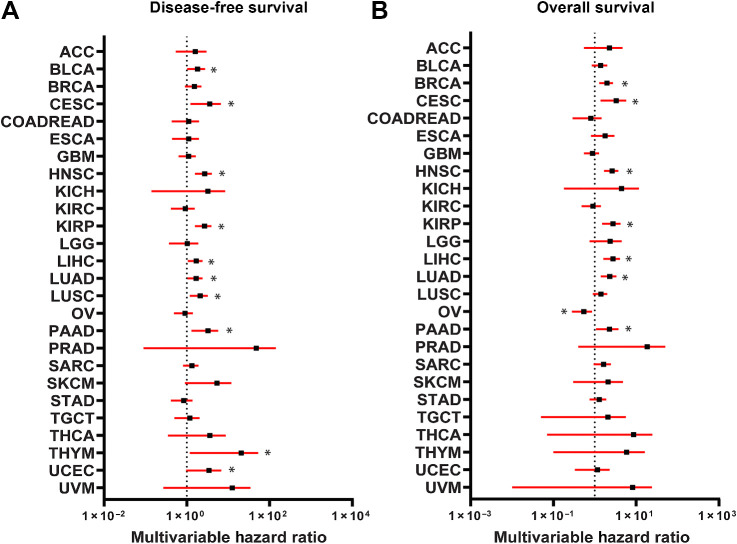
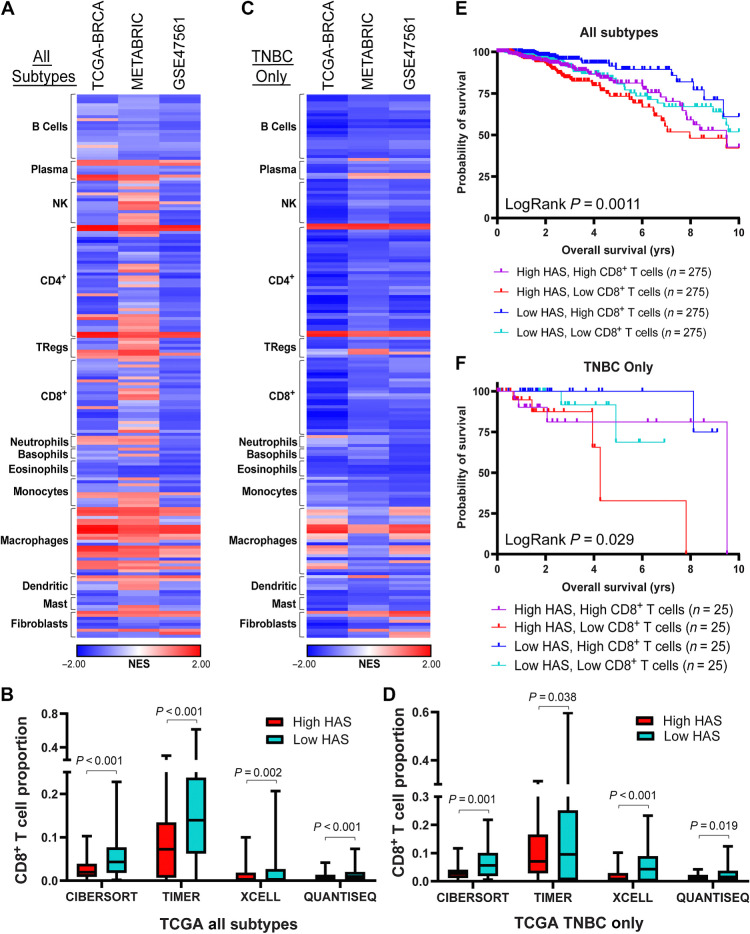
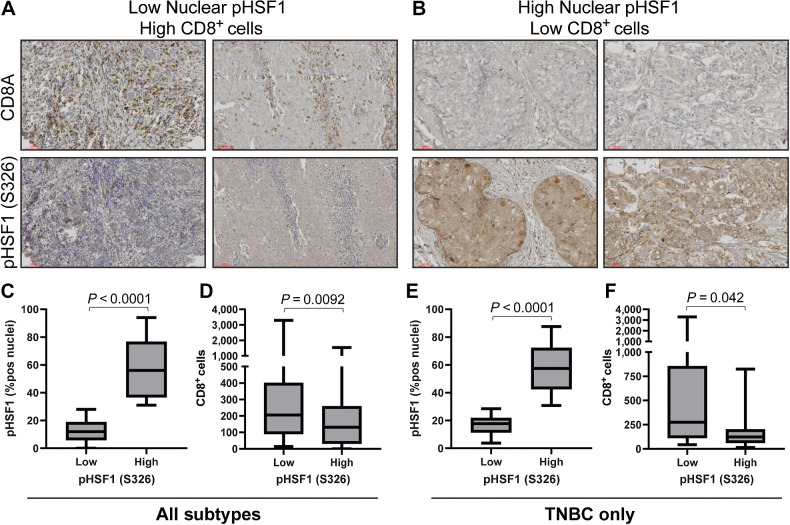
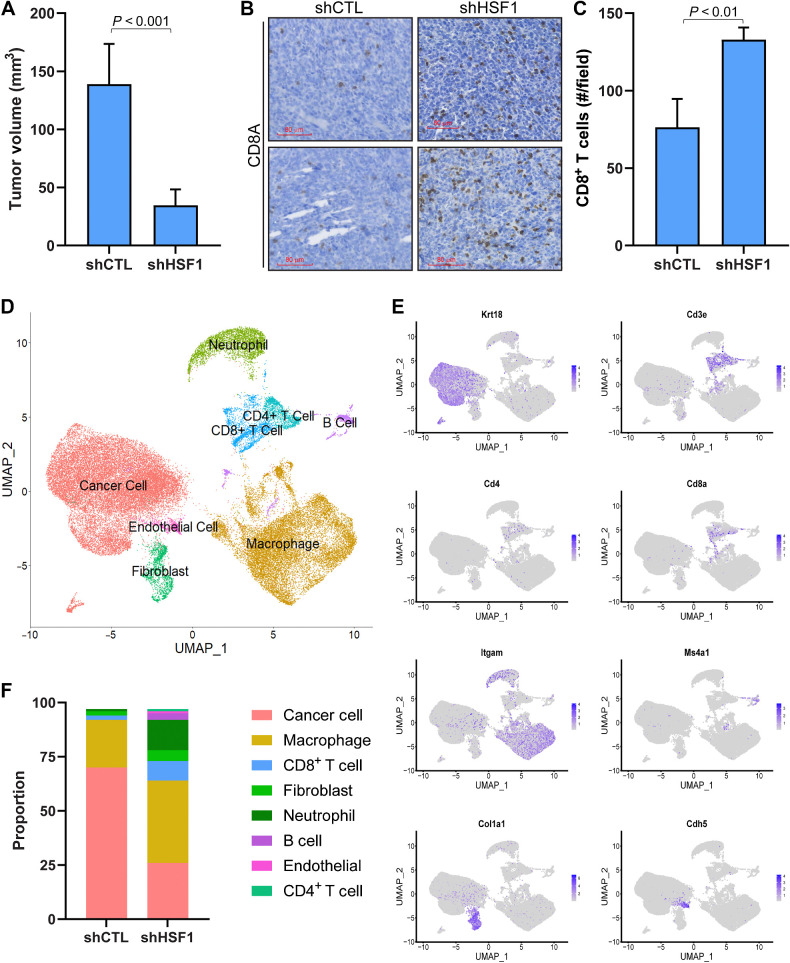
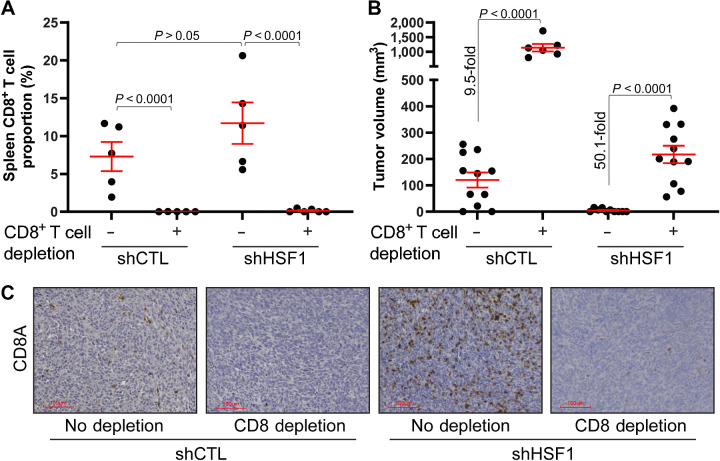
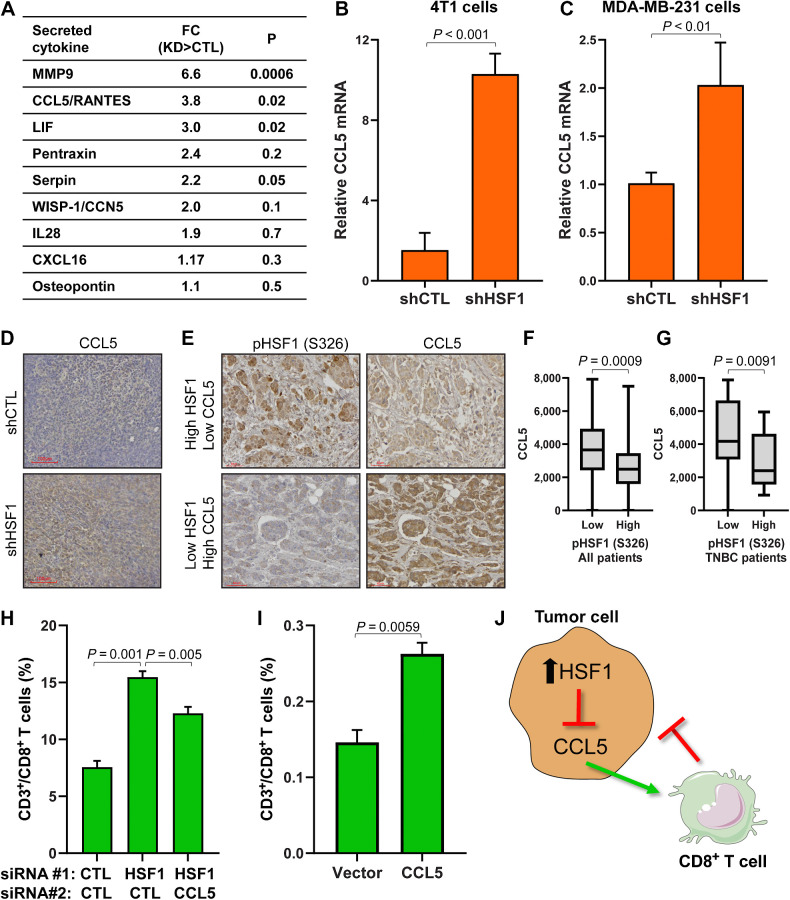
Heat shock factor 1 (HSF1) is a stress-responsive transcription factor that promotes cancer cell malignancy. To provide a better understanding of the biological processes regulated by HSF1, here we developed an HSF1 activity signature (HAS) and found that it was negatively associated with antitumor immune cells in breast tumors. Knockdown of HSF1 decreased breast tumor size and caused an influx of several antitumor immune cells, most notably CD8+ T cells. Depletion of CD8+ T cells rescued the reduction in growth of HSF1-deficient tumors, suggesting HSF1 prevents CD8+ T-cell influx to avoid immune-mediated tumor killing. HSF1 suppressed expression of CCL5, a chemokine for CD8+ T cells, and upregulation of CCL5 upon HSF1 loss significantly contributed to the recruitment of CD8+ T cells. These findings indicate that HSF1 suppresses antitumor immune activity by reducing CCL5 to limit CD8+ T-cell homing to breast tumors and prevent immune-mediated destruction, which has implications for the lack of success of immune modulatory therapies in breast cancer.

Significance: The stress-responsive transcription factor HSF1 reduces CD8+ T-cell infiltration in breast tumors to prevent immune-mediated killing, indicating that cellular stress responses affect tumor-immune interactions and that targeting HSF1 could improve immunotherapies.


Figures

None
Graphical abstract
Figure 1. Identification of the HAS. A, The schema for identifying an HSF1 activity signature, which included input data from ChIP-seq data to identify direct targets, followed by removing genes not dependent on HSF1 for their expression and finally generating gene sets that have high intragene correlation. B, Correlation matrix of the 19-gene HAS across 11 cancer datasets. C–E, Heat maps were generated from publicly available expression data from HeLa cells with HSF1 knockdown and/or heat stress (C), MDA-MB-231 cells with or without HSF1 knockdown (D), and A549 cells with or without heat stress (E).
Figure 1.
Identification of the HAS. A, The schema for identifying an HSF1 activity signature, which included input data from ChIP-seq data to identify direct targets, followed by removing genes not dependent on HSF1 for their expression and finally generating gene sets that have high intragene correlation. B, Correlation matrix of the 19-gene HAS across 11 cancer datasets. CE, Heat maps were generated from publicly available expression data from HeLa cells with HSF1 knockdown and/or heat stress (C), MDA-MB-231 cells with or without HSF1 knockdown (D), and A549 cells with or without heat stress (E).
Figure 2. HAS is associated with breast cancer outcomes and molecular subtypes. A, Heat map was generated using matched adjacent normal and tumor expression data from the TCGA-BRCA cohort (n = 100). B–D, Patients in the TCGA-BRCA (B), METABRIC (C), and GSE47561 (D) cohorts were sorted by their HAS scores and Kaplan–Meier plots were generated for overall survival (B and C) or metastasis-free survival (D). Patients in these analyses were separated into equal tertiles based on HAS scores. E and F, Heat map (E) was generated for the HAS of the METABRIC cohort delineated by PAM50 subtype and HAS PC1 scores (F) for each subtype were compared across subtypes via one-way ANOVA with Tukey post hoc test. *, significance compared with normal-like. G and H, Heat map (G) was generated for the HAS of the METABRIC cohort delineated by Integrated METABRIC Clusters and PC1 scores (H) were plotted across Integrated METABRIC Clusters. *, significance compared with the lowest cluster (#3). NL, normal-Like; LumA, luminal A; LumB, luminal B; HER2-E, HER2-enriched.
Figure 2.
HAS is associated with breast cancer outcomes and molecular subtypes. A, Heat map was generated using matched adjacent normal and tumor expression data from the TCGA-BRCA cohort (n = 100). BD, Patients in the TCGA-BRCA (B), METABRIC (C), and GSE47561 (D) cohorts were sorted by their HAS scores and Kaplan–Meier plots were generated for overall survival (B and C) or metastasis-free survival (D). Patients in these analyses were separated into equal tertiles based on HAS scores. E and F, Heat map (E) was generated for the HAS of the METABRIC cohort delineated by PAM50 subtype and HAS PC1 scores (F) for each subtype were compared across subtypes via one-way ANOVA with Tukey post hoc test. *, significance compared with normal-like. G and H, Heat map (G) was generated for the HAS of the METABRIC cohort delineated by Integrated METABRIC Clusters and PC1 scores (H) were plotted across Integrated METABRIC Clusters. *, significance compared with the lowest cluster (#3). NL, normal-Like; LumA, luminal A; LumB, luminal B; HER2-E, HER2-enriched.
Figure 3. Association of HAS with outcomes across TCGA cancer types. A and B, Cox proportional HRs were calculated for HAS across the TCGA cancer types for disease-free survival (A) and overall survival (B) and were controlled for age, sex, race, and histologic subtype. Forest plots were generated with HRs (black square) with 95% confidence intervals (red bars). Black dotted line indicates a HR of 1. HRs >1 indicate HAS is associated worse survival. *, significant (P < 0.05) HRs.
Figure 3.
Association of HAS with outcomes across TCGA cancer types. A and B, Cox proportional HRs were calculated for HAS across the TCGA cancer types for disease-free survival (A) and overall survival (B) and were controlled for age, sex, race, and histologic subtype. Forest plots were generated with HRs (black square) with 95% confidence intervals (red bars). Black dotted line indicates a HR of 1. HRs >1 indicate HAS is associated worse survival. *, significant (P < 0.05) HRs.
Figure 4. HAS is negatively associated with presence of CD8+ T cells. A, GSEA was performed in TCGA-BRCA, METABRIC, and GSE47561 cohorts with patients separated into high or low HAS scores. Signatures for immune cell types were assessed for enrichment with high or low HAS patients. Normalized enrichment scores (NES) are plotted on a heat map. B, CD8+ T-cell proportions were estimated in the TCGA-BRCA cohort using the indicated deconvolution algorithms and plotted for high and low HAS patients. C, GSEA was performed as in A using only patients with TNBC in the TCGA-BRCA cohort. D, CD8+ T-cell proportions were estimated in patients with TNBC in the TCGA-BRCA cohort using the indicated deconvolution algorithms and plotted for patients with high and low HAS. E and F, Patients in the TCGA-BRCA cohort were separated by HAS scores and CD8+ T-cell proportions estimated by CIBERSORT and Kaplan–Meier graphs were plotted for patient outcomes using patients from all subtypes (E) or only patients with TNBC (F). Sample size for each group is indicated in the graph legend. Log-rank test was used to compute P values. NK, natural killer cells; Tregs, T regulatory cells.
Figure 4.
HAS is negatively associated with presence of CD8+ T cells. A, GSEA was performed in TCGA-BRCA, METABRIC, and GSE47561 cohorts with patients separated into high or low HAS scores. Signatures for immune cell types were assessed for enrichment with high or low HAS patients. Normalized enrichment scores (NES) are plotted on a heat map. B, CD8+ T-cell proportions were estimated in the TCGA-BRCA cohort using the indicated deconvolution algorithms and plotted for high and low HAS patients. C, GSEA was performed as in A using only patients with TNBC in the TCGA-BRCA cohort. D, CD8+ T-cell proportions were estimated in patients with TNBC in the TCGA-BRCA cohort using the indicated deconvolution algorithms and plotted for patients with high and low HAS. E and F, Patients in the TCGA-BRCA cohort were separated by HAS scores and CD8+ T-cell proportions estimated by CIBERSORT and Kaplan–Meier graphs were plotted for patient outcomes using patients from all subtypes (E) or only patients with TNBC (F). Sample size for each group is indicated in the graph legend. Log-rank test was used to compute P values. NK, natural killer cells; Tregs, T regulatory cells.
Figure 5. Active HSF1 in breast cancer tumor specimens coincides with low CD8+ T cells. A and B, A cohort of 114 breast tumors were subjected to IHC with antibodies for CD8A and pHSF1 (S326). C and D, All patients (n = 114) were separated into high (n = 46) or low (n = 68) HSF1-active tumors based on nuclear positivity percentage for pHSF1 (C) and CD8+ (D) cells were compared between these two groups based on active HSF1 levels using a Student t test. E and F, Only patients with TNBC; n = 38) were separated into high (n = 21) or low (n = 17) HSF1-active tumors based on nuclear positivity percentage for pHSF1 (E) and CD8+ (F) cells were compared between these two groups based on active HSF1 levels using a Student t test.
Figure 5.
Active HSF1 in breast cancer tumor specimens coincides with low CD8+ T cells. A and B, A cohort of 114 breast tumors were subjected to IHC with antibodies for CD8A and pHSF1 (S326). C and D, All patients (n = 114) were separated into high (n = 46) or low (n = 68) HSF1-active tumors based on nuclear positivity percentage for pHSF1 (C) and CD8+ (D) cells were compared between these two groups based on active HSF1 levels using a Student t test. E and F, Only patients with TNBC; n = 38) were separated into high (n = 21) or low (n = 17) HSF1-active tumors based on nuclear positivity percentage for pHSF1 (E) and CD8+ (F) cells were compared between these two groups based on active HSF1 levels using a Student t test.
Figure 6. HSF1 Functionally regulates the amount of CD8+ T cells in breast tumors. A, 4T1 cells (5 × 10⁴ cells) with (n = 5) or without (n = 5) HSF1 knockdown were grown orthotopically in Balb/c mice for 3 weeks. Tumor volume at the conclusion of the study is graphed. B, IHC was performed on tumors from A detecting CD8A to identify CD8+ T cells. C, CD8+ T cells from B were quantified for control and HSF1 knockdown tumors by manual counting positive cells in >5 fields of the tumor tissue area. D–F, shCTL and shHSF1 tumors from A were subjected to scRNA-seq. Processed reads were used to map cell clusters for both samples using Seurat 4.2.0. The Uniform Manifold Approximation and Projection (UMAP) integrating both samples is shown in D. These cell types were annotated using expression of specific marker genes for each population, for which a sample of these marker genes is shown in E. The proportion of each cell population was also calculated and graphed in F.
Figure 6.
HSF1 Functionally regulates the amount of CD8+ T cells in breast tumors. A, 4T1 cells (5 × 10⁴ cells) with (n = 5) or without (n = 5) HSF1 knockdown were grown orthotopically in Balb/c mice for 3 weeks. Tumor volume at the conclusion of the study is graphed. B, IHC was performed on tumors from A detecting CD8A to identify CD8+ T cells. C, CD8+ T cells from B were quantified for control and HSF1 knockdown tumors by manual counting positive cells in >5 fields of the tumor tissue area. DF, shCTL and shHSF1 tumors from A were subjected to scRNA-seq. Processed reads were used to map cell clusters for both samples using Seurat 4.2.0. The Uniform Manifold Approximation and Projection (UMAP) integrating both samples is shown in D. These cell types were annotated using expression of specific marker genes for each population, for which a sample of these marker genes is shown in E. The proportion of each cell population was also calculated and graphed in F.
Figure 7. Depletion of CD8+ T cells rescues tumor growth after HSF1 knockdown. A, Balb/c mice were given either PBS control or CD8A antibodies to deplete CD8+ T cells in vivo. Control and HSF1 knockdown cells were then grown orthotopically for 3 weeks. Spleens were collected at the conclusion of the study, dissociated, and cells were subjected to flow cytometry to confirm the depletion of CD8+ T cells. B, Tumor volume at the conclusion of the study from A is plotted. C, Tumor tissue from B was subjected to IHC for CD8A to assess the CD8+ T cells.
Figure 7.
Depletion of CD8+ T cells rescues tumor growth after HSF1 knockdown. A, Balb/c mice were given either PBS control or CD8A antibodies to deplete CD8+ T cells in vivo. Control and HSF1 knockdown cells were then grown orthotopically for 3 weeks. Spleens were collected at the conclusion of the study, dissociated, and cells were subjected to flow cytometry to confirm the depletion of CD8+ T cells. B, Tumor volume at the conclusion of the study from A is plotted. C, Tumor tissue from B was subjected to IHC for CD8A to assess the CD8+ T cells.
Figure 8. HSF1 suppresses CCL5 to prevent attraction of CD8+ T cells. A, Conditioned media was grown for 72 hours on control or HSF1 knockdown 4T1 cells. Conditioned media was then subjected to a cytokine array detecting over 100 cytokines. Cytokines are ordered by P value and fold change (FC) is calculated as HSF1 knockdown (KD) divided by control (CTL) cells. B and C, CCL5 mRNA levels in control and HSF1 knockdown 4T1 (B) and MDA-MB-231 (C) cells assessed by RT-qPCR. D, IHC of CCL5 in 4T1 control and HSF1 knockdown tumors from Fig. 6A. E, Tumor specimens from Fig. 5 were subjected to IHC for CCL5. CCL5 levels were quantified by QuPath. F, CCL5 levels are plotted in high (n = 46) or low (n = 68) active HSF1 tumors from all patients (n = 114). G, CCL5 levels are plotted in high (n = 21) or low (n = 17) active HSF1 tumors from patients with TNBC (n = 38). H, Conditioned media from 4T1 cells expressing either control, HSF1, or HSF1+CCL5 siRNA were placed in the bottom chamber for the T-cell transwell migration assay. CD8+ T-cell proportions are plotted for each group (n = 5) and statistically compared using one-way ANOVA with Tukey post hoc test. I, Conditioned media from 4T1 cells expressing either empty vector or CCL5-expressing construct were placed in the bottom chamber for the T-cell transwell migration assay. CD8+ T-cell proportions are plotted for each group (n = 3) and statistically compared using one-way ANOVA with Tukey post hoc test. J, Model indicating HSF1 suppresses CCL5 expression and secretion, leading to decreased attraction of CD8+ T cells toward breast cancer cells.
Figure 8.
HSF1 suppresses CCL5 to prevent attraction of CD8+ T cells. A, Conditioned media was grown for 72 hours on control or HSF1 knockdown 4T1 cells. Conditioned media was then subjected to a cytokine array detecting over 100 cytokines. Cytokines are ordered by P value and fold change (FC) is calculated as HSF1 knockdown (KD) divided by control (CTL) cells. B and C,CCL5 mRNA levels in control and HSF1 knockdown 4T1 (B) and MDA-MB-231 (C) cells assessed by RT-qPCR. D, IHC of CCL5 in 4T1 control and HSF1 knockdown tumors from Fig. 6A. E, Tumor specimens from Fig. 5 were subjected to IHC for CCL5. CCL5 levels were quantified by QuPath. F, CCL5 levels are plotted in high (n = 46) or low (n = 68) active HSF1 tumors from all patients (n = 114). G, CCL5 levels are plotted in high (n = 21) or low (n = 17) active HSF1 tumors from patients with TNBC (n = 38). H, Conditioned media from 4T1 cells expressing either control, HSF1, or HSF1+CCL5 siRNA were placed in the bottom chamber for the T-cell transwell migration assay. CD8+ T-cell proportions are plotted for each group (n = 5) and statistically compared using one-way ANOVA with Tukey post hoc test. I, Conditioned media from 4T1 cells expressing either empty vector or CCL5-expressing construct were placed in the bottom chamber for the T-cell transwell migration assay. CD8+ T-cell proportions are plotted for each group (n = 3) and statistically compared using one-way ANOVA with Tukey post hoc test. J, Model indicating HSF1 suppresses CCL5 expression and secretion, leading to decreased attraction of CD8+ T cells toward breast cancer cells.

References

    1. American Cancer Society. Cancer Facts & Figures 2023. Atlanta, GA; 2023. Available from: https://www.cancer.org/content/dam/cancer-org/research/cancer-facts-and-....
    1. Gaynor N, Crown J, Collins DM. Immune checkpoint inhibitors: key trials and an emerging role in breast cancer. Semin Cancer Biol 2022;79:44–57. - PubMed
    1. Yoshihara K, Shahmoradgoli M, Martínez E, Vegesna R, Kim H, Torres-Garcia W, et al. . Inferring tumour purity and stromal and immune cell admixture from expression data. Nat Commun 2013;4:2612. - PMC - PubMed
    1. Jamiyan T, Kuroda H, Yamaguchi R, Nakazato Y, Noda S, Onozaki M, et al. . Prognostic impact of a tumor-infiltrating lymphocyte subtype in triple negative cancer of the breast. Breast Cancer 2020;27:880–92. - PMC - PubMed
    1. Loi S, Drubay D, Adams S, Pruneri G, Francis PA, Lacroix-Triki M, et al. . Tumor-infiltrating lymphocytes and prognosis: a pooled individual patient analysis of early-stage triple-negative breast cancers. J Clin Oncol 2019;37:559–69. - PMC - PubMed

Publication types

MeSH terms