. 2023 Dec:68:102944.
doi: 10.1016/j.redox.2023.102944. Epub 2023 Oct 21.

Nogo-B mediates endothelial oxidative stress and inflammation to promote coronary atherosclerosis in pressure-overloaded mouse hearts

Affiliations

Nogo-B mediates endothelial oxidative stress and inflammation to promote coronary atherosclerosis in pressure-overloaded mouse hearts

Yu Zhang et al. Redox Biol. 2023 Dec.

Abstract

Aims: Endothelial dysfunction plays a pivotal role in atherosclerosis, but the detailed mechanism remains incomplete understood. Nogo-B is an endoplasmic reticulum (ER)-localized protein mediating ER-mitochondrial morphology. We previously showed endothelial Nogo-B as a key regulator of endothelial function in the setting of hypertension. Here, we aim to further assess the role of Nogo-B in coronary atherosclerosis in ApoE-/- mice with pressure overload.

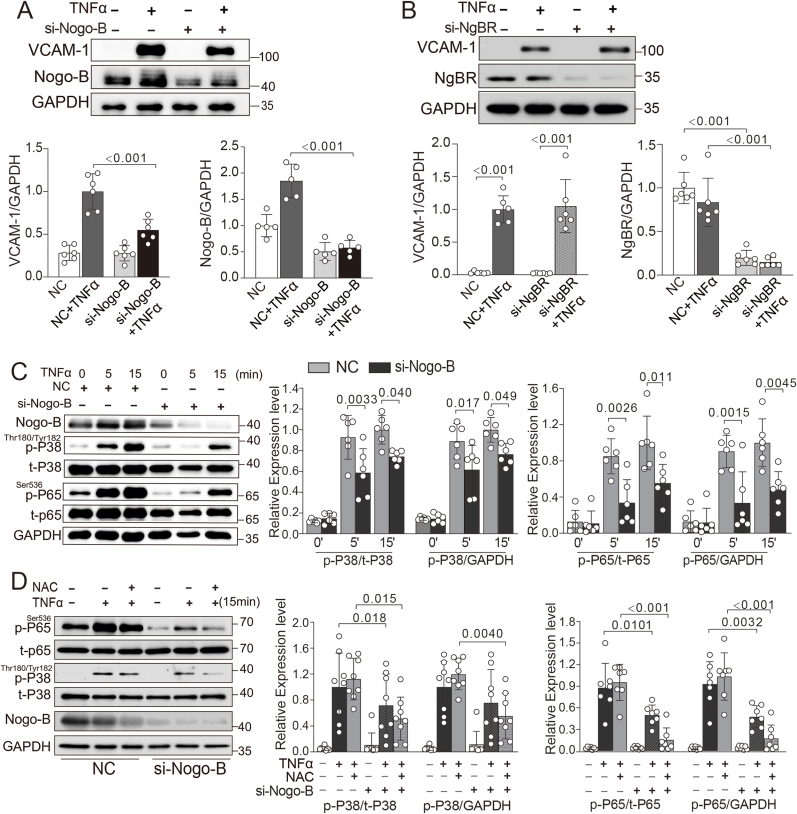
Methods and results: We generated double knockout (DKO) mouse models of systemically or endothelium-specifically excising Nogo-A/B gene on an ApoE-/- background. After 7 weeks of transverse aortic constriction (TAC) surgery, compared to ApoE-/- mice DKO mice were resistant to the development of coronary atherosclerotic lesions and plaque rapture. Sustained elevation of Nogo-B and adhesion molecules (VCAM-1/ICAM-1), early markers of atherosclerosis, was identified in heart tissues and endothelial cells (ECs) isolated from TAC ApoE-/- mice, changes that were significantly repressed by Nogo-B deficiency. In cultured human umbilical vein endothelial cells (HUVECs) exposure to inflammatory cytokines (TNF-α, IL-1β), Nogo-B was upregulated and activated reactive oxide species (ROS)-p38-p65 signaling axis. Mitofusin 2 (Mfn2) is a key protein tethering ER to mitochondria in ECs, and we showed that Nogo-B expression positively correlated with Mfn2 protein level. And Nogo-B deletion in ECs or in ApoE-/- mice reduced Mfn2 protein content and increased ER-mitochondria distance, reduced ER-mitochondrial Ca2+ transport and mitochondrial ROS generation, and prevented VCAM-1/ICAM-1 upregulation and EC dysfunction, eventually restrained atherosclerotic lesions development.

Conclusion: Our study revealed that Nogo-B is a critical modulator in promoting endothelial dysfunction and consequent pathogenesis of coronary atherosclerosis in pressure overloaded hearts of ApoE-/- mice. Nogo-B may hold the promise to be a common therapeutic target in the setting of hypertension.

Keywords: Coronary atherosclerosis; Mitochondria; Nogo-B; Pressure overload; Reactive oxygen species.


Conflict of interest statement

Declaration of competing interest The authors declare that there are no confilct of interests.

Figures

Image 1
Graphical abstract
Fig. 1
Fig. 1
Nogo-B upregulated in heart tissues of ApoE−/−mice after TAC. (A) Immunofluorescence staining of heart sections with Nogo-B (red), endothelial cell marker VE-cadherin (VEC, green) and nuclei DAPI, from ApoE−/− mice after 24-h or (B) 7 weeks TAC. Scale bar: 20 μm. (CE) Representative Western blotting images and quantifications of protein levels of Nogo-B in whole heart tissues from ApoE−/− and Nogo-A/B−/−ApoE−/− (DKO) mice subject to 24-h (C), or 72-h (D), or 7-week (E) sham and TAC operation. n ≥ 5 mice/group. P value with statistical significance were labeled above the connected lines between indicated groups (one-way ANOVA with Tukey's multiple comparisons test). (For interpretation of the references to colour in this figure legend, the reader is referred to the Web version of this article.)
Fig. 2
Fig. 2
Deficiency of Nogo-B alleviated LCA atherosclerotic lesion in ApoE−/−mice subjected to TAC for 7 weeks. (A) Representative images of hearts from sham- and 7-week TAC-operated ApoE−/− and Nogo-A/B−/−ApoE−/− (DKO) mice. The black arrows indicate the lipid deposition in LCA (middle) and the white arrows indicated the infarct area (right). Scale bar: 2 mm. (B) Representative M-mode echocardiographic images and LV fractional shortening (FS) at each group (n ≥ 6 mice/group). (C) Schematic plot showing sequential sectioning of hearts at every 200 μm, and (D) statistics of LCA plaque areas in each section alongside aortic valve to apex in TAC mice (n = 7 hearts/group). (E) Representative Oil Red O-staining lipid deposition images (left) and distribution (right) of LCA plaque phenotypes calculated from each section alongside aortic valve to apex in hearts from mice with TAC. n = 7 mice/group. (F) Representative Oil Red O staining images and the quantification of plaque size at aortic roots of mice post TAC. Scale bar: 200 μm. n ≥ 7 mice/group. (G) Cardiac interstitial or patch fibrosis identified by Masson's trichome staining (upper) or αSMA (green)/DAPI (blue) immunofluorescence staining (lower). Scale bar: 20 μm. (H) Representative immunofluorescence images and quantification of (I) αSMA positive fibrous cap (white box indicated) and (J) DAPI negatively stained necrotic core (yellow box indicated) in LCA plaques of mouse hearts 7 weeks post-TAC (n = 8 mice/group). (For interpretation of the references to colour in this figure legend, the reader is referred to the Web version of this article.)
Fig. 3
Fig. 3
Inflammatory stimuli or oscillatory shear stress (OSS) upregulated expression of endothelial Nogo-B and adhesion molecules. (A) Immunofluorescence staining of HUVECs with Nogo-B (green), VCAM-1 (red) and nuclei DAPI, from static or 24-h OSS stimulation. Scale bar: 20 μm. (B) Quantification of mean fluorescence intensity (MFI) of Nogo-B and VCAM-1 in static and 24-h OSS stimulation. n = 6 independent experiments for each group. (C) mRNA level of Nogo-B and VCAM-1 in HUVECs under static condition or 24-h OSS stimuli. n = 9 independent experiments for each group. (D) Representative Western blotting images and quantifications of protein levels of VCAM-1 in whole heart tissues from ApoE−/− and DKO mice of Sham or 24-h TAC operation. n = 6 mice/group. (E) Plasma TNFα levels from ApoE−/− and DKO mice 24-h post sham or TAC surgery, n ≥ 7 mice/group. (F) Representative Western blotting images and quantifications of protein levels of VCAM-1 or Nogo-B in MCECs prepared from ApoE−/− and DKO mice and treated with vehicle or TNFα for 24 h. n = 6 independent isolations. (G) Western blot analysis of VCAM-1, ICAM-1, and Nogo-B in HUVECs treated with concentrations (0–200 ng/ml, 24 h) of TNFα. n ≥ 5 independent experiments. (For interpretation of the references to colour in this figure legend, the reader is referred to the Web version of this article.)
Fig. 4
Fig. 4
Nogo-B augmented mitochondrial ROS production and subsequent activation of the p38-p65 pathway in HUVECs upon TNFα stimulation. Silencing Nogo-B in HUVECs with siRNAs eliminated the TNFα-stimulated VCAM-1 expression (A), but silencing NgBR had no effect on VCAM-1 expression (B). (C) Representative Western blotting images and quantifications of protein levels for total and phosphorylated p38 and p65 in HUVECs transfected with scrambled (NC) or Nogo-B siRNA (si-Nogo-B) under vehicle or TNFα (100 nM) stimuli for 0–15 min. (D) Western blot analysis of p38-p65 levels in HUVECs transfected with NC or si-Nogo-B and stimulated with TNFα in the presence or absence of NAC (5 mM). n ≥ 6 for each group.
Fig. 5
Fig. 5
Nogo-B mediated excess ROS production in HUVECs upon TNF-α stimulation. (A) Representative confocal images of MitoSOX Red fluorescence in HUVECs. (B) Flow cytometric analysis of MitoSOX Red staining-indicated mitochondrial ROS level and quantification by MFI from scrambled (NC) or Nogo-B siRNA under vehicle or TNFα stimuli for 24 h n = 8/group. (C) Representative images of DCF fluorescence and (D) Intensity statistics and distribution of DCF fluorescence images in HUVECs under 24-h TNFα stimulation. n ≥ 80 (DCF-DA Green) cells from 6 independent experiments. (E) representative traces and (F) statistics of HPLC analysis of DHE oxidative products in HUVECs lysates transfected with scrambled (NC) or Nogo-B siRNA under vehicle or TNFα stimuli for 24 h. n = 7 independent experiments for each group. (G) NOX activity assays in TNFα-stimulated HUVECs transfected with NC or si-Nogo-B. n = 5/group. (H) Western blot analysis of NOX2 in TNFα-stimulated HUVECs transfected with NC or si-Nogo-B. n = 5/group. (For interpretation of the references to colour in this figure legend, the reader is referred to the Web version of this article.)
Fig. 6
Fig. 6
Nogo-B-activated ROS-p38-p65 pathway was responsible for adhesion molecules upregulation in ECs. (A-B) Reprsentative Western blotting images and quantifications of protein levels of VCAM-1 and Nogo-B in HUVECs transfected with NC or si-Nogo-B upon 24-h TNFα stimulation in the presence or absence of 20 μM Mitotempo (A, n = 7/group) or 5 mM NAC (B, n = 5/group). (C) Western blot analysis of VCAM-1, NOX2 and Nogo-B in HUVECs under 24-h TNFα stimuli in the presence or absence of 50 μM GSK2795039 (NOX2 inhibitors). n = 7 per group. (D-E) Western blot analysis of VCAM-1 and Nogo-B in whole heart tissue after 24-h TAC treated with vehicle or NAC or infliximab (a chimeric anti-TNFα monoclonal antibody). n = 5/group.
Fig. 7
Fig. 7
Nogo-B regulated ER-mitochondria tethering and ER-mitochondria Ca2+transport via physical interacting with Mfn2 in endothelial cells. (A) Western blot analysis of mitochondrial fission/fusion marker proteins in MCECs isolated from ApoE−/− and DKO hearts of mice. n = 6/group. (B) Immunofluorescence staining for Nogo-B (green) and Mfn2 (red) in HUVECs transfected with scrambled (NC) or si-Nogo-B siRNA. Inserts show whole cell images. DAPI stained nuclei. Scale bar: 20 μm. (C-D) Western blotting analysis of Mfn2 in HUVECs overexpressed GFP-Nogo-B or GFP. n = 6/group. (E) Immunoprecipitation of Nogo-B and blotting with Mfn2 or vice versa in HUVECs. (F) Representative electron microscopic (EM) images of ER and mitochondria in coronary ECs of 24-h TAC-operated ApoE−/− and DKO mice. Upper left, coronary vessel, Scale bar: 2 μm; lower left, MCECs at higher magnification of the red boxed region, Scale bar: 500 nm; (right panel) mitochondria and ER in MCECs at a higher magnification, Scale bar: 200 nm. The black arrows indicated the ER-mitochondrial distance. (G) Statistics of the average ER-mitochondrial distance in 24-h TAC hearts from ApoE−/− and DKO. n ≥ 63 per group. (H–I) Representative trace and amplitude statistics of cytosolic and mitochondrial Ca2+ transients in HUVECs transfected with NC or Nogo-B siRNA in response to 10 μM ATP or 10 μM histamine stimulation. n ≥ 7 per group for intracellular Ca2+ imaging and n≥10 per group for mitochondrial Ca2+ imaging. (J) Schematic diagram of proteins in MAMs involving in ER-mitochondria Ca2+ transport. (K) Western blot analysis for selected MAMs proteins in MCECs isolated from ApoE−/− and DKO hearts of mice with TAC. n = 6/group. (L) Protein levels of VCAM-1 and Nogo-B in HUVECs under 24-h TNFα stimuli in the presence or absence of 10 μM 2-APB (IP3Rs inhibitors). n = 7/group. (For interpretation of the references to colour in this figure legend, the reader is referred to the Web version of this article.)
Fig. 8
Fig. 8
Lack of endothelial Nogo-B elicited a benign plaque phenotype in ApoE−/−mice. (A) Western blot analysis of Nogo-B expression in whole heart tissues from ApoE−/− and Nogo-A/BECKO-ApoE−/− mice. n = 5 mice/group. (B) Immunofluorescence staining of Nogo-A/B (red), with VEC (green), α-SMA (green) and CD68(green), respectively, in heart sections of Nogo-A/BECKO-ApoE−/− mice. Scale bar: 50 μm. (C) Statistics of LAD plaque area in each section alongside aortic valve to apex in hearts of ApoE−/− and Nogo-A/BECKO-ApoE−/− mice after 7-week TAC. (n ≥ 6 hearts/group). (D) Distribution of LAD plaque phenotypes calculated from each section alongside aortic valve to apex in hearts of ApoE−/− and Nogo-A/BECKO-ApoE−/− mice subjected to TAC for 7 weeks. Oil Red O stained plaques in serial sections of the whole heart were classified. n ≥ 12 mice/group. (E) Representative Oil Red O staining of aortic roots and the quantification of plaque size of ApoE−/− and Nogo-A/BECKO-ApoE−/− mice after 7-week TAC. n ≥ 6 mice/group. (For interpretation of the references to colour in this figure legend, the reader is referred to the Web version of this article.)

References

    1. Malakar A.K., et al. A review on coronary artery disease, its risk factors, and therapeutics. J. Cell. Physiol. 2019;234(10):16812–16823. - PubMed
    1. Steg P.G., Ducrocq G. Future of the prevention and treatment of coronary artery disease. Circ. J. 2016;80(5):1067–1072. - PubMed
    1. Matsuzawa Y., Lerman A. Endothelial dysfunction and coronary artery disease: assessment, prognosis, and treatment. Coron. Artery Dis. 2014;25(8):713–724. - PMC - PubMed
    1. Medina-Leyte D.J., et al. Endothelial dysfunction, inflammation and coronary artery disease: potential biomarkers and promising therapeutical approaches. Int. J. Mol. Sci. 2021;22(8):3850. - PMC - PubMed
    1. Gimbrone M.A., Garcia-Cardena G. Endothelial cell dysfunction and the pathobiology of atherosclerosis. Circ. Res. 2016;118(4):620–636. - PMC - PubMed

MeSH terms