. 2023 Dec 11;41(12):2019-2037.e8.
doi: 10.1016/j.ccell.2023.10.004. Epub 2023 Oct 26.

Spatiotemporal genomic profiling of intestinal metaplasia reveals clonal dynamics of gastric cancer progression

Affiliations

Spatiotemporal genomic profiling of intestinal metaplasia reveals clonal dynamics of gastric cancer progression

Kie Kyon Huang et al. Cancer Cell. .

Abstract

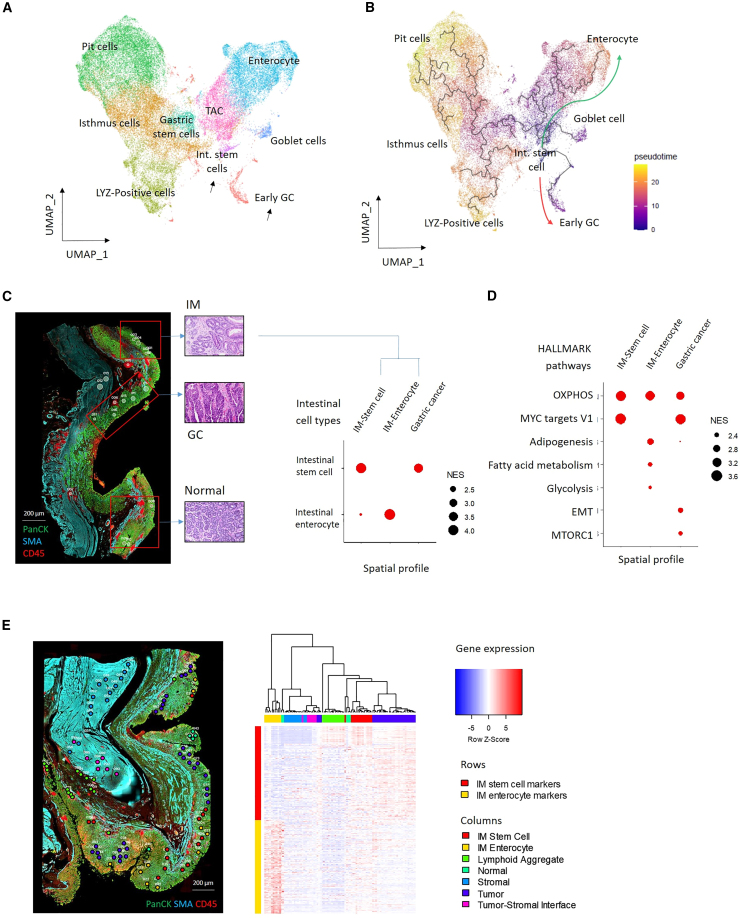
Intestinal metaplasia (IM) is a pre-malignant condition of the gastric mucosa associated with increased gastric cancer (GC) risk. Analyzing 1,256 gastric samples (1,152 IMs) across 692 subjects from a prospective 10-year study, we identify 26 IM driver genes in diverse pathways including chromatin regulation (ARID1A) and intestinal homeostasis (SOX9). Single-cell and spatial profiles highlight changes in tissue ecology and IM lineage heterogeneity, including an intestinal stem-cell dominant cellular compartment linked to early malignancy. Expanded transcriptome profiling reveals expression-based molecular subtypes of IM associated with incomplete histology, antral/intestinal cell types, ARID1A mutations, inflammation, and microbial communities normally associated with the healthy oral tract. We demonstrate that combined clinical-genomic models outperform clinical-only models in predicting IMs likely to transform to GC. By highlighting strategies for accurately identifying IM patients at high GC risk and a role for microbial dysbiosis in IM progression, our results raise opportunities for GC precision prevention and interception.

Keywords: cancer screening; cell-of-origin; gastric cancer; intestinal metaplasia; pre-cancer; single-cell sequencing; spatial transcriptomics; targeted DNA sequencing; transcriptome sequencing.


Conflict of interest statement

Declaration of interests P.T. has stock in Tempus Healthcare, previous funding from Kyowa Hakko Kirin and Thermo Fisher Scientific, and patents/other intellectual property through the Agency for Science and Technology Research, Singapore (all outside the submitted work). K.G.Y. is a co-inventor on patents “Serum MicroRNA Biomarker for the Diagnosis of Gastric Cancer” and “Methods Related to Real-Time Cancer Diagnostics at Endoscopy Utilizing Fiber-Optic Raman Spectroscopy”; a member of Scientific Advisory Board of MiRXES Pte Ltd. He has no stock or shares in the related companies. He has no conflicts of interest to disclose regarding this submitted work. R.S. has received honoraria from MSD, Eli Lilly, BMS, Roche, Taiho, Astra Zeneca, DKSH, and Ipsen; has advisory activity with Bristol Myers Squibb, Merck, Eisai, Bayer, Taiho, Novartis, MSD, GSK, DKSH, and Astellas; received research funding from Paxman Coolers, MSD, and Natera; and has received travel grants from Roche, Astra Zeneca, Taiho, Eisai, and DKSH.

Figures

None
Graphical abstract
Figure 1
Figure 1
Genomic profiles of gastric pre-malignancy (A) GCEP1000 translational study overview. 1,256 gastric biopsies from multiple stomach sites were analyzed from 692 GCEP subjects. (Right) Samples which were longitudinally matched from the same subjects, from either pre-dysplasia to dysplasia (adjacent) or dysplasia (adjacent) to post-dysplasia. (B) Predicted IM driver genes. (Right) Violin plots indicate median VAFs of somatic mutations. (C) Log ORs of driver gene mutation frequencies in TCGA (GC) vs. GCEP1000 (pre-malignancy). Left shifted genes are mutated more frequently in pre-malignancy, while right-shifted genes are mutated more frequently in GC. p values utilized Fisher’s exact tests. (D) Distributions and categories of protein altering mutations in SOX9, PIGR, BCOR, and BCORL1. Pie charts indicate percentages of different types of mutations. (E) Boxplot comparing SOX9 expression levels in SOX9-mutated and SOX9-wildtype GC (upper) and CRC (lower). FDR values utilized DESeq2. Box, median +/− interquartile range (IQR). Whiskers, 1.5× IQR. (F) Correlation between SOX9 expression and stemness scores in TCGA GCs (left) and GASCAD cohort (right). p values utilized Spearman’s correlation coefficient. (G) GSEA of SOX9-mutated vs. SOX9-wildtype GCs using HALLMARK (upper) and Busslinger et al. datasets (lower). Adjusted p values utilized fgsea. (H) Enrichment of MYC target V1 pathway genes and duodenal stem cell signatures in SOX9 mutated GCs. See also Figures S1–S3, Tables S1, S2, and S3.
Figure 2
Figure 2
Clonal dynamics in IM, dysplasia, and early GC (A) Bubble plots showing predicted genetic clones in normal, IM, and dysplasia. Clone sizes were inferred from VAFs. Bubble sizes were plotted proportionally. Each driver mutation is represented with a distinct color. Each square represents the size of biopsy (1–4 mm2). Beeswarm plots show total clone sizes in normal, IM, and dysplasia samples by stomach region or across all regions. p values utilized Wilcoxon tests. (B) Shared (gold) and private (black) somatic mutations in pre-malignant samples from different stomach sites in the same subject (n = 138). Human silhouettes indicate the number of samples with shared somatic mutations in at least two sites. Venn diagrams indicate the number of shared and private somatic mutations in antrum, body, and cardia. (C) Shared (gold) and private (black) somatic mutations in longitudinal samples from the same subject, either (left) from pre-dysplasia to dysplasia (n = 37) or dysplasia to post-dysplasia (n = 29). Venn diagrams indicate the number of shared and private somatic mutations in pre-, at-, and post-dysplasia samples. (D) WES of samples exhibiting concurrent normal, dysplasia, and early GC. (E) Oncoplot showing selected GC driver genes in 28 dysplasia-early GC pairs. Many mutations in dysplasia are also observed in concurrent GC. (F) Sharing of mutations in clonally related (n = 23) and unrelated (n = 5) dysplastic-GC pairs. Median numbers of shared and private mutations in dysplasia and GC lesions are indicated. (G) Median clone sizes in dysplastic and GC samples, with or without driver mutations in the dysplastic lesion. p values utilized paired Wilcoxon tests. (H) SciClone 2D plot showing clonal expansions associated with selected driver genes (APC and TP53) in dysplasia and concurrent GC.
Figure 3
Figure 3
IM scRNA-seq landscape (A) Cell types/lineages identified from single-cell RNA-seq of antral IMs. (B) Barplot showing increasing intestinal lineage cell types and decreasing gastric lineage cell types between IM histological grades. Feature plots depict selected intestinal and gastric lineage cells in severe/moderate IM compared with mild/negative IM. (C) Violin plots showing enrichment of cell cycle pathways in gastric stem cell lineages. (D) Violin plots of oxidative phosphorylation and Myc target V1 pathways highlights expression in intestinal stem cell lineages. Also shown are OLFM4 expression levels. (E) Violin plots showing enrichment of fatty acid metabolism and adipogenesis pathways in intestinal enterocyte lineages. Intestinal enterocytes are marked by expression of FABP1 and FABP2. See also Figure S4.
Figure 4
Figure 4
Trajectory analysis of IM and GC cells (A) UMAP projection using gastric and intestinal cell types in IM and early GC cells obtained from Kumar et al. GC cells and intestinal stem cells are marked by black arrows. (B) Monocle3 trajectory analysis. GC cells are most closely related to intestinal stem cells. (Red arrow) Differentiation path from intestinal stem cells to early GC. (Green arrow) Differentiation path from intestinal stem cells to enterocytes. (C) Representative ROIs from a tissue section displaying concurrent normal, IM, and GC (left). AOIs/ROIs from IMs were annotated as stem cells dominant IM (IM-stem cell) or enterocyte dominant (IM-Enterocyte) based on scRNA-seq profiles (right). NES values utilized fgsea. Scale bar, 200 μm. (D) Dotplots showing enrichment of selected HALLMARK pathways in intestinal stem cell dominant IM, enterocyte-dominant IM, and GC. GCs also exhibit EMT and MTORC1 signatures. NES values utilized fgsea. (E) Image of histological slide with selected ROIs (left). IM regions were annotated as intestinal stem cell-dominant or enterocyte-dominant IM. Hierarchical clustering using IM stem cell and enterocyte markers of selected ROIs demonstrates similarities between GC and intestinal stem-cell dominant IM (right). Scale bar, 200 μm. See also Figure S5.
Figure 5
Figure 5
Expression-based molecular subtypes of IM and pseudoantralization (A) Hierarchical clustering of bulk IM RNA-seq transcriptomes (n = 137 IM). A cluster of body/cardia IMs (cluster 2, light blue) cluster with antral IMs (green). (B) PCA graphs of normal gastric samples and IMs. Normal antral and body/cardia samples were well demarcated, while IM samples are distributed across both regions. Pseudoantralized IMs cluster with antral IMs. (C) Fraction of histologically defined incomplete and complete IM subtypes across IM expression subtypes (left). p values utilized Fisher’s test. Representative images of Type I complete and Type III incomplete IM (right; adapted from Huang et al.11). Scale bar, 100 μm. (D) Single sample GSEA (ssGSEA) scores for gastric cell types and intestinal cell types in antral and body/cardia normal samples and IMs. Pseudoantralized IMs exhibit similarities to antral IMs. p values were estimated using Wilcoxon tests. Box, median +/− IQR. Whiskers, 1.5× IQR. (E) Mutation counts and clone sizes of IM expression subtypes. Pseudoantralized IMs exhibit higher mutation counts and clone sizes relative to Cluster 1 body/cardia IMs. p values utilized Wilcoxon tests. (F) ARID1A mutations are enriched in pseudoantralized IMs. p values utilized Fisher’s tests. (G) Proportion of cell types from scRNA-seq of gastric body biopsies (n = 6). See also Figure S6.
Figure 6
Figure 6
Immune landscape in IM (A) GSEA of expression signatures in IM subtypes. Inflammatory signatures (Interferon gamma, etc) are upregulated in subtype 2 (Pseudoantralized IM). (B) Immune, stromal, and stemness content deconvolution analysis using ESTIMATE, CIBERSORTx, and TCGA stemnessScore. Pseudoantralized IMs exhibit upregulation of immune scores and B cell programs while antral IMs show higher stem cell features. p values utilized Wilcoxon tests. Box, median +/− IQR. Whiskers, 1.5× IQR. (C) Bacterial density and diversity in IM and normal samples. Pseudoantralized IMs exhibit increased bacterial loads but lower diversity. p values utilized Wilcoxon tests. (D) LDA analysis comparing microbial genera between body/cardia IM subtypes. LDA effect sizes utilized lefser. (E) Spearman analysis of the 30 most abundant bacterial genera, representing the major contributors to microbial levels in this study. Two distinct microbial communities are observed (C1 and C2). (F) Prevalence of C1 and C2 communities in reference microbiomes from oral cavity (left) and normal stomach (middle). Correlation between community C1 with HALLMARK inflammation scores (right). p values utilized Wilcoxon tests. Box, median +/− IQR. Whiskers, 1.5× IQR. (G) Association between bacterial genus abundance with IM driver mutations. Bacterial genera positively associated with somatic mutations are indicated with asterisks (p < 0.01). See also Figure S7.
Figure 7
Figure 7
Predicting IM progression risk from clinical and genomic features (A) Clinical factors (age≥70, operating link for gastric intestinal metaplasia (OLGIM) score, pepsinogen index, smoking status) and genomic features (mutation count, clone size, sCNA (amplification/deletion) used to stratify gastric dysplasia risk in antral biopsies. p values utilized logistic regression. (Right) Receiver operating characteristic (ROC) curve showing accuracy of prediction based on clinical factors only (gray) or clinical and genomic factors (blue). (B) Analysis of patients with both antral and body biopsies (Dysplasia n = 20 vs. Non-dysplasia n = 186). Left panel shows forest plots of univariate and multivariate logistic regression analysis. The right panel shows ROC curves and corresponding AUC values to evaluate model performance. See also Figure S8 and Table S4.
Figure 8
Figure 8
Precision prevention strategies for GC Surveillance of patients with pre-malignant conditions, such as intestinal metaplasia, using molecular tests assessing mutation load and genetic clones may be useful in stratifying “very-high-risk” individuals for endoscopic follow-up. Figure was created using Biorender software and based on Yeoh and Tan (2022).

Comment in

References

    1. Sung H., Ferlay J., Siegel R.L., Laversanne M., Soerjomataram I., Jemal A., Bray F. Global Cancer Statistics 2020: GLOBOCAN Estimates of Incidence and Mortality Worldwide for 36 Cancers in 185 Countries. CA A Cancer J. Clin. 2021;71:209–249. - PubMed
    1. Thrift A.P., El-Serag H.B. Burden of Gastric Cancer. Clin. Gastroenterol. Hepatol. 2020;18:534–542. - PMC - PubMed
    1. Leung W.K., Wu M.S., Kakugawa Y., Kim J.J., Yeoh K.G., Goh K.L., Wu K.C., Wu D.C., Sollano J., Kachintorn U., et al. Screening for gastric cancer in Asia: current evidence and practice. Lancet Oncol. 2008;9:279–287. - PubMed
    1. Dan Y.Y., So J.B.Y., Yeoh K.G. Endoscopic screening for gastric cancer. Clin. Gastroenterol. Hepatol. 2006;4:709–716. - PubMed
    1. Hsu M., Safadi A.O., Lui F. StatPearls; 2022. Physiology, Stomach. - PubMed

Publication types