. 2024 Jan;28(1):e18007.
doi: 10.1111/jcmm.18007. Epub 2023 Oct 27.

Microglial FoxO3a deficiency ameliorates ferroptosis-induced brain injury of intracerebral haemorrhage via regulating autophagy and heme oxygenase-1

Affiliations

Microglial FoxO3a deficiency ameliorates ferroptosis-induced brain injury of intracerebral haemorrhage via regulating autophagy and heme oxygenase-1

Rikang Wang et al. J Cell Mol Med. 2024 Jan.

Abstract

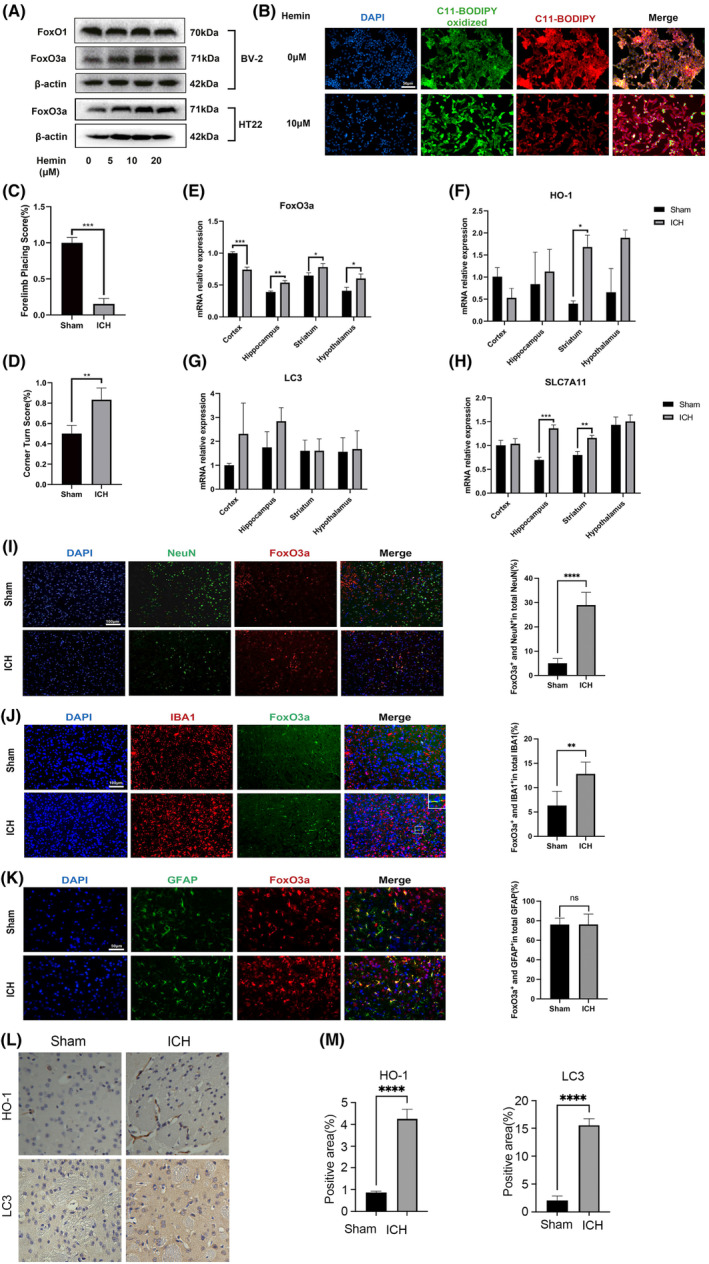
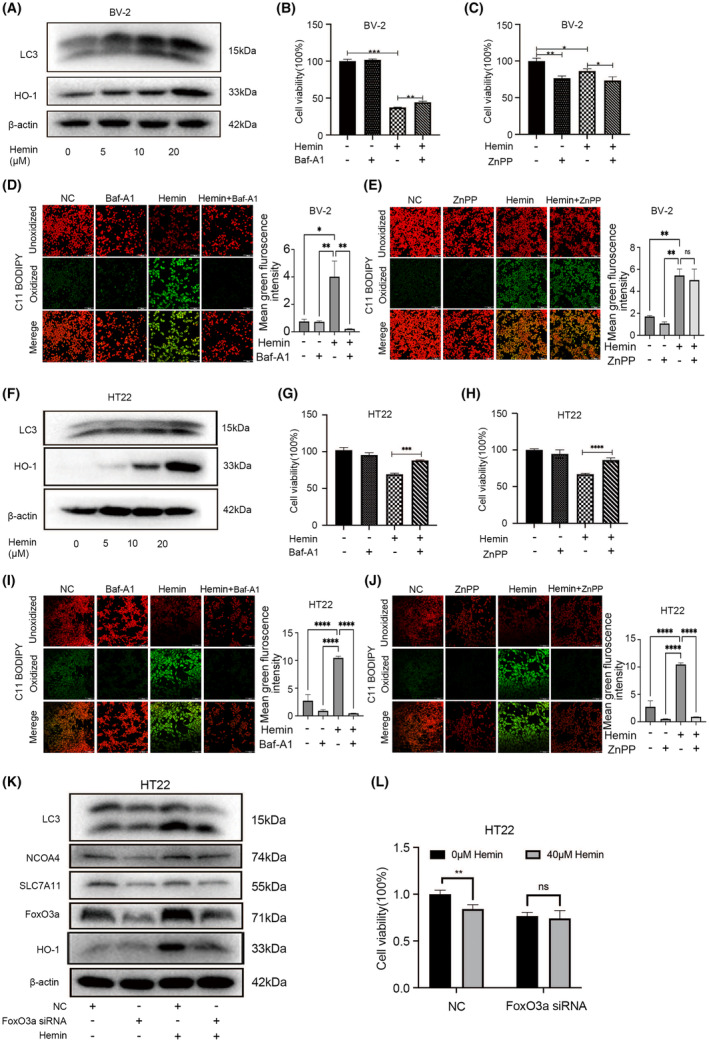
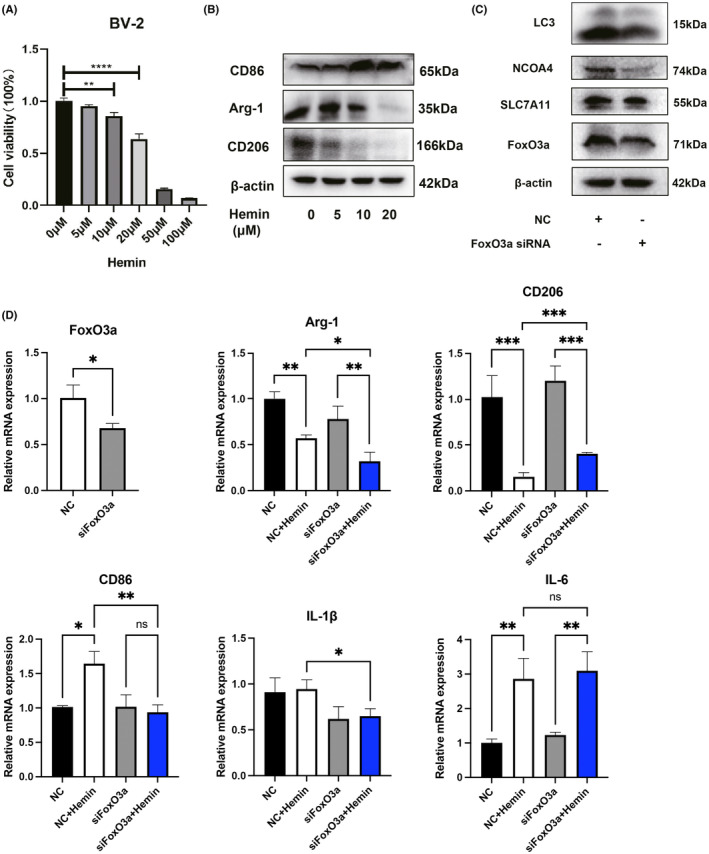
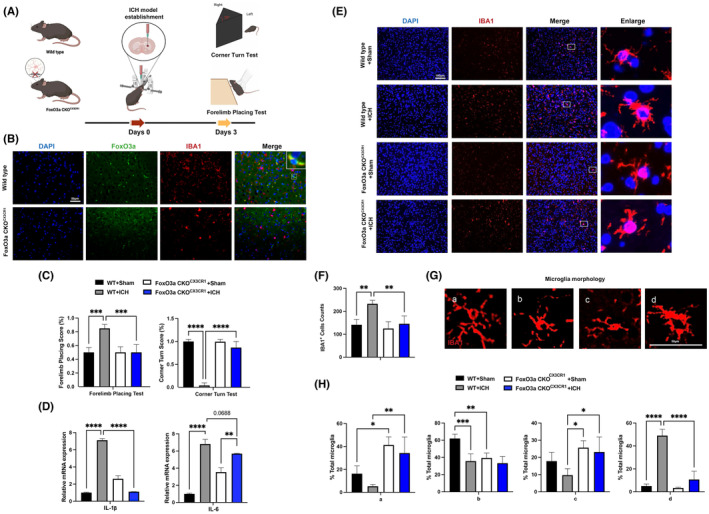
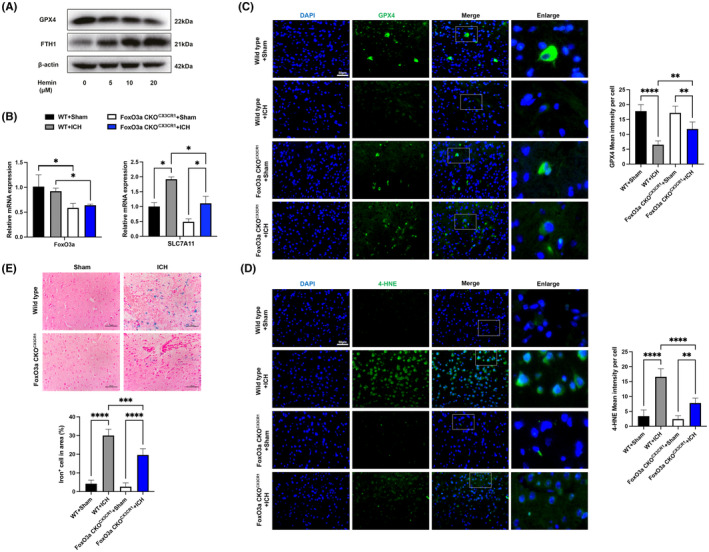
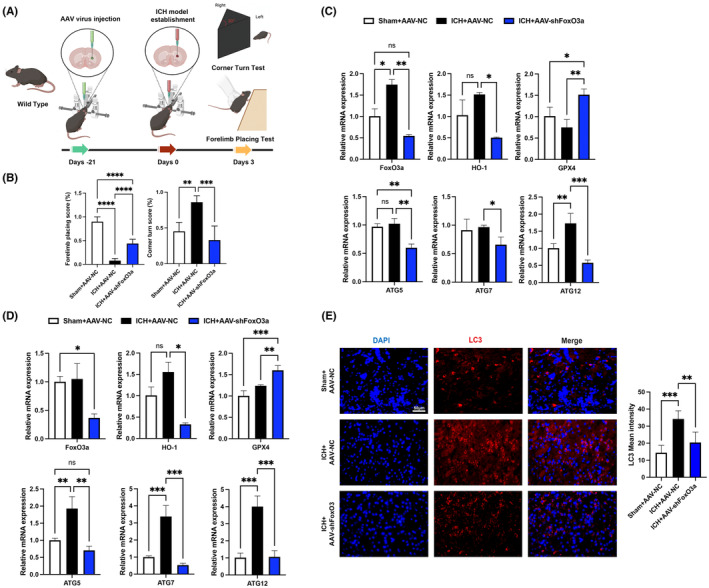
Microglial HO-1 regulates iron metabolism in the brain. Intracerebral haemorrhage (ICH) shares features of ferroptosis and necroptosis; hemin is an oxidized product of haemoglobin from lysed red blood cells, leading to secondary injury. However, little is known about the underlying molecular mechanisms attributable to secondary injury by hemin or ICH. In this study, we first show that FoxO3a was highly co-located with neurons and microglia but not astrocytes area of ICH model mice. Hemin activated FoxO3a/ATG-mediated autophagy and HO-1 signalling resulting in ferroptosis in vitro and in a mice model of brain haemorrhage. Accordingly, autophagy inhibitor Baf-A1 or HO-1 inhibitor ZnPP protected against hemin-induced ferroptosis. Hemin promoted ferroptosis of neuronal cells via FoxO3a/ATG-mediated autophagy and HO-1 signalling pathway. Knock-down of FoxO3a inhibited autophagy and prevented hemin-induced ferroptosis dependent of HO-1 signalling. We first showed that hemin stimulated microglial FoxO3a/HO-1 expression and enhanced the microglial polarisation towards the M1 phenotype, while knockdown of microglial FoxO3a inhibited pro-inflammatory cytokine production in microglia. Furthermore, the microglia activation in the striatum showed significant along with a high expression level of FoxO3a in the ICH mice. We found that conditional knockout of FoxO3a in microglia in mice alleviated neurological deficits and microglia activation as well as ferroptosis-induced striatum injury in the autologous blood-induced ICH model. We demonstrate, for the first time, that FoxO3a/ATG-mediated autophagy and HO-1 play an important role in microglial activation and ferroptosis-induced striatum injury of ICH, identifying a new therapeutic avenue for the treatment of ICH.

Keywords: FoxO3a; HO-1; ferroptosis; intracerebral haemorrhage; microglia.


Conflict of interest statement

The authors declare no conflicts of interest.

Figures

FIGURE 1
FIGURE 1
The expression of FoxO3a is increased after treatment with hemin in vitro and in an ICH mice model. (A) HT22 cells and BV‐2 cells were treated with different concentrations of hemin, and the expressions of FoxO1/FoxO3a were determined by western blot (B) The lipid peroxidation was detected by C11 BODIPY 581/591 probe in HT22 cells after stimulated with 20 μM hemin for 24 h. (C) The forelimb placing test and (D) corner turn test of the mice in ICH model by injection of autologous whole blood (n = 5). (D) Representative immunofluorescence images of FoxO3a expression in the striatal region caused by ICH. (E–H) The mRNA levels of FoxO3a/HO‐1/LC3‐II/SLC7A11 in the cortex, hippocampus, striatum and hypothalamus of the mice in ICH model. (I–K) Representative images of FoxO3a expression in the striatal area visualised under microscopy. Quantification of co‐localization of NeuN, GFAP or Iba1 with FoxO3a in the striatum of mice under normal conditions or after ICH (n = 5). (L) Representative images of IHC staining for HO‐1/LC3 in the striatum of mice under normal conditions or after ICH (n = 3). (M) Graphical results showing the IHC scores for HO‐1/LC3 positive area. Data were expressed as mean ± SD. *p < 0.05, **p < 0.01, ***p < 0.001, ****p < 0.0001.
FIGURE 2
FIGURE 2
FoxO3a promoted neuronal and microglial ferroptosis induced by hemin through HO‐1 and autophagy pathway. (A) BV‐2 cells were stimulated with different concentrations of hemin. The expressions of LC3‐II/HO‐1 were determined by western blot. (B) Cell viability assay of 10 μM hemin stimulated BV‐2 cells were treated with 5 nM autophagy inhibitor Baf‐A1 and (C) 10 μM HO‐1 inhibitor ZnPP, and cell viability was determined by the CCK‐8 assay. (D‐E) BV‐2 cells were treated as indicated for 24 h, and the accumulation of lipid ROS was assessed by C11‐BODIPY581/591 staining. (F) HT22 cells were stimulated with different concentrations of hemin. The expressions of LC3‐II /HO‐1 were determined by western blot. (G) HT22 cells were treated with or without 20 μM hemin and/or Baf‐A1 (1.25 μM)/(H) HO‐1 inhibitor ZnPP (0.05 μM) for another 24 h. Cell viability was determined by CCK‐8 assay. (I–J) HT22 cells were treated as indicated for 24 h, and the accumulation of lipid ROS was assessed by C11‐BODIPY581/591 staining. (K) HT22 cells were transfected with FoxO3a siRNA for 24 h, then the cells were treated with or without 20 μM hemin for another 24 h. The protein levels of LC3‐II /NCOA4/SLC7A11/FoxO3a/HO‐1 were measured by western blot. (L) After knockdown of FoxO3a in HT22 cells, the cells were stimulated with or without 40 μM hemin, cell viability was determined by CCK‐8 assay. Data were expressed as mean ± SD. *p < 0.05, **p < 0.01, ***p < 0.001.
FIGURE 3
FIGURE 3
FoxO3a modulated the microglial activation phenotype induced by hemin. (A) BV‐2 cells were treated with different concentrations of hemin. Cell viability was determined by the CCK‐8 assay kit. (B) BV‐2 cells were stimulated with different concentrations of hemin, and the M1/M2 makers of microglial phenotypes were measured by western blot. (C) BV‐2 cells were transfected with FoxO3a siRNA for 36 h, and the expressions of LC3‐II /NCOA4/SLC7A11/FoxO3a were determined by western blot. (D) BV‐2 cells were transfected with FoxO3a siRNA for 24 h, then the cells were treated with hemin for another 24 h. The indicated mRNA levels were determined by qRT‐PCR. Data were expressed as mean ± SD. *p < 0.05, **p < 0.01, ***p < 0.001.
FIGURE 4
FIGURE 4
Conditional knockout of FoxO3a in microglia attenuated the neurological deficits and brain injury induced by ICH. (A) Schematic diagram of the experimental design. (B) Representative images showed FoxO3a knockout efficiency in microglia from wild‐type and FoxO3a CKOCX3CR1 mice. (C) The forelimb placing test and corner turn test of the FoxO3afl/fl and FoxO3a cKOCX3CR1 mice in ICH model by injection of autologous whole blood (n = 5). (E) Representative images of IBA1 expression in the striatal area (n = 5). (D) The mRNA levels of IL‐1β and IL‐6 were determined by RT‐PCR in the striatum of the FoxO3afl/fl and FoxO3a cKOCX3CR1 mice caused by ICH (n = 3). (E) Representative pictures of microglia activation phenotype in the striatal region (n = 5). (F) The area of the Iba1+ cells in the striatal region. (G) Morphological microglial analysis was represented with the scale for (H), ranking from a (more ramified phenotype) to d (more amoeboid phenotype) was performed (n = 5). Data were expressed as mean ± SD. *p < 0.05, **p < 0.01, ***p < 0.001.
FIGURE 5
FIGURE 5
Conditional knockout of FoxO3a in microglia reduces ferroptosis and lipid peroxidation caused by ICH. (A) BV‐2 cells were treated with different concentrations of hemin for 24 h, and then the protein expressions of GPX4 and FHT1 were determined with western blot. (B) The mRNA levels of FoxO3a/SLC7A11 in the striatum of ICH model were determined by qRT‐PCR (n = 3). (C) Representative immunofluorescence images of GPX4 expression (n = 5). (D) Representative immunofluorescence images of 4‐HNE (n = 5) and (E) Representative images of Perl's iron stain in the striatal area of the FoxO3afl/fl and FoxO3a cKOCX3CR1 mice caused by ICH (n = 5). Data were expressed as mean ± SD. *p < 0.05, **p < 0.01, ***p < 0.001.
FIGURE 6
FIGURE 6
Knockdown of FoxO3a by AAV‐shFoxO3a reduces autophagy and ferroptosis caused by ICH. (A) Schematic diagram of the experimental design. (B) The forelimb placing test and corner turn test of the mice after injection of AAV‐shFoxO3a for 3 weeks in ICH model (n = 5). The mRNA levels of FoxO3a, HO‐1, GPX4 and ATG‐related mRNA in the striatum (C) and cortex (D) of mice (n = 3). (E) Representative immunofluorescence images of LC3 expression in the striatal area of the mice in ICH model (n = 5). Data were expressed as mean ± SD. *p < 0.05, **p < 0.01, ***p < 0.001.

References

    1. Gonzalez‐Perez A, Gaist D, Wallander MA, McFeat G, Garcia‐Rodriguez LA. Mortality after hemorrhagic stroke: data from general practice (the health improvement network). Neurology. 2013;81(6):559‐565. doi: 10.1212/WNL.0b013e31829e6eff - DOI - PubMed
    1. Fernando SM, Qureshi D, Talarico R, et al. Intracerebral hemorrhage incidence, mortality, and association with oral anticoagulation use: a population study. Stroke. 2021;52(5):1673‐1681. doi: 10.1161/STROKEAHA.120.032550 - DOI - PubMed
    1. Moulin S, Cordonnier C. Prognosis and outcome of intracerebral haemorrhage. Front Neurol Neurosci. 2015;37:182‐192. doi: 10.1159/000437122 - DOI - PubMed
    1. Qiu Z, Zhang H, Xia M, et al. Programmed death of microglia in Alzheimer's disease: autophagy, ferroptosis, and pyroptosis. J Prev Alzheimers Dis. 2023;10(1):95‐103. doi: 10.14283/jpad.2023.3 - DOI - PubMed
    1. Yang Z, Liu B, Zhong L, et al. Toll‐like receptor‐4‐mediated autophagy contributes to microglial activation and inflammatory injury in mouse models of intracerebral haemorrhage. Neuropathol Appl Neurobiol. 2015;41(4):e95‐e106. - PubMed

Publication types