. 2023 Oct 27;14(1):6774.
doi: 10.1038/s41467-023-42342-y.

N-terminal acetylation shields proteins from degradation and promotes age-dependent motility and longevity

Affiliations

N-terminal acetylation shields proteins from degradation and promotes age-dependent motility and longevity

Sylvia Varland et al. Nat Commun. .

Abstract

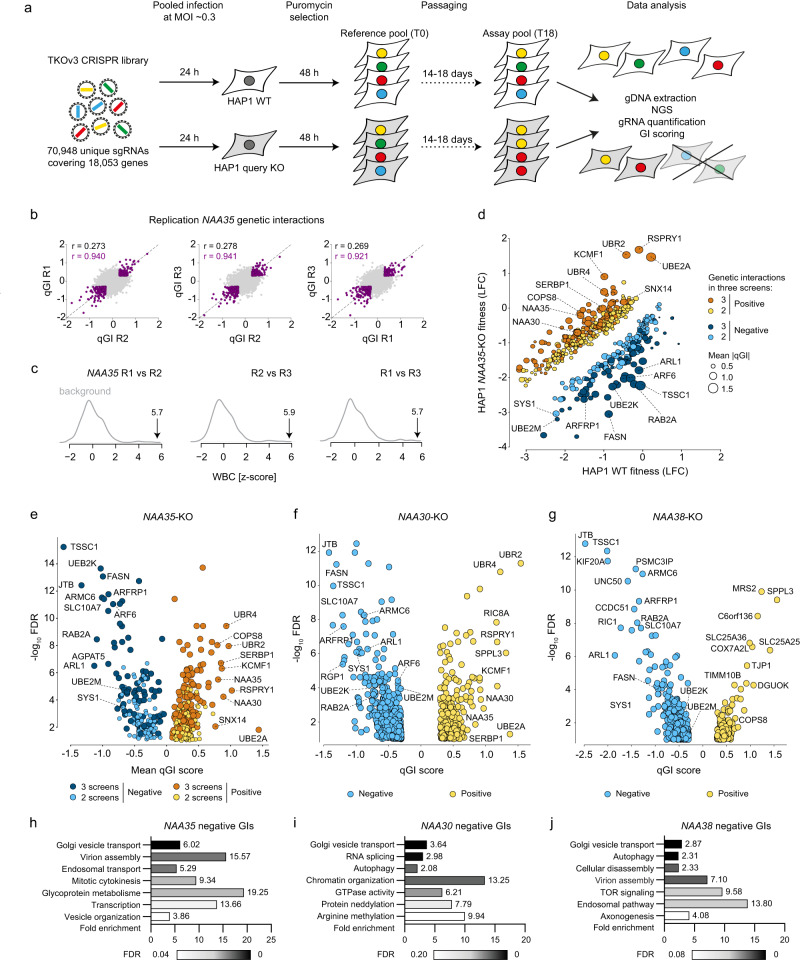
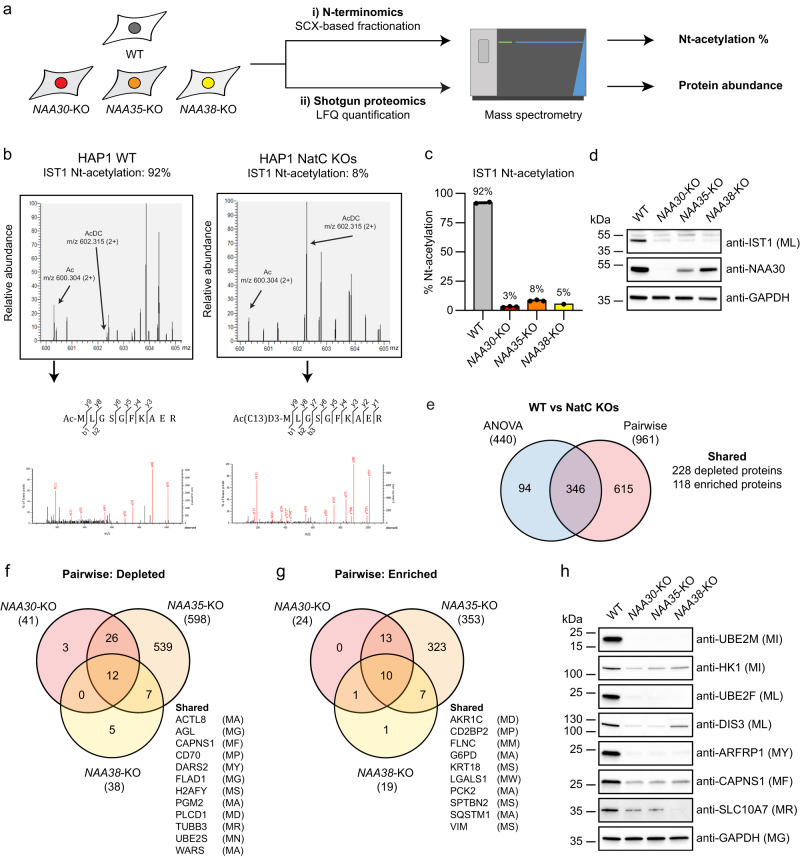
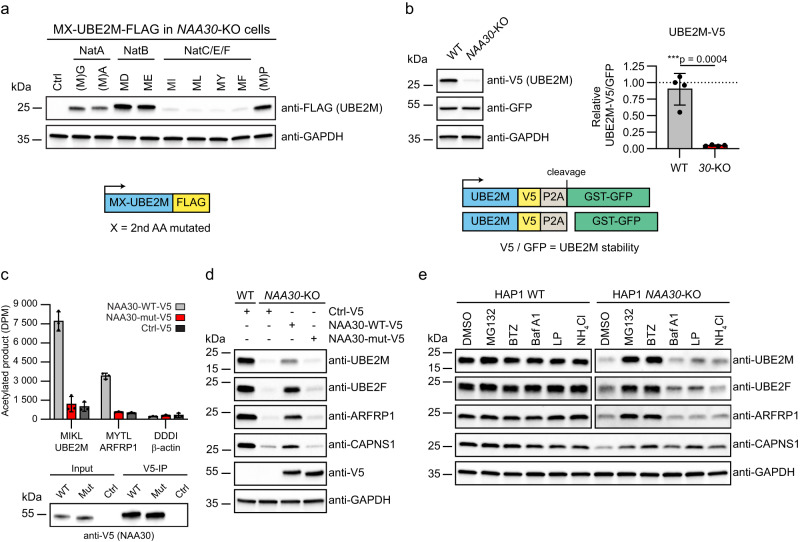
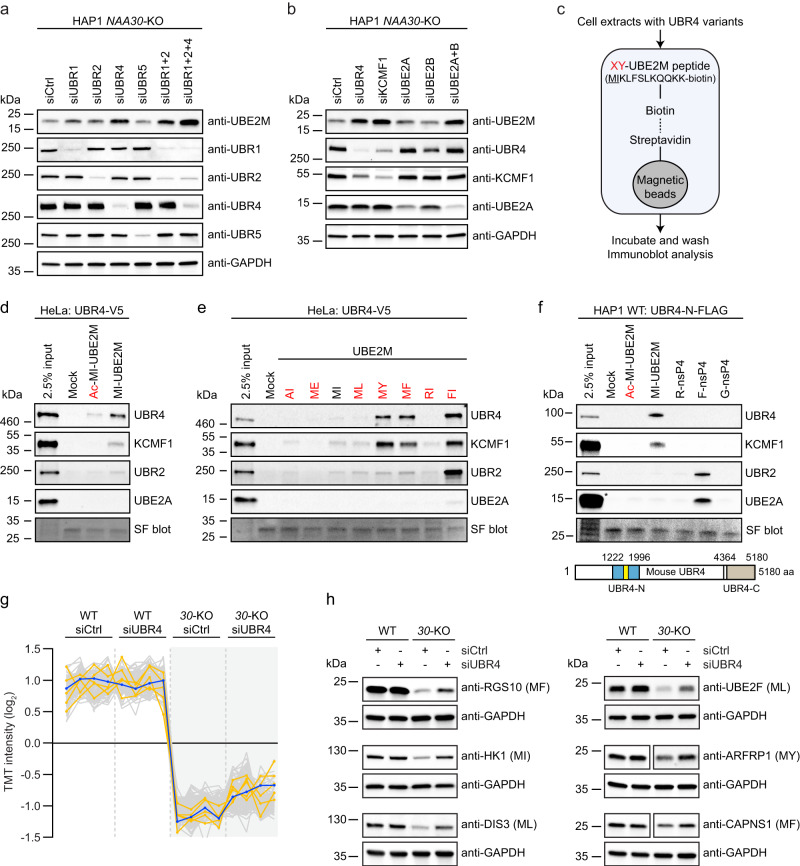
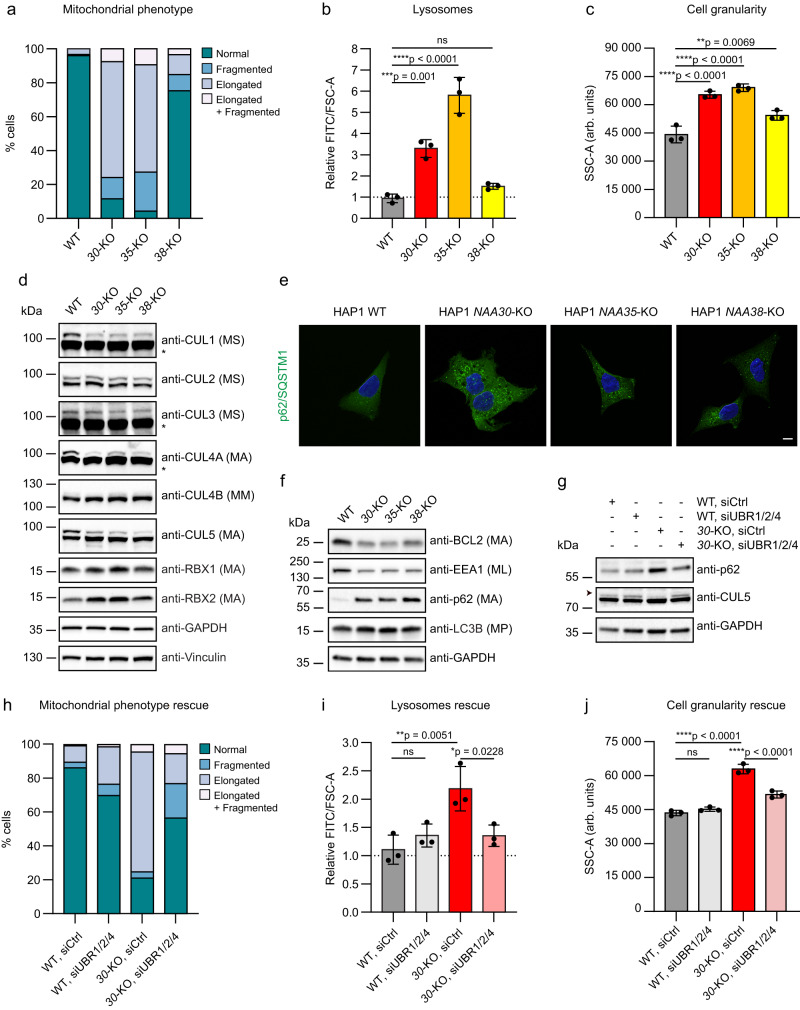
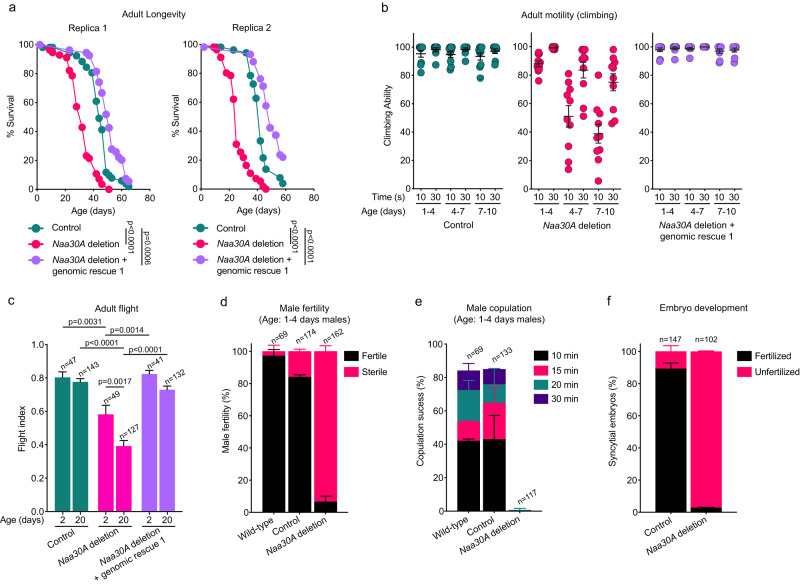
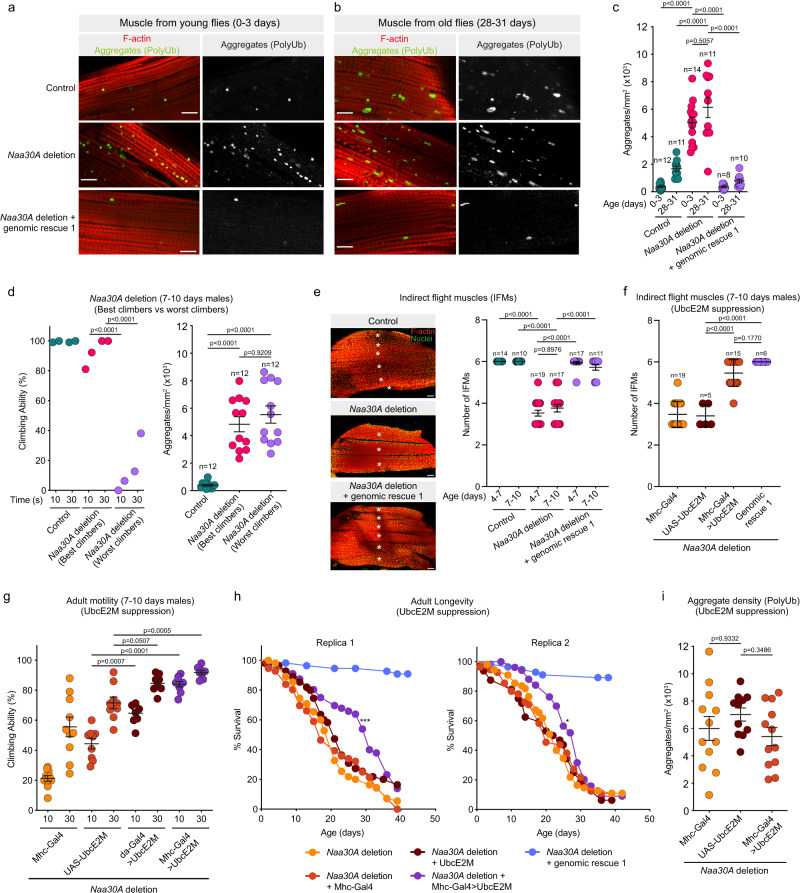
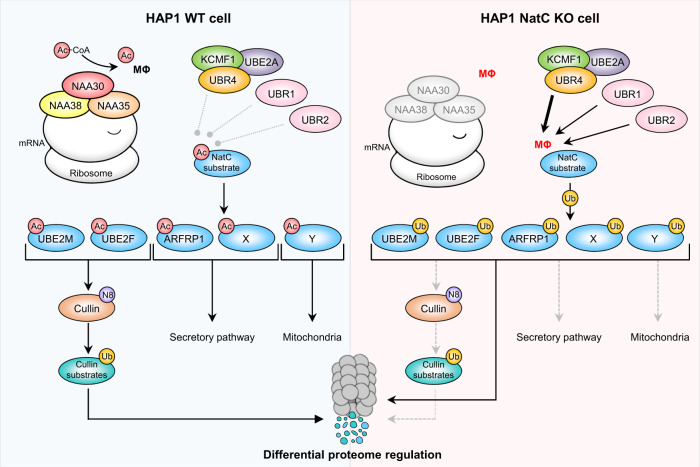
Most eukaryotic proteins are N-terminally acetylated, but the functional impact on a global scale has remained obscure. Using genome-wide CRISPR knockout screens in human cells, we reveal a strong genetic dependency between a major N-terminal acetyltransferase and specific ubiquitin ligases. Biochemical analyses uncover that both the ubiquitin ligase complex UBR4-KCMF1 and the acetyltransferase NatC recognize proteins bearing an unacetylated N-terminal methionine followed by a hydrophobic residue. NatC KO-induced protein degradation and phenotypes are reversed by UBR knockdown, demonstrating the central cellular role of this interplay. We reveal that loss of Drosophila NatC is associated with male sterility, reduced longevity, and age-dependent loss of motility due to developmental muscle defects. Remarkably, muscle-specific overexpression of UbcE2M, one of the proteins targeted for NatC KO-mediated degradation, suppresses defects of NatC deletion. In conclusion, NatC-mediated N-terminal acetylation acts as a protective mechanism against protein degradation, which is relevant for increased longevity and motility.


Conflict of interest statement

J.M. is a shareholder and advisor of Century Therapeutics and Aelian Biotechnology. The other authors declare no competing interests.

Figures

Fig. 1
Fig. 1. Genome-wide mapping of genetic interactions with human NatC.
a Schematic of genome-wide CRISPR screens to identify genetic interactions (GI) with NatC. HAP1 WT, NAA30-KO, NAA35-KO, and NAA38-KO cells were transduced with a pooled genome-wide CRISPR knockout library (TKOv3) and selected for viral integration. gRNA regions were PCR-amplified from genomic DNA extracted from cells collected at the start (T0) and endpoint of the screen (T14-18). gRNA abundance was determined by next-generation sequencing (NGS). b, c Reproducibility of NAA35 qGI scores. b qGI scores were determined by comparing the log2-fold change (LFC) for every gene represented in the TKOv3 library in NAA35-KO cell line with those observed in a panel of WT control screens. Pearson correlation coefficient (r) was calculated using all qGI scores (r in black, calculated from all data points) or using a stringent cut-off for the GIs (|qGI|>0.3, FDR < 0.10) in both screens (r and datapoints marked in purple). c The Pearson correlation coefficients of the qGI scores (two replicated screens) was adjusted to the similarity of a NAA35-KO screen to a panel of HAP1-KO screens. The resulting Within vs Between replicate Correlation (WBC) score provides a confidence of reproducibility interpreted as a z-score. d Negative and positive GIs of NAA35. Scatterplot showing the fitness effect (LFC) of 486 genes in NAA35-KO versus WT cells, showing a significant GI in at least two NAA35 screens (|qGI|>0.3, FDR < 0.10). Negative (blue) and positive (yellow) NAA35 GIs are shown. Darker color indicates interactions that were called in all three replicate screens. Node size corresponds to strength of the mean absolute GI score (three independent screens). Volcano plots displaying qGI scores and associated significance (log10 values) for genes targeted by the TKOv3 library in (e) NAA35-KO, (f) NAA30-KO and (g) NAA38-KO screens. Negative (blue) and positive (yellow) GIs are shown. hj Negative GIs of NatC indicate a role in Golgi transport. Pathway enrichment analysis of genes exhibiting a negative GI with (h) NAA35, (i) NAA30 or (j) NAA38 (identified in at least two NAA35 screens; |qGI|>0.3, FDR < 0.1). Benjamini–Hochberg adjusted p-values for each gene ontology term is indicated by gray gradient.
Fig. 2
Fig. 2. N-terminal acetylation by NatC protects proteins from degradation.
a HAP1 WT and NatC KO cells were subjected to i) N-terminal proteomics using strong-cation exchange (SCX) enrichment of in vivo Nt-acetylated proteins to determine the degree of Nt-acetylation, and ii) label-free quantification (LFQ) shotgun proteomics to determine changes in protein abundance (four samples per cell line). b MS-spectra of the N-terminal peptide of IST1 (P53990) from HAP1 WT and NatC KO cells following trypsin digestion and SCX-based enrichment. c Bar graph showing the degree of Nt-acetylation of IST1 in HAP1 WT and NatC KO cells as determined by proteomics. Data are shown as mean ± SD (n = 4, the IST1 peptide was not identified in all replicates). d Endogenous IST1 protein levels from indicated HAP1 cells determined by immunoblotting. e Venn diagram of significantly regulated proteins in HAP1 NatC KO cell lines determined by LFQ proteomics using multiple sample test (one-way ANOVA; FDR = 0.01, S0 = 0) and pairwise comparison analyses (t-test; FDR = 0.01, S0 = 0.1). f, g Venn diagrams of depleted (e) and enriched (f) proteins determined by pairwise comparison between HAP1 WT and the individual NatC KO cell lines (t-test; FDR = 0.01; S0 = 0.1). h Immunoblot analysis of selected confirmed and putative NatC substrates using whole cell extract from HAP1 WT and NatC KO cells. Immunoblots were performed at least three independent times. Source data are provided as a Source Data file.
Fig. 3
Fig. 3. Unacetylated hydrophobic NatC substrates are less stable.
a N-terminal variants of UBE2M-FLAG were transiently expressed in HAP1 NAA30-KO cells and protein levels were determined by immunoblotting (n = 3 independent experiments). The native N-terminus of UBE2M starts with MI. b HAP1 WT and NAA30-KO cells were transfected with the indicated UBE2M-V5-P2A-GST-GFP reporter construct, and protein levels were determined by immunoblot analysis. UBE2M-V5 levels were normalized to GST-GFP and expressed relative to WT sample. Data are shown as mean ± SD of four independent experiments. ***p = 0.0004; two-tailed unpaired t test. c NAA30-WT-V5 and NAA30-mut-V5 (E321A) was immunoprecipitated from HeLa cell extracts and used in Nt-acetylation assays with [14C]-acetyl-CoA and synthetic peptides representing the NatC substrates UBE2M (MIKL) and ARFRP1 (MYTL), and the NAA80/NatH substrate β-actin (DDDI). The experiment was performed three independent times with three technical replicates each. Data from one representative setup is shown as mean ± SD. DPM: disintegrations per minute. d NatC regulates the protein level of UBE2M, UBE2F, ARFRP1, and CAPNS1. Immunoblot analysis of HAP1 WT and NAA30-KO cells transfected with control V5 plasmid, NAA30-V5 or the catalytically dead mutant NAA30-mut-V5 (n = 3 biologically independent samples). e HAP1 WT and NAA30-KO cells were treated with proteasomal [MG132 and bortezomib (BMZ)] and lysosomal inhibitors [bafilomycin A (BafA), leupeptin (LP) or ammonium chloride (NH4Cl)] for 6 h followed by immunoblot analysis using the indicated antibodies (n = 3 independent experiments). DMSO served as vehicle control. Source data are provided as a Source Data file.
Fig. 4
Fig. 4. UBR4-KCMF1 targets unacetylated N-terminal methionine followed by a hydrophobic residue.
a, b The protein level of endogenous UBE2M in HAP1 WT and NAA30-KO cells transfected with the indicated siRNAs for 72 h was assessed by immunoblotting (n = 4 biologically independent samples). c Schematic representation of protein capture by peptide pulldown. A set of 11-mer peptides derived from the N-terminal sequence of UBE2M were C-terminally labeled with K-biotin (MIKLFSLKQQK(K-biotin)) and conjugated to streptavidin magnetic beads. The first two residues were replaced to represent different N-termini (XY-UBE2M). Biotinylated UBE2M peptides were incubated with cell extracts and the pulled-down proteins were identified by immunoblot analysis. d In vitro peptide pulldown assay of UBR4-V5 transiently expressed in HeLa cells using acetylated and non-Nt-acetylated UBE2M peptide. e XY-UBE2M peptide pulldown assay with UBE2M peptides bearing different N-terminal amino acids and UBR4-V5 expressed in HeLa cells. f In vitro peptide pulldown assay of UBR4-N-FLAG expressed in HAP1 WT cells using acetylated and non-Nt-acetylated UBE2M peptide and X-nsP4 controls peptides. The UBR4-N construct contains the UBR-box (yellow), which is the substrate recognition domain of the UBR proteins. *indicates saturated UBE2A band. g HAP1 WT and NAA30-KO cells were transfected with siCtrl or siUBR4 for 72 h and protein abundance was determined by tandem mass tag (TMT)-based quantitative proteomics (see Supplementary Data 5; n = 4 biologically independent samples). Intensity profile plot showing protein levels of the top 100 proteins with abundance profiles most similar to UBE2M (blue trace) (one-way ANOVA, permutation-based FDR = 0.01, S0 = 0). The intensity profiles of RGS10, ARLB, CAPSN1, DIS3, and HK2 are highlighted in orange. h UBR4 knockdown stabilizes the protein levels of non-Nt-acetylated RGS10, HK1, DIS3, UBE2F, ARFRP1 and CAPNS1 in NAA30-KO cells. HAP1 WT and NAA30-KO cells were transfected with siCtrl or siUBR4 for 72 h followed by immunoblotting using the indicated antibodies (df and h; n = 3 independent experiments). Source data are provided as a Source Data file.
Fig. 5
Fig. 5. UBR-dependent NatC knockout phenotypes include abnormal mitochondrial morphology, increased lysosomal content and cell granularity.
a NatC KO cells have abnormal mitochondrial morphology. HAP1 cells were stained with anti-COX IV and analyzed by immunofluorescence (IF). Cells were grouped into four bins based on mitochondrial morphology: normal, fragmented, elongated, and elongated + fragmented (n = 100 per cell line). b NAA30-KO and NAA35-KO cells have increased lysosomal content. Lysosomes were stained with LysoView 488 and analyzed by flow cytometry. Median FITC values were normalized to cell size (FSC-A) and expressed relative to WT sample. Data are shown as mean ± SD (n = 3 independent experiments). ***p = 0.001, ****p < 0.0001; one-way ANOVA with Dunnett’s correction. c NatC KO cells display increased granularity. Median side scatter area (SSC-A) indicating cell granularity or internal complexity was determined by flow cytometry. Data are shown as mean ± SD (n = 3 independent experiments). **p = 0.0069, ****p < 0.0001; one-way ANOVA with Dunnett’s correction. d NatC regulates protein neddylation. Immunoblot analysis of neddylation pathway components using total cell extract (n = 3 biologically independent samples). All proteins have NatA-type N-termini, except CUL4B which has a NatC/E-type N-terminus (MM-). The upper cullin band represents the neddylated form and * indicates saturated bands. e Increased p62/SQSTM1 levels in NatC KO cells. HAP1 cells were stained with anti-p62 and analyzed by IF. Scale bar, 10 μm. (see Supplementary Fig. 10 for quantification): f NatC affects components of the autophagy pathway. Immunoblot analysis of autophagy markers using the indicated HAP1 cell extracts. EEA1 (ML-) has a NatC-type N-terminus while BCL2, p62 and LC3B has NatA-type N-termini (n = 3 biologically independent samples). gj HAP1 WT and NAA30-KO cells were transfected with siCtrl or siUBR1/UBR2/UBR4 for 72 h (n = 3 independent experiments). g Immunoblot analysis of endogenous p62 and CUL5 protein levels. Arrowhead indicates NEDD8-CUL5. h Mitochondrial morphology was assessed by IF like in a. i Lysosome levels and j cell granularity (SSC-A) was determined by flow cytometry as in b and c, respectively (f, g). i, j Data are shown as mean ± SD (n = 3 independent experiments). *p = 0.0228, **p = 0.0051, ****p < 0.0001; one-way ANOVA with Šídák’s correction. ns not significant. Source data are provided as a Source Data file.
Fig. 6
Fig. 6. Drosophila Naa30A is required for normal longevity, fertility, and age-dependent motility.
a Loss of Naa30A significantly reduces adult male longevity. Survival curves of control males, Naa30A deletion males, and Naa30A deletion males carrying the Naa30A genomic rescue 1 (two biological replicas). Statistical significance was assessed using the log-rank (Mantel–Cox) test, n > 50. b Naa30A deletion males show an accelerated age-dependent loss of motility. Males are from two independent biological replicas and age is indicated. Each data point represents the average climbing ability 10 males after 10 technical replicates, mean ± SEM is indicated. Naa30A deletion males exhibited a significant reduction in their climbing ability (1–4 days old males vs 4–7- or 7–10-days old males; p < 0.0001; one-way ANOVA with Šídák’s multiple comparisons test). c Naa30A deletion males show reduced flight ability. Flight ability of control males, Naa30A deletion males, and Naa30A deletion males carrying Naa30A genomic rescue 1, at the indicated age. Results are the mean ± SEM and were obtained with males collected from at least two independent crosses; n represents the total number of males tested. Statistical significance was assessed using the one-way ANOVA with Šídák’s multiple comparisons test. df Naa30A deletion males show reduced fertility and significant copulation defects. d Male fertility of wild-type males, control males and Naa30A deletion males (all 1–4 days old). Results are the mean ± SD and were obtained with males collected from 2 to 4 independent crosses; n represents the total number of males tested. e Copulation success was measured by the percentage of wild-type, control and Naa30A deletion males that were able to initiate copulation with 5–7 days old wild-type adult female virgins within the indicated time intervals. All males were 1–4 days old. Results are the mean ± SD of 2 independent crosses; n represents the total number of males tested. f Percentage of developing embryos (syncytial nuclear divisions or later stages of development) from wild-type (OR) females crossed with 1–4 days old control males or Naa30A deletion males. Results are the mean ± SD of two independent experiments; n represents the total number of embryos scored. All indicated ages are after pupae eclosion. Source data are provided as a Source Data file.
Fig. 7
Fig. 7. Overexpression of UbcE2M in the muscles suppresses the longevity and motility defects of Drosophila Naa30A deletion.
a, b Accumulation of aggregate-like polyubiquitinated protein structures in muscles. Indirect flight muscles (IFM) from (a) young (0–3 days) and (b) old (28–31 days) males with the indicated genotypes. F-actin (red) and polyubiquitin (green). Scale bar, 10 μm. c Aggregate density (aggregate/mm2) as shown in a and b. Results are mean ± SEM. Each data point represents the aggregate density observed in a muscle fiber isolated from a male individual. d No correlation between the motility defects and aggregate density. Left panel: each data point represents the average climbing ability after 10 technical replicates of ~10 males (7–10 days). Two groups for each genotype were analyzed, mean ± SEM is indicated. Right panel: aggregate density (aggregate/mm2) in muscle fibers isolated from the males used in the climbing assay (left panel). Each data point represents the aggregate density observed in a muscle fiber isolated from a male individual. e Developmental defects of flight muscles. Left panel: IFMs stained for F-actin (red) and nuclei (green). Scale bar, 50 μm. *marks individual IFM. Right panel: Number of IFMs at the indicated ages. Data show the number of IFM per hemithorax. Mean ± SEM is indicated. f Developmental defects are rescued by UbcE2M overexpression in muscles. Number of IFMs in males in the indicated genotypes. Data show IFM per hemithorax and are dissected from 7 to 10 days old males. Mean ± SEM is indicated. g Overexpression of UbcE2M in the muscles suppresses the motility defects. Data show the average climbing ability after 10 technical replicates of a group of 10 males with 7–10 days, mean ± SEM is indicated. h Overexpression of UbcE2M in the muscles partially suppresses the adult longevity defects in Naa30A deletion. *p = 0.0455, ***p = 0.0005, log-rank test, n > 50). i UbcE2M overexpression does not suppress the accumulation of aggregate-like structures. Aggregate density (aggregate/mm2) observed in muscle fibers isolated from 0 to 3 days old Naa30A deletion males. Results are mean ± SEM and each data point represents a muscle fiber from a male individual. cg, i Statistical significance was assessed using the one-way ANOVA with Šídák’s multiple comparisons and male specimens collected from two independent crosses. All indicated ages are after pupae eclosion. Source data are provided as a Source Data file.
Fig. 8
Fig. 8. N-terminal acetylation by NatC shields proteins from degradation by preventing N-recognin UBR4-KCMF1 targeting.
(Left) The NatC complex co-translationally acetylates proteins harboring a hydrophobic residue in the second position (MΦ-). Following Nt-acetylation, the NEDD8 E2 ligases Ac-UBE2M and Ac-UBE2F promote cullin neddylation (N8), resulting in ubiquitylation (Ub) and proteasomal degradation of targeted cullin substrates, Ac-ARFRP1 is targeted to the Golgi where it plays a role in the secretory pathway, while the hypothetical proteins Ac-X and Ac-Y are thought to affect the secretory pathway and mitochondria, respectively. (Right) Loss of NatC exposes unacetylated MΦ-starting N-termini which serves as N-degrons that can be recognized by a set of N-recognins leading to proteasomal and, in some cases, lysosomal degradation. Non-Nt-acetylated NatC substrates are primarily targeted by the Arg/N-recognin UBR4-KCMF1 and to some extent via UBR1 and UBR2. Targeted degradation of non-Nt-acetylated NatC substrates leads to decreased cullin neddylation, increased mitochondrial elongation and fragmentation, and is thought to affect intracellular trafficking.

References

    1. Varland S, Osberg C, Arnesen T. N-terminal modifications of cellular proteins: the enzymes involved, their substrate specificities and biological effects. Proteomics. 2015;15:2385–2401. - PMC - PubMed
    1. Arnesen T, et al. Proteomics analyses reveal the evolutionary conservation and divergence of N-terminal acetyltransferases from yeast and humans. Proc. Natl Acad. Sci. USA. 2009;106:8157–8162. - PMC - PubMed
    1. Ree R, Varland S, Arnesen T. Spotlight on protein N-terminal acetylation. Exp. Mol. Med. 2018;50:1–13. - PMC - PubMed
    1. Aksnes H, Ree R, Arnesen T. Co-translational, post-translational, and non-catalytic roles of N-terminal acetyltransferases. Mol. Cell. 2019;73:1097–1114. - PMC - PubMed
    1. Cheng H, et al. Truncating variants in NAA15 are associated with variable levels of intellectual disability, autism spectrum disorder, and congenital anomalies. Am. J. Hum. Genet. 2018;102:985–994. - PMC - PubMed

Publication types