. 2023 Oct 27;14(1):6750.
doi: 10.1038/s41467-023-42305-3.

The α-synuclein PET tracer [18F] ACI-12589 distinguishes multiple system atrophy from other neurodegenerative diseases

Affiliations

The α-synuclein PET tracer [18F] ACI-12589 distinguishes multiple system atrophy from other neurodegenerative diseases

Ruben Smith et al. Nat Commun. .

Abstract

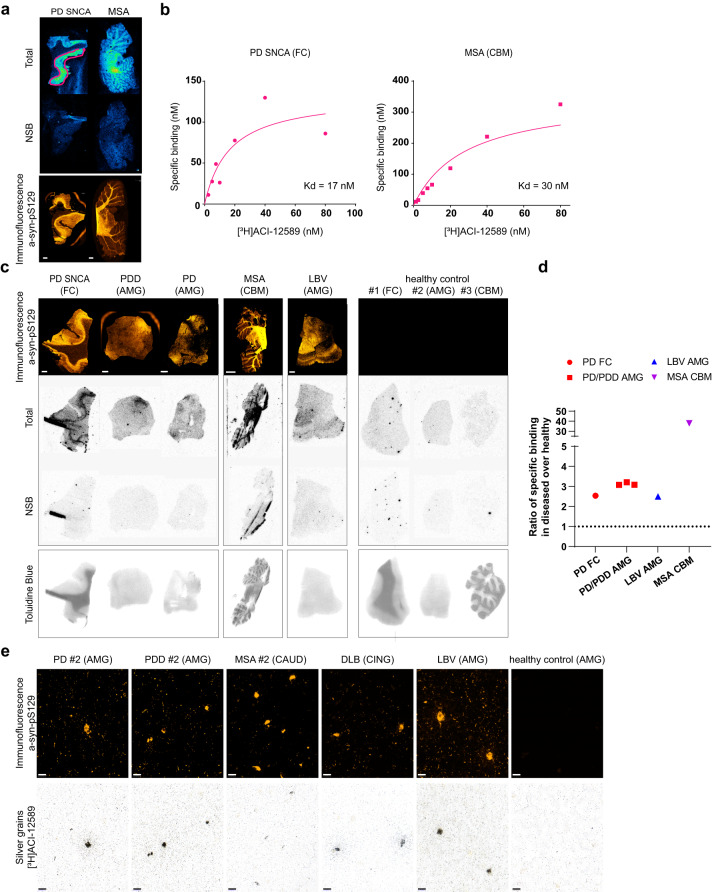
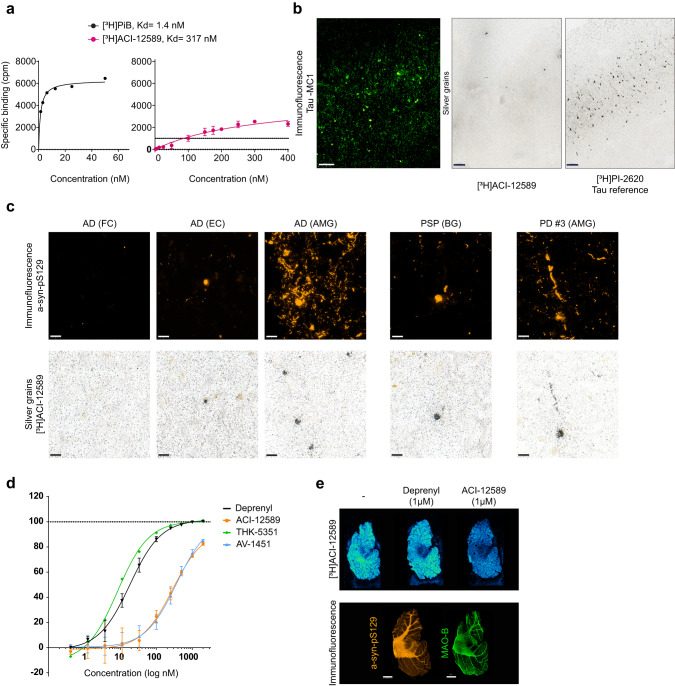
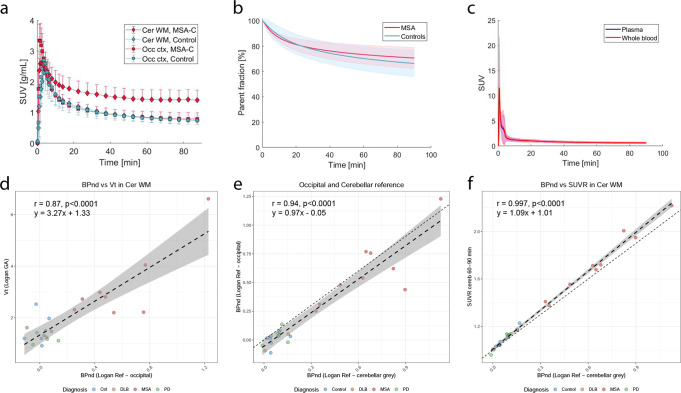
A positron emission tomography (PET) tracer detecting α-synuclein pathology will improve the diagnosis, and ultimately the treatment of α-synuclein-related diseases. Here we show that the PET ligand, [18F]ACI-12589, displays good in vitro affinity and specificity for pathological α-synuclein in tissues from patients with different α-synuclein-related disorders including Parkinson's disease (PD) and Multiple-System Atrophy (MSA) using autoradiography and radiobinding techniques. In the initial clinical evaluation we include 23 participants with α-synuclein related disorders, 11 with other neurodegenerative disorders and eight controls. In vivo [18F]ACI-12589 demonstrates clear binding in the cerebellar white matter and middle cerebellar peduncles of MSA patients, regions known to be highly affected by α-synuclein pathology, but shows limited binding in PD. The binding statistically separates MSA patients from healthy controls and subjects with other neurodegenerative disorders, including other synucleinopathies. Our results indicate that α-synuclein pathology in MSA can be identified using [18F]ACI-12589 PET imaging, potentially improving the diagnostic work-up of MSA and allowing for detection of drug target engagement in vivo of novel α-synuclein targeting therapies.


Conflict of interest statement

R.S. has received a speaker fee from Roche. F.C., E.V., J.M., T.T., V.H., I.K.D., R.L.-C., A. Pfeifer, M.K.-V., and J.S. are employees of AC Immune SA. M.S. is an employee of Antaros Medical. A Puschmann receives reimbursement from Elsevier for his work as Associate Editor for Parkinsonism and Related Disorders. P.S. has received consultancy/speaker fees from Abbvie, Amylyx, Lundbeck, and Takeda. C.S. and D.S.R. are employees of Invicro, LLC. O.H. has acquired research support (for the institution) from ADx, AVID Radiopharmaceuticals, Biogen, Eli Lilly, Eisai, Fujirebio, GE Healthcare, Pfizer, and Roche. In the past 2 years, he has received consultancy/speaker fees from AC Immune, Amylyx, Alzpath, BioArctic, Biogen, Cerveau, Eisai, Eli Lilly, Fujirebio, Genentech, Merck, Novartis, Novo Nordisk, Roche, Sanofi, and Siemens. T.O., J.J., M.A., P.M.-A., C.H., E.S., S.H., K.B., and E.T.L. report no disclosures.

Figures

Fig. 1
Fig. 1. ACI-12589 ex vivo binding properties in α-syn containing brain tissues and controls.
a Autoradiographic detection of [3H]ACI-12589 binding in brain tissue sections from a familial PD (SNCA) and an MSA case. Total: total binding (7.5 nM); Non-specific binding (NSB): residual binding in the presence of 5 μM unlabeled ACI-12589. Immunofluorescent staining of adjacent sections with α-syn-pS129. Scale bar, 2 mm. Representative data of at least two independent experiments. b Saturation binding studies with [3H]ACI-12589 on human brain tissue sections from the cases shown in (a). c Autoradiographic detection of [18F]ACI-12589 binding in brain tissue sections from different α-synucleinopathy cases and healthy controls. Total: total binding (1.7 nM); Non-specific binding: residual binding in the presence of 10 μM unlabeled ACI-12589. Immunofluorescent staining of adjacent sections with α-syn-pS129. Scale bar, 2 mm, except for MSA image 5 mm. Toluidine blue staining differentiates gray versus white matter distributions. Representative data of two independent experiments for PD SNCA and PD. Data from one experiment for the rest of the samples. d Ratios of specific binding in PD (red), LBV-AD (blue) and MSA (purple) pathology over the mean, brain region-matched, healthy control values. Dotted line indicates the ratio of 1 corresponding to no difference from healthy controls. Specific binding was calculated as total binding minus NSB for each sample.; PD FC: Frontal cortex (2 replicates of one SNCA case); PD/PDD AMG: Amygdala (one PD and 2 PDD cases). Each dot represents one case. When two sections of the same case were analyzed (e.g. SNCA case), the mean value is shown. e High-resolution autoradiography with [3H]ACI-12589 (60 nM) in tissue from PD, PDD, MSA, DLB, LBV-AD and a healthy control. Immunofluorescence with α-syn-pS129 antibody (top panels). Accumulation of silver grains on Lewy bodies and neurites on the same section (bottom panels), showing co-labeling α-syn aggregates. Scale bar, 20 μm. Representative data of at least three independent experiments. CBM cerebellum, CAUD caudate, CING cingulate cortex, DLB dementia with Lewy Bodies, LBV-AD Lewy body variant of Alzheimer’s disease, PD idiopathic PD, PDD Parkinson’s disease with dementia, PD SNCA PD due to a SNCA G51D mutation.
Fig. 2
Fig. 2. ACI-12589 selectivity over common co-pathologies and off-target binding.
a Assessment of selectivity of [3H]ACI-12589 over β-amyloid and pathological tau aggregates. Saturation binding studies with [3H]ACI-12589 and the β-amyloid ligand [3H]PiB, in AD brain-derived homogenates. Mean ± SD of three independent experiments is shown for [3H]ACI-12589. b Immunofluorescence staining with MC1 antibody, labeling tau aggregates, in the entorhinal cortex of an AD patient (left). High-resolution autoradiography using [3H]ACI-12589 (60 nM) in the same tissue section (middle). The tau-binding ligand [3H]PI-2620 (60 nM) was included for reference (right). Scale bars, 200 µm. Representative data of at least three independent experiments. c Immunofluorescence with α-syn-pS129 antibody in brain tissue sections from AD, PSP and PD cases showing α-syn pathology (top panels). High-resolution ARG with [3H]ACI-12589 (60 nM) on the same sections, showing co-labeling of α-syn aggregates (bottom panels). Scale bars, 20 µm. Representative data of two independent experiments for AD (FC), PSP and PD#3 and data from one experiment for AD (EC) and AD (AMG). d Evaluation of ACI-12589 binding affinity to MAO-B in healthy control-derived brain homogenates. Competition binding studies with [3H]L-deprenyl to determine the inhibitor constant, Ki, values for deprenyl (black curve), ACI-12589 (orange curve), AV-1451 (blue curve) and THK-5351 (green curve). When two independent experiments were performed (deprenyl, ACI-12589, AV-1451), Mean ± SEM is shown. e Autoradiography with [3H]ACI-12589 (10 nM) in human tissue from the cerebellum of an MSA donor, containing both MAO-B and pathological α-syn aggregates. To assess signal displacement, adjacent sections were incubated with [3H]ACI-12589 in the presence of unlabeled ACI-12589 or Deprenyl at 1 μM concentrations. Autoradiograms for each case are shown. Immunofluorescence staining of adjacent sections with an antibody against phosphorylated α-syn at serine 129 (pSyn-S129) or MAO-B. Scale bar at 5 mm. Representative data of two independent experiments. AD Alzheimer’s disease, ARG autoradiography, cpm counts per minute, MAO-B mono-amine oxidase B, MSA multiple system atrophy, PD Parkinson’s disease, PSP progressive supranuclear palsy.
Fig. 3
Fig. 3. Kinetic modeling of [18F]ACI-12589 in vivo.
a Time activity curves for cerebellar white matter (diamonds) and occipital cortex (squares) in MSA (red, n = 6) and control participants (blue, n = 7) over the course of the PET scan (mean ± SD). b Parent fractions for MSA (red, n = 6) and control subjects (blue; n = 7; mean ± SD). c Whole blood (red) and plasma (blue) input functions. d Comparison of VTs in the cerebellar white matter derived from blood input Logan graphical analysis and Logan reference BPND values in the cerebellar white matter using an occipital reference region. R-value 0.87 (95% C.I. [0.71–0.95]) derived using Pearson’s correlation (t = 7.9643, df = 20, p value = 1.2e−07). e Comparison of Logan reference BPND values in the cerebellar white matter with occipital and cerebellar reference regions. The cerebellar reference region shows slightly higher BPND values in comparison to the occipital reference. R-value 0.94 (95% C.I. [0.87–0.97]) derived using Pearson’s correlation (t = 13.401, df = 23, p value = 2.4e−12). f Comparison of SUVRcer values in the cerebellar white matter in the 60–90 min time interval with Logan reference BPND values, showing a linear relationship. R-value 0.997 (95% C.I. [0.992–0.998]) derived using Pearson’s correlation (t = 57.186, df = 23, p value < 2.2e−16). The error bands in (df) represent the 95% C.I. of the dashed linear regression line. BPND non-displaceable binding potential, Cer WM cerebellar white matter, DLB dementia with Lewy bodies, Logan GA Logan graphical analysis model, Logan Ref Logan reference tissue model, MSA multiple system atrophy, MSA-C multiple system atrophy with a cerebellar phenotype, PD Parkinson’s disease, SUV standardized uptake value, SUVRcer Standardized uptake value ratio, with a cerebellar gray matter reference region, VT volume of distribution.
Fig. 4
Fig. 4. [18F]ACI-12589 PET in participants with α-synucleinopathies.
a Transversal images at the level of the middle cerebellar peduncles in a control participant, and patients with DLB, MSA-C and PD. b Transversal images at the level of the basal ganglia in a control participant, and patients with DLB, MSA-P and PD. SUVR images for (a, b) have been created using occipital cortex as a reference region. c SUVR values in the cerebellar white matter in the different disease groups (Ctrl n = 8, DLB n = 2, MSA-C n = 8, MSA-P n = 5, PD n = 8). d VT values derived from Logan graphical analysis modeling in the cerebellar white matter in the different disease groups with available blood and dynamic PET data. Boxplots show median, IQR (box) and whiskers (Q1 − 1.5*IQR/Q3 + 1.5*IQR or minimum/maximum value, outliers not included) (Ctrl n = 7, DLB n = 2, MSA-C n = 6, MSA-P n = 2, PD n = 5). DLB dementia with Lewy bodies, MSA-C multiple system atrophy with a cerebellar phenotype, MSA-P multiple system atrophy with a parkinsonian phenotype, occ occipital cortex reference region, PD Parkinson’s disease, SUVR standardized uptake value ratio, VT volume of distribution.
Fig. 5
Fig. 5. [18F]ACI-12589 retention before and after Selegiline.
a shows SUV images from two participants with MSA-C before (left) and after (right) treatment for 6 days with 10 mg Selegiline. b shows changes in SUVR before and after treatment (n = 6) in Cerebellar white matter (CBW), Lentiform Nuclei (summed bilateral putamen and globus pallidus), Temporal cortex and Occipital cortex. Boxplots show median, IQR (box) and whiskers (Q1 − 1.5*IQR/Q3 + 1.5*IQR or minimum/maximum value, outliers not included). CBW cerebellar white matter, SUV standardized uptake value, SUVR standardized uptake value ratio.
Fig. 6
Fig. 6. [18F]ACI-12589 retention in other neurodegenerative disorders.
a transversal images at the level of the middle cerebellar peduncles (upper row) and the basal ganglia (bottom row) in representative patients with MSA-C, MSA-P, PSP, Friedreich Ataxia and cerebellar ataxia due to a SAMD9L mutation. SUVR images in (a) have been created using occipital cortex as reference region. b transversal images at the level of the substantia nigra in patients with AD using [18F]ACI-12589, [18F]RO948 (tau), and [18F]Flutemetamol (β-amyloid) as indicated above. SUVR images were generated using a cerebellar (ACI-12589 and RO948) or pons (Flutemetamol) reference region. c SUVRocc values in the cerebellar white matter in the different disease groups. d SUVRocc values in the middle cerebellar peduncles in the different disease groups. Boxplots show median, IQR (box) and whiskers (Q1 − 1.5*IQR/Q3 + 1.5*IQR or minimum/maximum value, outliers not included). N—numbers for (c, d): AD n = 5, Ataxia n = 3, Ctrl n = 8, MSA-C n = 8, MSA-P n = 5, PSP n = 3). AD Alzheimer’s disease, Ataxia cerebellar ataxias (Friedreich Ataxia and cerebellar ataxia due to a SAMD9L mutation), cereb cerebellar gray matter reference region, Ctrl control subjects, MSA-C multiple system atrophy with a cerebellar phenotype, MSA-P multiple system atrophy with a parkinsonian phenotype, PSP progressive supranuclear palsy, SUVRocc SUVR with an occipital cortex reference region, SUVR standardized uptake value ratio.

References

    1. Hansson O. Biomarkers for neurodegenerative diseases. Nat. Med. 2021;27:954–963. doi: 10.1038/s41591-021-01382-x. - DOI - PubMed
    1. McKeith IG, et al. Diagnosis and management of dementia with Lewy bodies: Fourth Consensus Report of the DLB Consortium. Neurology. 2017;89:88–100. doi: 10.1212/WNL.0000000000004058. - DOI - PMC - PubMed
    1. Fanciulli A, et al. Multiple system atrophy. Int. Rev. Neurobiol. 2019;149:137–192. doi: 10.1016/bs.irn.2019.10.004. - DOI - PubMed
    1. Miki Y, et al. Improving diagnostic accuracy of multiple system atrophy: a clinicopathological study. Brain. 2019;142:2813–2827. doi: 10.1093/brain/awz189. - DOI - PubMed
    1. Goedert M, Spillantini MG, Del Tredici K, Braak H. 100 years of Lewy pathology. Nat. Rev. Neurol. 2013;9:13–24. doi: 10.1038/nrneurol.2012.242. - DOI - PubMed

Publication types

MeSH terms

Substances