. 2023 Oct 27;14(1):6858.
doi: 10.1038/s41467-023-42634-3.

Mitochondrial dysfunction promotes the transition of precursor to terminally exhausted T cells through HIF-1α-mediated glycolytic reprogramming

Affiliations

Mitochondrial dysfunction promotes the transition of precursor to terminally exhausted T cells through HIF-1α-mediated glycolytic reprogramming

Hao Wu et al. Nat Commun. .

Abstract

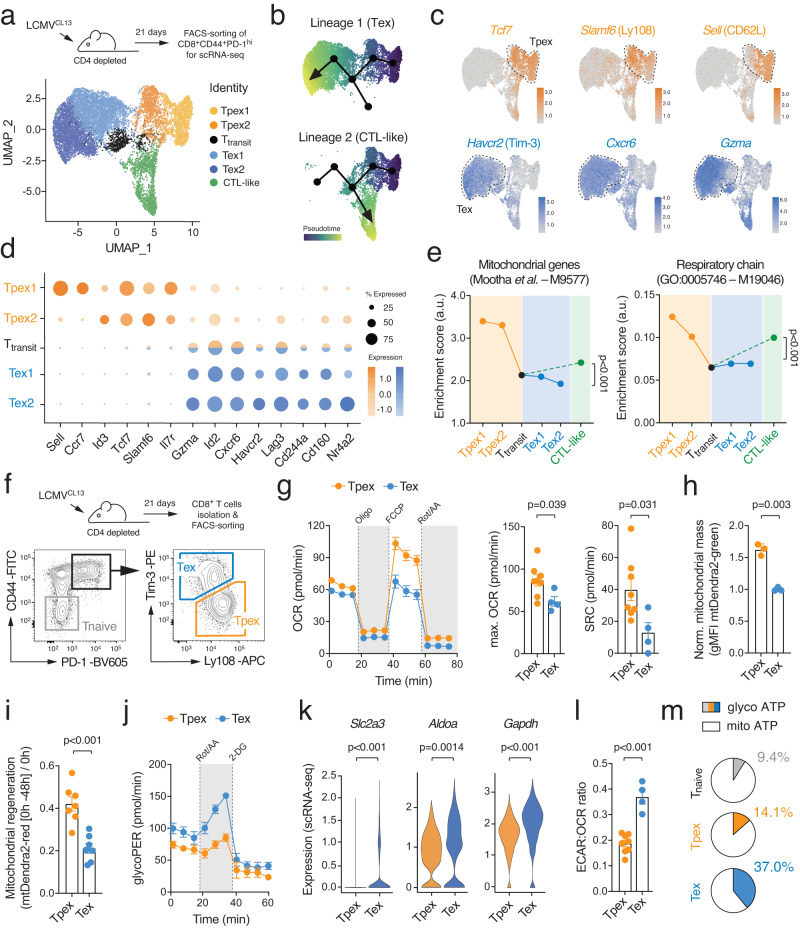
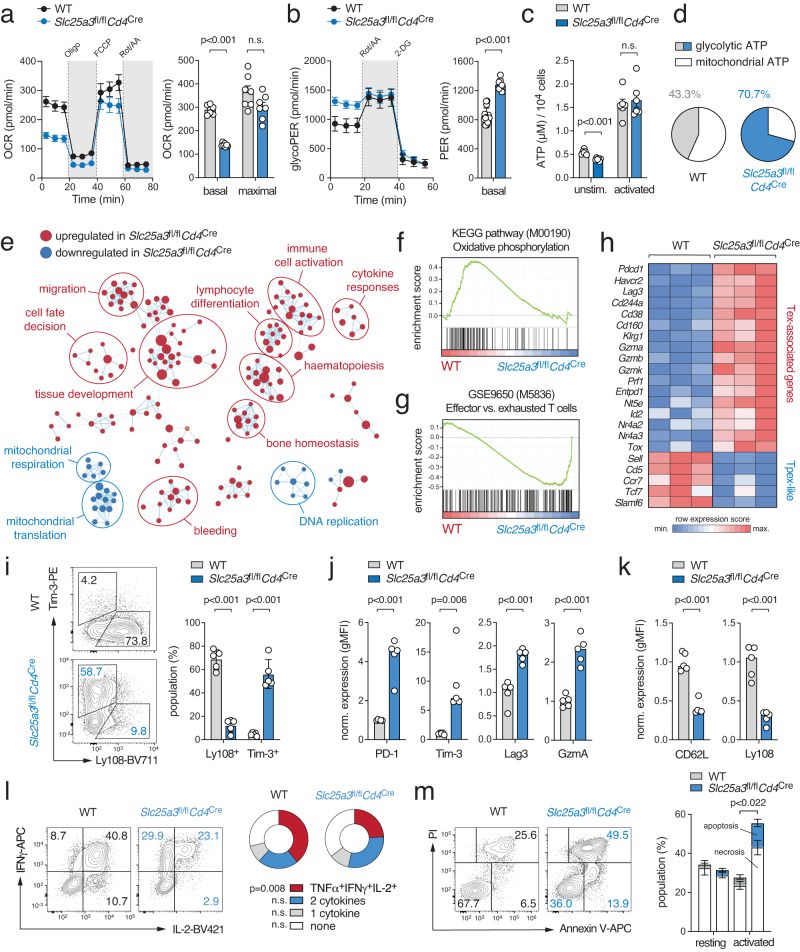
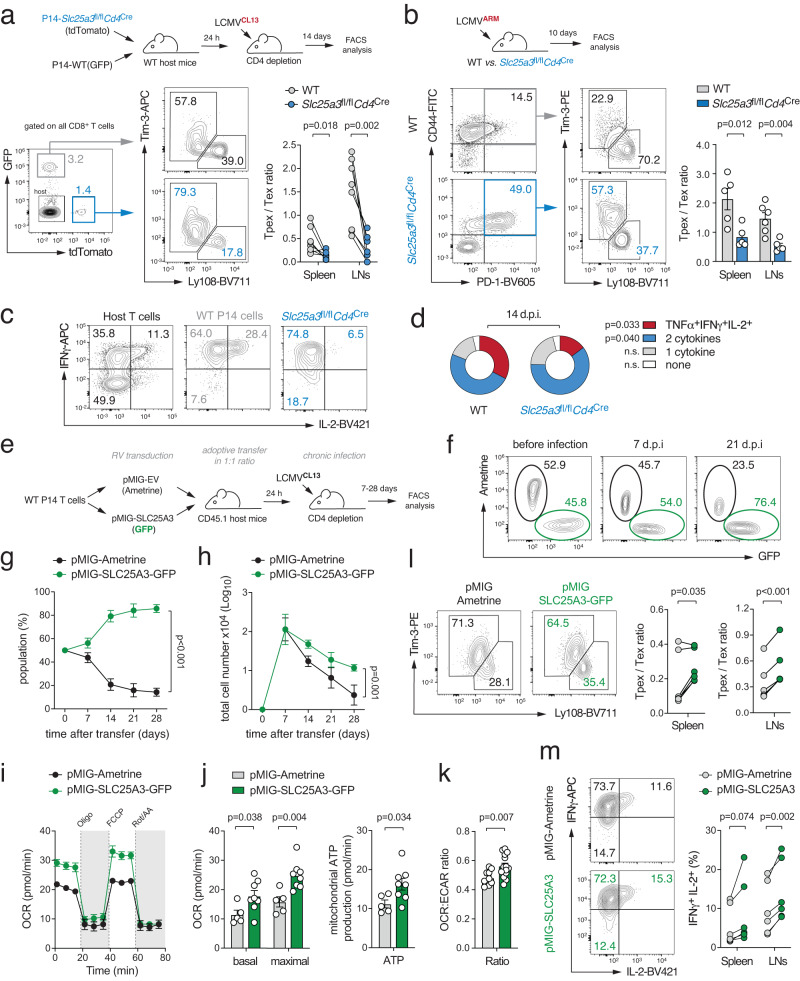
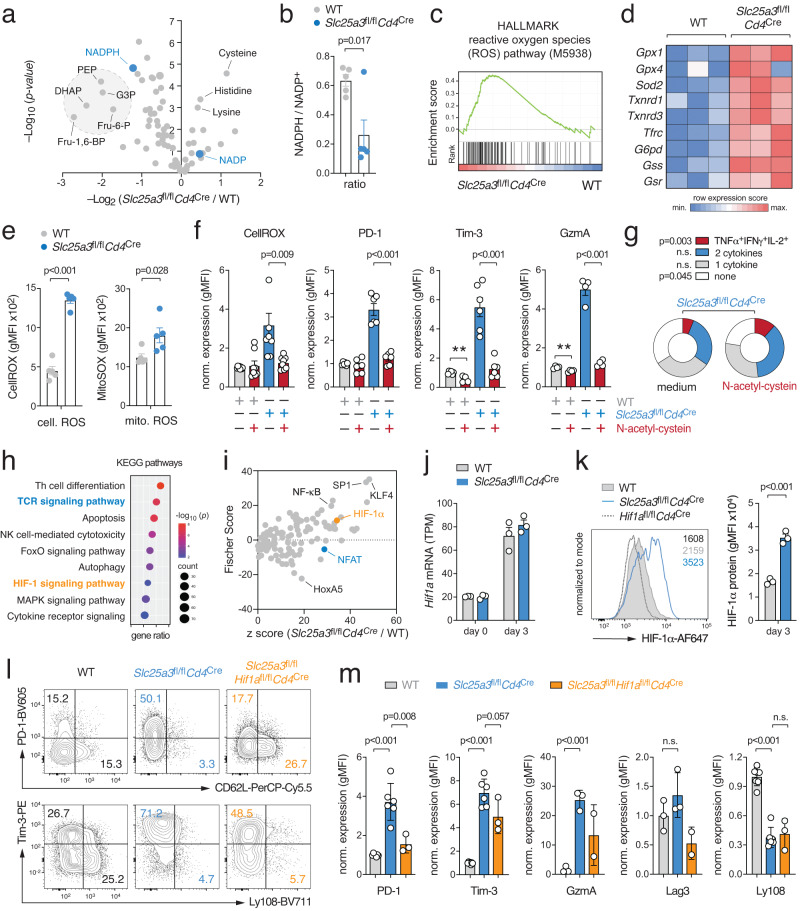
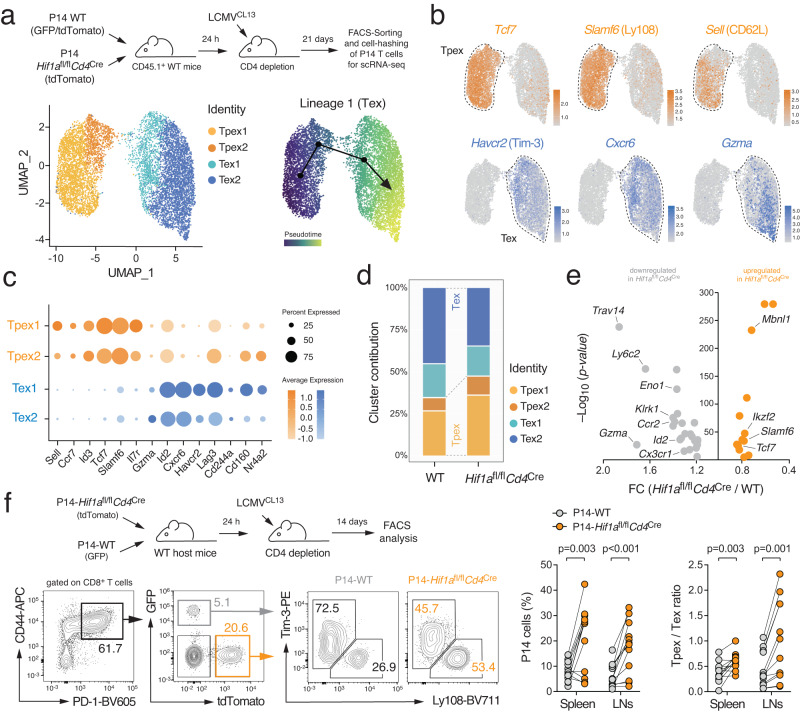
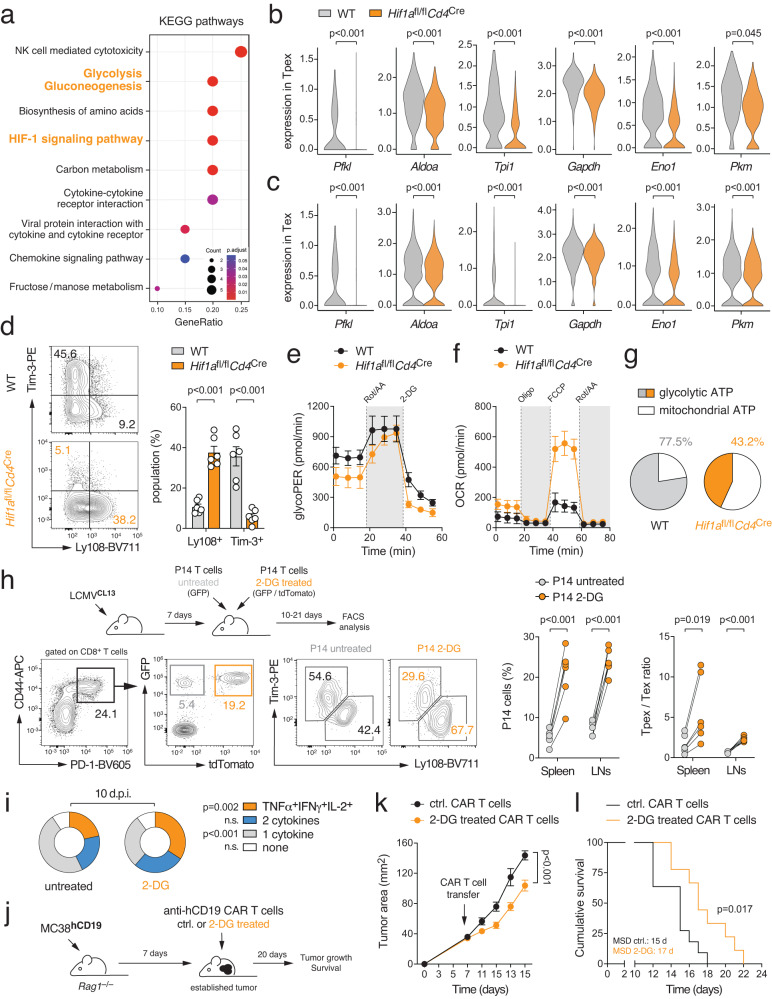
T cell exhaustion is a hallmark of cancer and persistent infections, marked by inhibitory receptor upregulation, diminished cytokine secretion, and impaired cytolytic activity. Terminally exhausted T cells are steadily replenished by a precursor population (Tpex), but the metabolic principles governing Tpex maintenance and the regulatory circuits that control their exhaustion remain incompletely understood. Using a combination of gene-deficient mice, single-cell transcriptomics, and metabolomic analyses, we show that mitochondrial insufficiency is a cell-intrinsic trigger that initiates the functional exhaustion of T cells. At the molecular level, we find that mitochondrial dysfunction causes redox stress, which inhibits the proteasomal degradation of hypoxia-inducible factor 1α (HIF-1α) and promotes the transcriptional and metabolic reprogramming of Tpex cells into terminally exhausted T cells. Our findings also bear clinical significance, as metabolic engineering of chimeric antigen receptor (CAR) T cells is a promising strategy to enhance the stemness and functionality of Tpex cells for cancer immunotherapy.


Conflict of interest statement

The authors declare no competing interests.

Figures

Fig. 1
Fig. 1. T cell exhaustion is characterized by metabolic reprogramming.
a C57BL/6 mice were chronically infected with the LCMV strain clone 13 (LCMVCL13) and CD8+CD44+PD-1hi T cells were subjected to single-cell RNA sequencing 21 days post infection. Uniform manifold approximation and projection (UMAP) visualization of ~ 13.000 non-proliferating (Mki67 negative) T cells colored based on their classification into six clusters. b Prediction of developmental trajectories using slingshot analysis; cells are color-coded according to pseudotime. c Normalized gene expression of Tcf7, Slamf6 (Ly108), Sell (CD62L), Havcr2 (Tim-3), Cxcr6 and Gzma projected onto UMAP clusters. d Dot plot analysis of selected markers representing Tpex and Tex cell subsets; color intensity and dot size represent z-score mean expression and percentage of cells expressing the gene, respectively. e Enrichment of mitochondrial and respiratory chain gene expression signatures in clusters representing Tpex, CTL-like and terminally exhausted (Tex) cells. f Flow cytometric cell sorting strategy of Tpex and Tex cells from chronically infected mice. g Analyzes of oxygen consumption rate (OCR) and spare respiratory capacity (SRC) of Tpex (n = 9 mice) and Tex cells (n = 4 mice) using a Seahorse extracellular flux analyzer; means ± SEM. h Analysis of mitochondrial content in Tpex and Tex cells using LCMVCL13 infected mito-Dendra2 mice; means ± SEM of 3 mice. i Mitochondrial regeneration of mito-Dendra2 Tpex and Tex cells after photoconversion in vitro; means ± SEM of 7 mice. j Glycolytic proton efflux rate (glycoPER) analyzes of Tpex (n = 5 mice) and Tex cells (n = 2 mice) using a Seahorse extracellular flux analyzer; means ± SEM. k Violin plots displaying Slc2a3 (GLUT3), Aldoa and Gapdh gene expression in Tpex and Tex cell clusters as shown in (a). l Ratio of extracellular acidification rate (ECAR) to OCR of FACS-sorted Ly108+ Tpex and Tim3+ Tex isolated from chronically infected mice ex vivo; means ± SEM of 4-8 mice. m Relative contribution of glycolysis and mitochondrial respiration to cellular ATP production in naïve (n = 10 mice), Tpex (n = 6 mice) and Tex cells (n = 4 mice). Unpaired two-tailed Student’s t-test in (g-i), (k), (l) and two-way ANOVA in (e).
Fig. 2
Fig. 2. Genetic suppression of mitochondrial ATP production promotes glycolytic-transcriptional reprogramming of T cells.
a, b Analyzes of (a) oxygen consumption rate (OCR) and (b) glycolytic proton efflux rate (glycoPER) of WT and mPiC-deficient (Slc25a3fl/flCd4Cre) T cells at day 2 of culture using a Seahorse extracellular flux analyzer; means ± SEM of 7 mice. c Analysis of ATP concentrations in unstimulated and anti-CD3/CD28 activated WT and mPiC-deficient T cells; means ± SEM of 6 mice. d Relative contribution of glycolysis and mitochondrial respiration to cellular ATP production in anti-CD3/CD28 stimulated WT and mPiC-deficient T cells; means of 3 mice. e Network clustering of RNA sequencing data of significantly (p < 0.05) enriched gene expression signatures between CTL-differentiated WT and mPiC-deficient T cells. Down- and upregulated gene signatures in mPiC-deficient T cells are shown in blue and red, respectively. f, g Gene set enrichment analysis (GSEA) of (f) oxidative phosphorylation (KEGG pathway) and (g) effector versus exhausted T cells (GSE9650) gene signatures in differentiated WT and mPiC-deficient T cells after 6 days of culture. h Heatmap expression analysis of selected genes in WT and mPiC-deficient CTLs after 6 days in culture. ik Differentiation of WT and mPiC-deficient T cells in vitro, means ± SEM of 5 mice. j, k Flow cytometric quantification of (j) exhaustion and (k) memory marker expression in WT and mPiC-deficient CTLs, means ± SEM of 5 mice. l Analysis of polyfunctional TNFα, IFNγ and IL-2 expression by WT and mPiC-deficient T cells after 6 days of culture and anti-CD3/CD28 restimulation; means ± SEM of 3 mice. m Analysis of apoptosis in resting and anti-CD3/CD28 stimulated T cells by flow cytometry; means ± SEM of 3 mice. Two-tailed unpaired Student’s t-test in (ac) and (im).
Fig. 3
Fig. 3. Mitochondrial respiration controls the functional exhaustion of virus-specific T cells.
a Adoptive co-transfer of GFP+ WT and tdTomato+ mPiC-deficient (Slc25a3fl/flCd4Cre) P14 T cells into C57BL/6 mice before chronic infection with LCMV clone 13 (LCMVCL13). Flow cytometric analysis of Tpex and Tex cells in spleen and LNs of the host mice 14 days post infection (d.p.i.); n = 8 mice. b Acute infection of WT and Slc25a3fl/flCd4Cre mice with LCMV Armstrong (LCMVARM). Analysis of Tpex and Tex cells was performed 10 d.p.i.; means ± SEM of 5 mice. c, d Analysis of TNFα, IFNγ, and IL-2 expression after PMA/iono restimulation of WT and mPiC-deficient P14 T cells after co-transfer into chronically infected mice; means ± SEM of 6–10 mice. em Ectopic expression of mPiC attenuates T cell exhaustion. e Retroviral transduction of WT P14 T cells with GFP+ SLC25A3/mPiC or Ametrine+ empty vector followed by adoptive co-transfer into chronically infected mice. f Representative flow cytometric analysis of GFP+ and Ametrine+ P14 T cells after transfer into LCMVCL13 infected CD45.1+ mice. g, h Relative and absolute numbers of GFP+ and Ametrine+ P14 T cells in the spleens; means ± SEM of 2-6 mice. i, j Basal and maximal oxygen consumption rate (OCR) (i) and mitochondrial ATP production rate (j) in mPiC (GFP+) and empty vector (Ametrine+) transduced P14 cells ex vivo 7 d.p.i. using a Seahorse extracellular flux analyzer; means ± SEM of 3 mice analyzed in 2-3 technical replicates. k Ratio of OCR to extracellular acidification rate (ECAR) in mPiC overexpressing versus empty vector T cells; means ± SEM of 3 mice analyzed in 5 technical replicates. l Flow cytometric analysis of Tpex and Tex cell ratio in mPiC (GFP+) and empty vector transduced (Ametrine+) P14 cells 7 d.p.i.; n = 6 mice. m IFNγ and IL-2 expression in mPiC and empty vector transduced P14 cells after restimulation 7 d.p.i.; means ± SEM of 6 mice. Paired and two-tailed unpaired Student’s t-test in (a), (b), (d), and (im) or 2-way ANOVA in (g, h).
Fig. 4
Fig. 4. Mitochondrial insufficiency causes ROS-mediated HIF-1 α protein stabilization.
a Volcano plot of differential metabolite concentrations of in vitro activated WT and mPiC-deficient (Slc25a3fl/flCd4Cre) T cells analyzed by untargeted liquid chromatography and mass spectrometry (LC/MS); means ± SEM of 4 mice. b Analysis of NADPH/NADP+ ratios in WT and mPiC-deficient T cells using LC/MS; means ± SEM of 4 mice. c Gene set enrichment analysis (GSEA) of the reactive oxygen species (ROS) pathway gene signature in WT and mPiC-deficient T cells. d Heatmap analysis of selected genes involved in ROS detoxification. e Flow cytometric analysis of cellular (CellROX) and mitochondrial ROS (MitoSox) in WT and mPiC-deficient T cells; means ± SEM of 5 mice. f Scavenging of ROS by N-acetylcysteine (NAC) prevents exhaustion of mPiC-deficient T cells. Flow cytometric analyzes of CellRox, PD-1, Tim-3 and granzyme A expression in WT and mPiC-deficient T cells treated with NAC; means ± SEM of 4–8 mice. g Analysis of TNFα, IFNγ and IL-2 expression after PMA/iono restimulation of mPiC-deficient T cells treated with or without NAC; means ± SEM of 5 mice. h Kyoto Encyclopedia of Genes and Genomes (KEGG) pathway enrichment analysis using bulk RNA sequencing data of WT and mPiC-deficient T cells. i Upstream transcription factor prediction analysis using differentially expressed genes (DEGs) between WT and mPiC-deficient T cells. j Analysis of Hif1a gene expression in WT and mPiC-deficient T cells by RNA sequencing; means ± SEM of 3 mice. k Flow cytometric analysis of HIF-1α protein expression in WT, mPiC- and HIF-1α-deficient T cells; means ± SEM of 3 mice. l, m Differentiation of WT, mPiC-deficient (Slc25a3fl/flCd4Cre) and mPiC/HIF-1α double-deficient (Slc25a3fl/flHif1afl/flCd4Cre) T cells in vitro. Representative flow cytometric analysis (l) and quantification of PD-1, Tim-3, granzyme A, Lag3 and Ly108 expression on WT, mPiC-deficient and mPiC/HIF-1α double-deficient T cells (m); means ± SEM of 2–7 mice. Two-tailed unpaired Student’s t-test in (b), (e–g), (k) and (m).
Fig. 5
Fig. 5. HIF-1α controls terminal differentiation of virus-specific T cells.
a Adoptive co-transfer of WT (tdTomato+GFP+) and HIF-1α-deficient (tdTomato+) P14 T cells into C57BL/6 mice before chronic infection with LCMV clone 13 (LCMVCL13). 21 days post infection (d.p.i.), donor P14 WT and HIF-1α-deficient T cells were FACS sorted, barcoded, and multiplexed in a 1:1 ratio and subjected to single-cell RNA sequencing. Uniform manifold approximation and projection (UMAP) visualization of ~8.400 non-proliferating (Mki67 low/negative) T cells identified four clusters. Prediction of developmental trajectories using slingshot analysis; color-coding according to pseudotime. b Normalized gene expression of Tcf7, Slamf6 (Ly108), Sell (CD62L), Havcr2 (Tim-3), Cxcr6 and Gzma projected onto UMAP clusters. c Dot plot analysis of selected cluster markers representing Tpex and Tex cell subsets; color intensity and dot size represent z-score mean expression and percentage of cells expressing the gene, respectively. d Relative contribution of individual UMAP clusters in WT and Hif-1α-deficient P14 T cells. e Volcano plot of differentially expressed genes (DEGs) between WT and HIF-1α-deficient P14 T cells using scRNA sequencing. f Adoptive co-transfer of WT (GFP+) and HIF-1α-deficient (tdTomato+) P14 T cells into C57BL/6 mice before chronic infection with LCMVCL13. Flow cytometric analysis of Tpex and Tex cells was performed 14 d.p.i.; n = 12 mice. Two-tailed paired Student’s t-test in (f).
Fig. 6
Fig. 6. HIF-1α-mediated glycolytic reprogramming promotes T cell exhaustion.
a KEGG pathway enrichment analysis using single-cell RNA sequencing of WT and HIF-1α-deficient T cells. b, c Violin plots displaying Pfkl, Aldoa, Tpi1, Gapdh, Eno1, and Pkm gene expression in Tpex (b) and Tex cells (c) of WT and HIF-1α-deficient (Hif1afl/flCd4Cre) P14 T cells analyzed by single-cell RNA sequencing. d Differentiation of WT and HIF-1α-deficient T cells under hypoxia in vitro, means ± SEM of 6 mice. e, f Analyzes of glycolytic proton efflux rate (glycoPER) (e) and oxygen consumption rate (OCR) (f) in WT and HIF-1α-deficient T cells using a Seahorse extracellular flux analyzer; means ± SEM of 3 mice. g Relative contribution of glycolysis and mitochondrial respiration to cellular ATP production in WT and HIF-1α-deficient T cells; means ± SEM of 3 mice. h, i Inhibition of glycolysis sustains the stemness of virus-specific T cells. h Adoptive co-transfer of 2-DG treated (tdTomato+ GFP+) and control (GFP+) P14 T cells into C57BL/6 mice after chronic infection with LCMVCL13. Flow cytometric analysis of Tpex and Tex cells among donor P14 cells 10 d.p.i.; n = 6 mice. i Analysis of TNFα, IFNγ, and IL-2 expression by 2-DG-treated and control P14 T cells 10 days after co-transfer into chronically infected mice; means ± SEM of 6 mice. jl 2-DG treatment augments the antitumor efficacy of CAR T cells. j A total of 1 × 106 anti-hCD19 CAR T cells treated with or without 2-DG for 24 h were adoptively transferred into Rag1–/– mice 7 days after MC38 tumor inoculation. k, l Analysis of tumor growth (k) and cumulative survival (l) of tumor-bearing host mice after transfer of 2-DG or control-treated CAR T cells; means ± SEM of 9–11 mice. Unpaired and two-tailed paired Student’s t-test in (bd) and (h). In (k) and (l), 2-way ANOVA and Mantel-Cox test, respectively.

Comment in

References

    1. McLane LM, Abdel-Hakeem MS, Wherry EJ. CD8 T cell exhaustion during chronic viral infection and cancer. Annu. Rev. Immunol. 2019;37:457–495. doi: 10.1146/annurev-immunol-041015-055318. - DOI - PubMed
    1. Franco F, Jaccard A, Romero P, Yu YR, Ho PC. Metabolic and epigenetic regulation of T-cell exhaustion. Nat. Metab. 2020;2:1001–1012. doi: 10.1038/s42255-020-00280-9. - DOI - PubMed
    1. Zehn D, Thimme R, Lugli E, de Almeida GP, Oxenius A. ‘Stem-like’ precursors are the fount to sustain persistent CD8(+) T cell responses. Nat. Immunol. 2022;23:836–847. doi: 10.1038/s41590-022-01219-w. - DOI - PubMed
    1. Utzschneider DT, et al. Early precursor T cells establish and propagate T cell exhaustion in chronic infection. Nat. Immunol. 2020;21:1256–1266. doi: 10.1038/s41590-020-0760-z. - DOI - PubMed
    1. Im SJ, et al. Defining CD8+ T cells that provide the proliferative burst after PD-1 therapy. Nature. 2016;537:417–421. doi: 10.1038/nature19330. - DOI - PMC - PubMed

Publication types

Substances