. 2024 Feb;48(2):209-217.
doi: 10.1038/s41366-023-01400-7. Epub 2023 Oct 27.

A new approach to quantify visceral fat via bioelectrical impedance analysis and ultrasound compared to MRI

Affiliations

A new approach to quantify visceral fat via bioelectrical impedance analysis and ultrasound compared to MRI

Jana Hoffmann et al. Int J Obes (Lond). 2024 Feb.

Abstract

Background: Visceral adipose tissue (VAT) has been linked to systemic proinflammatory characteristics, and measuring it accurately usually requires sophisticated instruments. This study aimed to estimate VAT applying a simpler method that uses total subcutaneous fat and total body fat (BF) measurements.

Method: As part of our experimental approach, the subcutaneous fat mass (SFT) was measured via US (SFTtotal), and VAT was quantified by assessing MRI data. Both parameters were added to obtain total body fat (BFcalc). Those results were then compared to values obtained from a bioelectrical impedance analysis (BFBIA). Multiple regression analyses were employed to develop a simplified sex-specific equation for SFT, which was subsequently used in conjunction with BFBIA to determine VAT (VATEq).

Result: We observed excellent reliability between BFBIA and BFcalc, with no significant difference in body fat values (20.98 ± 8.36 kg vs. 21.08 ± 8.81 kg, p = 0.798, ICC 0.948). VATEq_female/male revealed excellent reliability when compared to VATMRI, and no significant difference appeared (women: 0.03 ± 0.66 kg with a 95% CI ranging from -1.26 kg to 1.32 kg, p = 0.815, ICC: 0.955.; men: -0.01 ± 0.85 kg with a 95% CI ranging from -1.69 kg to 1.66 kg, p = 0.925, ICC: 0.952).

Conclusion: Taking an experimental approach, VAT can be determined without MRI.


Conflict of interest statement

The authors declare no competing interests.

Figures

Fig. 1
Fig. 1. Polygonal traction measurement by PACS JiveX software.
a Selection of the overall intraabdominal area, b Two-dimensional measurement of organs/tissues area.
Fig. 2
Fig. 2. Correlation and Bland-Altman plot of BFcalc and BFBIA.
a Correlation of total body fat measured by BIA (BFBIA) and calculated via addition of SFTtotal and VATMRI (=BFcalc), Y = 0.998*X + 0.127. b Bland-Altman plot of BFBIA and BFcalc showing a mean difference of −0.10 ± 2.82 kg with lower and upper 95% CI −5.63 to 5.42 kg of the total sample.
Fig. 3
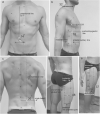
Fig. 3. VATEq landmarks.
a Intersection of parasternal line and a 45°line at umbilicus creates F14. b Paracervical landmark at midcervical spinal (F32); Intersection of anterior axillar line with horizontal 4. ICR line (F17) and xyphoid/epigastric line (F18). c Intersection between paravertebral line and posterior, horizontal line of cristia iliaca. d One orientation point is identified at half distance of the vertical line from end of lateral gluteal fold to the horizontal posterior upper patella pole line. This orientation point creates a horizontal line ending at the vertical trochanter major line, where F48 is identified at the center. e The distance of vertical trochanter major line ending at the posterior patella pole line forms three equal sizes or lengths. The last third constitutes a point in its center, which is horizontally extended to the vertical patella pole line. The center of that line forms the measurement point (F37). All landmarks are designed for the body’s right side.
Fig. 4
Fig. 4. Sex-specific correlation and Bland-Altman plot of VATMRI and VATEq.
(a) Correlation of VATEq_male/female compared to VATMRI: Ymale = 0.913*X + 0.652; Yfemale = 0.849*X + 0.458 (b) Bland-Altman plot of VATMRI and VAT Eq_male/female show a mean of difference of 0.03 ± 0.66 kg for women and −0.01 ± 0.85 kg for men. This graph shows upper and lower 95% CI of −1.47 kg up to 1.48 kg of total sample.

References

    1. Crudele L, Piccinin E, Moschetta A. Visceral adiposity and cancer: role in pathogenesis and prognosis. Nutrients. 2021;13. 10.3390/nu13062101. - PMC - PubMed
    1. Ladeiras-Lopes R, Sampaio F, Bettencourt N, Fontes-Carvalho R, Ferreira N, Leite-Moreira A, et al. The ratio between visceral and subcutaneous abdominal fat assessed by computed tomography is an independent predictor of mortality and cardiac events. Revista Espanola de Cardiologia. 2017;70:331–7. doi: 10.1016/j.rec.2016.09.010. - DOI - PubMed
    1. Tchernof A, Després J-P. Pathophysiology of human visceral obesity: an update. Physiol Rev. 2013;93:359–404. doi: 10.1152/physrev.00033.2011. - DOI - PubMed
    1. Després J-P, Lemieux I, Bergeron J, Pibarot P, Mathieu P, Larose E, et al. Abdominal obesity and the metabolic syndrome: contribution to global cardiometabolic risk. Arterioscler Thromb Vasc Biol. 2008;28:1039–49. doi: 10.1161/ATVBAHA.107.159228. - DOI - PubMed
    1. Kuk JL, Church TS, Blair SN, Ross R. Does measurement site for visceral and abdominal subcutaneous adipose tissue alter associations with the metabolic syndrome? Diabetes Care. 2006;29:679–84. doi: 10.2337/diacare.29.03.06.dc05-1500. - DOI - PubMed