. 2023 Oct 28;42(1):286.
doi: 10.1186/s13046-023-02865-0.

TMEM147 aggravates the progression of HCC by modulating cholesterol homeostasis, suppressing ferroptosis, and promoting the M2 polarization of tumor-associated macrophages

Affiliations

TMEM147 aggravates the progression of HCC by modulating cholesterol homeostasis, suppressing ferroptosis, and promoting the M2 polarization of tumor-associated macrophages

Jingjing Huang et al. J Exp Clin Cancer Res. .

Abstract

Background: The endoplasmic reticulum (ER) regulates critical processes, including lipid synthesis, which are affected by transmembrane proteins localized in the ER membrane. One such protein, transmembrane protein 147 (TMEM147), has recently been implicated for its role in hepatocellular carcinoma (HCC) tumorigenesis; however, the mechanisms remain unclear. We investigated the role of TMEM147 in HCC and the underlying mechanisms.

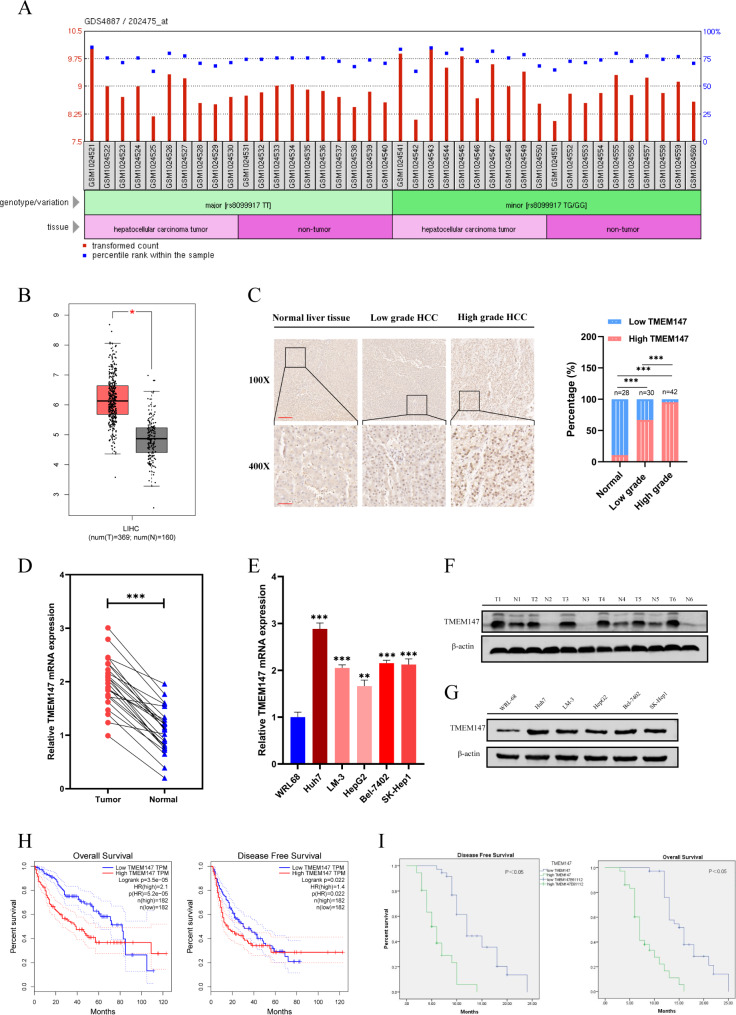
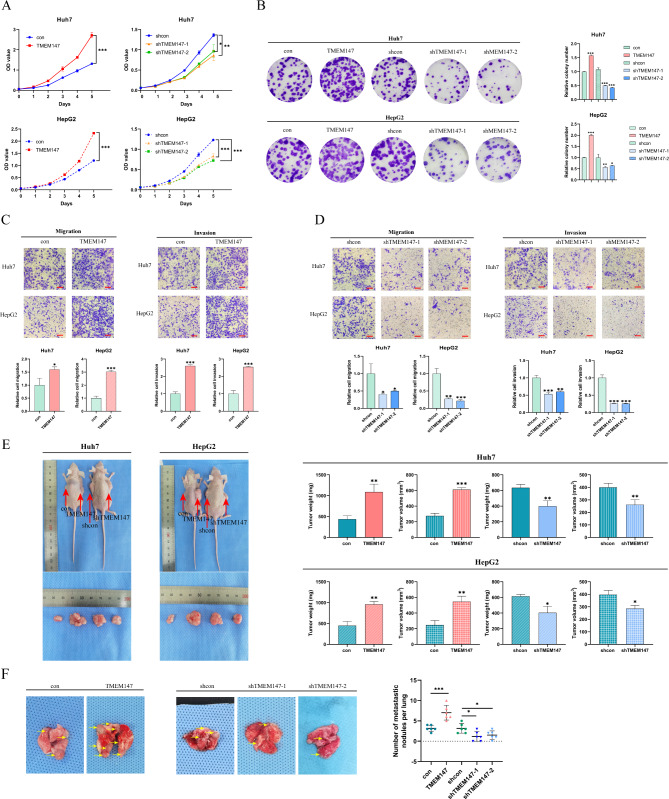
Methods: TMEM147 expression was examined in human HCC cells and adjacent non-tumorous tissues using quantitative reverse transcription-polymerase chain reaction, western blotting, and immunohistochemistry. In vitro and in vivo studies were conducted to investigate the impact of TMEM147 on the progression of HCC. Proteins interacting with TMEM147 were identified via RNA-seq, immunoprecipitation, and mass spectrometry analyses. Lipidomic analysis and enzyme-linked immunosorbent assay (ELISA) were employed to determine and analyze cholesterol and 27-hydroxycholesterol (27HC) contents. Extensive experimental techniques were used to study ferroptosis in HCC cells. The fatty acid content of macrophages affected by TMEM147 was quantified using ELISA. Macrophage phenotypes were determined using immunofluorescence assay and flow cytometric analysis.

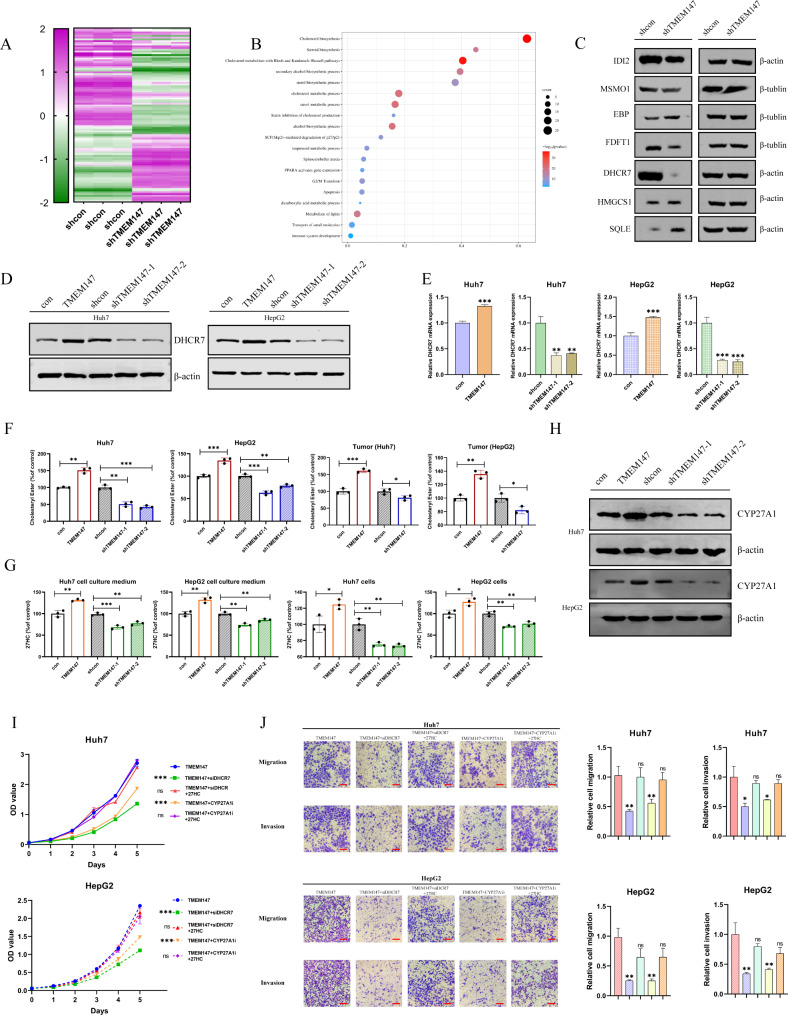
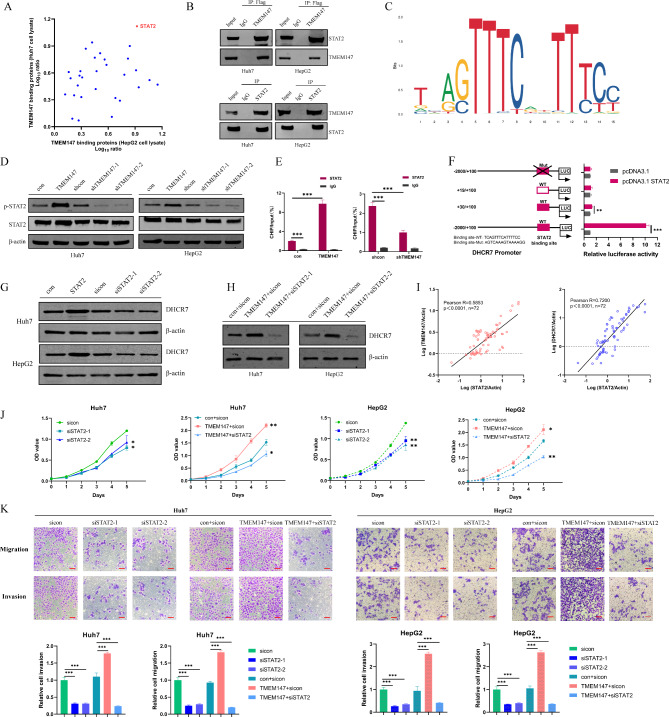
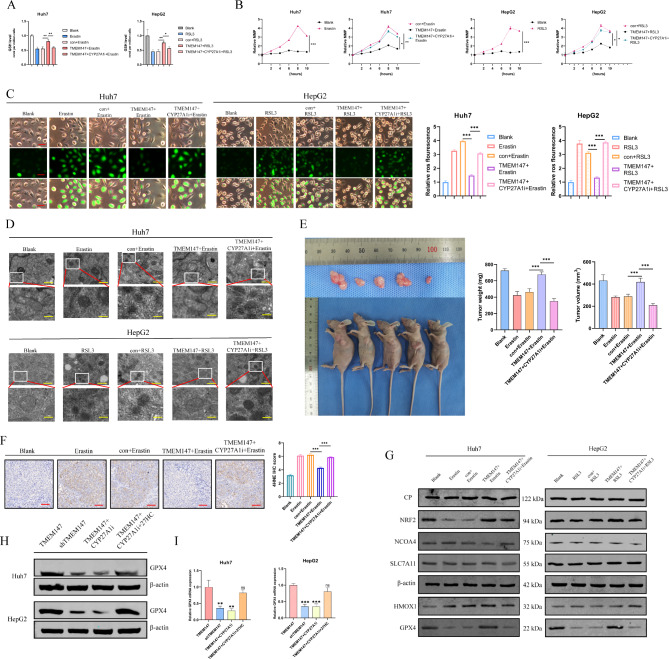
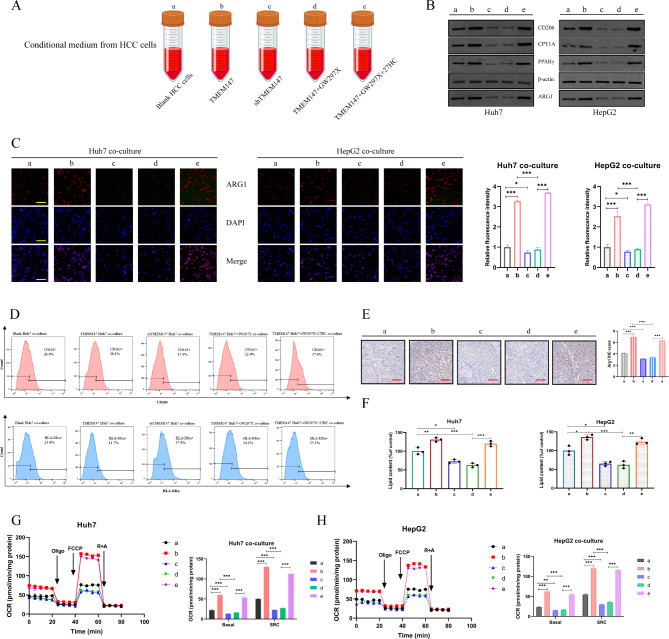
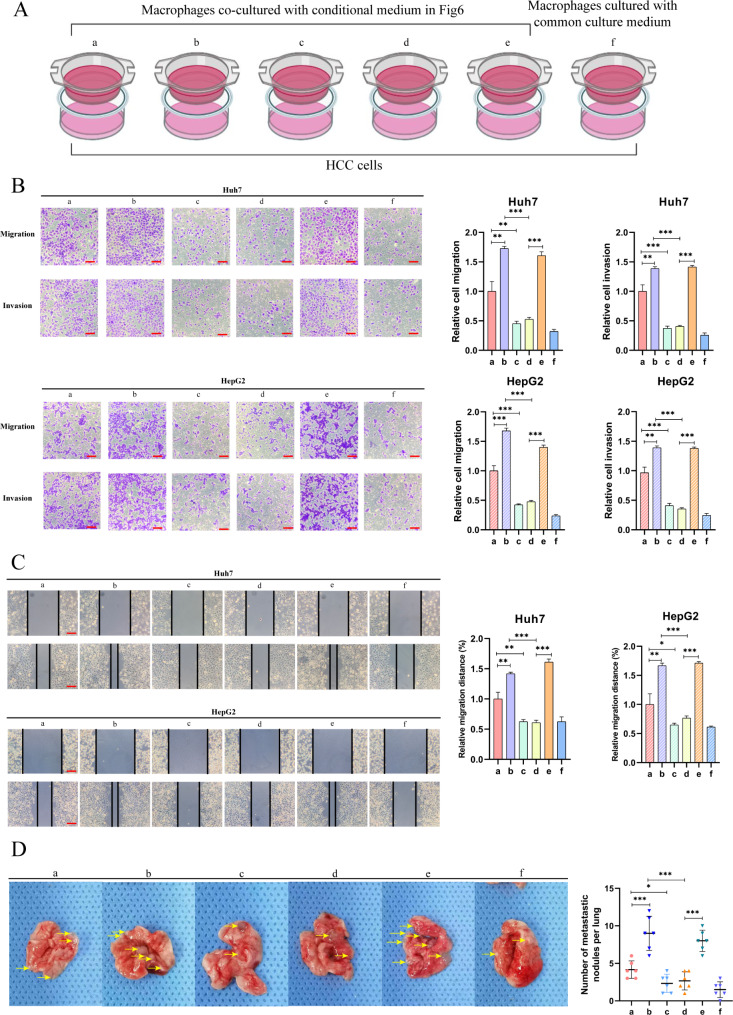
Results: TMEM147 mRNA and protein levels were increased in HCC cells, and the increased TMEM147 expression was associated with a poor survival. TMEM147 promoted tumor cell proliferation and metastases in vitro and in vivo. The protein was found to interact with the key enzyme 7-dehydrocholesterol reductase (DHCR7), which affected cellular cholesterol homeostasis and increased the extracellular levels of 27HC in HCC cells. TMEM147 also promoted the expression of DHCR7 by enhancing the activity of signal transducer and activator of transcription 2. 27HC expression upregulated glutathione peroxidase 4 in HCC, leading to ferroptosis resistance and promotion of HCC proliferation. HCC cell-derived 27HC expression increased the lipid metabolism in macrophages and activated peroxisome proliferator-activated receptor-γ signaling, thereby activating M2 macrophage polarization and promoting HCC cell invasion and migration.

Conclusions: Our results indicate that TMEM147 confers ferroptosis resistance and M2 macrophage polarization, which are primarily dependent on the upregulation of cellular cholesterol homeostasis and 27HC secretion, leading to cancer growth and metastasis. These findings suggest that the TMEM147/STAT2/DHCR7/27HC axis in the tumor microenvironment may serve as a promising therapeutic target for HCC.

Keywords: Cholesterol metabolites; Ferroptosis; Hepatocellular carcinoma; TMEM147; Tumor-associated macrophages.


Conflict of interest statement

The authors declare no competing interests.

Figures

Fig. 1
Fig. 1
TMEM147 was highly expressed in HCC and correlates with poor prognosis in HCC patients. (a) Differential expression of TMEM147 in the GDS4887 dataset. (b) TMEM147 expression levels in HCC (n = 369) and non-tumor tissues (n = 160) in GEPIA database. The differential analysis is based on the selected datasets with TCGA tumors versus TCGA normal + GTEx normal. Data are presented as mean ± SEM. *P < 0.01 (one-way ANOVA). (c) Representative images of TMEM147 IHC staining in normal liver tissues, high grade HCC and low-grade HCC tissues, and percentage of patients with HCC histological differentiation. Scale bars, × 100: 200 μm; × 400: 50 μm. (d) TMEM147 mRNA levels in HCC tissues and adjacent non-tumorous tissues. (e) qRT-PCR analysis of TMEM147 expression in HCC cell lines. (f) Western blot analysis of TMEM147 expression in HCC and matched non-tumor tissues. (g) TMEM147 protein levels in HCC cell lines and relative band density. (h) Kaplan–Meier overall survival and disease-free survival curves of patients with HCC with high (n = 182) and low (n = 182) expressions (stratified by median) of TMEM147 mRNAs in the GEPIA database using TCGA data (log-rank test). (i) Kaplan–Meier survival analysis of patients with HCC according to TMEM147 expression. All bar graphs are plotted as mean ± SEM of three independent experiments performed in triplicate. *P < 0.05, **P < 0.01, ***P < 0.001
Fig. 2
Fig. 2
TMEM147 promotes HCC proliferation, invasion, and migration in vitro and in vivo. (a) Growth curve assay based on CCK8 analysis in HCC cells. (b) Representative images of colony formation and statistical analysis of colony numbers. (c and d) Representative images of Transwell migration and Matrigel invasion assay for the indicated cells. Scale bars, 100 μm. (e) Representative images of subcutaneous xenograft derived from indicated HCC cells. (f) Representative images of lung metastasis specimens of lung metastasis derived from tail injection with indicated cells, TMEM147 overexpression formed more and larger metastatic nodules, whereas TMEM147 knockdown displayed fewer and smaller nodules. All experiments were performed three times and data are presented as mean ± SD. **p<0.01; ***p<0.001
Fig. 3
Fig. 3
TMEM147 upregulates 27HC by activating DHCR7, and promotes the progression of HCC.(a) RNA-seq revealed the differentially regulated genes between TMEM147-silenced cells and control cells. (b) Gene ontology (GO) analysis revealed that the differentially expressed genes were significantly enriched in cholesterol metabolism pathways. (c) Protein levels of key enzymes in cholesterol metabolism pathways in TMEM147-silenced and control Huh7 cells. (d) DHCR7 protein level of TMEM147 overexpression, silenced, and control cells. (e) DHCR7 mRNA level of TMEM147 overexpression, silenced, and control cells. (f) Cholesteryl esters (CEs) level of TMEM147 overexpression, silenced, and control HCC cells, and different TMEM147 expression subcutaneous tumors. Analyzed by ELISA assay. (g) 27HC level of TMEM147 overexpression, silenced, and control HCC cells, and corresponding cell culture medium. Analyzed by ELISA assay. (h) CYP27A1 protein level of TMEM147 overexpression, silenced, and control cells. (i) Growth curve assay based on CCK8 analysis in TMEM147 overexpression HCC cells with different condition, including DHCR7 silencing, CYP27A1 inhibiting, and addition of exogenous 27HC. (j) Representative images of Transwell migration and Matrigel invasion assay for the indicated cells. Scale bars, 100 μm
Fig. 4
Fig. 4
TMEM147 promoting the expression of DHCR7 depends on transcription factor STAT2. (a) TheTMEM147-interacting proteins were annotated with their Log10 ratio in Huh7 and HepG2 cell lysate. (b) IP assay showed that Flag-TMEM147-antibody could pull down STAT2 (upper panel). Correspondingly, STAT2-antibody also pulled down TMEM1477 (lower panel). (c) Schematic view of the putative binding sites and sequences of STAT2 on DHCR7 promoter region, predicted by the JASPAR and UCSC websites. (d) STAT2 and p-STAT2 (Tyr690) protein levels in TMEM147 overexpression and silenced and control HCC cells. (e) ChIP-qPCR assay was assessed using anti-STAT2 and anti-IgG antibody to identify STAT2 binding sites on the DHCR7 promoter in the indicated cells. (f) Luciferase reporter gene assays showed that binding of STAT2 to the wild-type DHCR7 promoter significantly increased the transcription of DHCR7. (g) DHCR7 protein levels in STAT2-overexpressing, silenced, and control HCC cells. (h) mRNA levels of TMEM147, DHCR7 and STAT2 relative to those of ACTIN were measured using RT-qPCR. Correlations among TMEM147, DHCR7 and STAT2 in HCC tumor are presented as Pearson’s correlation coefficients. (i) Growth curve assay based on CCK8 analysis; interaction effects between si-STAT2 and TMEM147 on HCC cell proliferation. (j) Representative images of Transwell assay; interaction effects between si-STAT2 and TMEM147 on HCC cell invasion and migration. Scale bars, 100 μm
Fig. 5
Fig. 5
TMEM147 upregulated 27HC and led to ferroptosis resistance by promoting GPX4 expression. (a) GSH levels were assayed in the indicated erastin or RSL3 treated cells. (b) MMP changes in the indicated erastin or RSL3 treated cells. (c) Measurement of ROS in the indicated erastin or RSL3 treated cells. Scale bars, 50 μm. (d) The indicated cells were treated with erastin or RSL3 and analyzed by TEM. Scale bars: 500 nm (rows 1 and 3) and 100 nm (rows 2 and 4). (e) Representative images of subcutaneous xenograft derived from indicated HCC cells. (f) Tumors were removed from mice and subjected to immunohistochemical staining with anti-4HNE antibodies. Representative images are shown. Scale bars: 50 μm. (g) The iron metabolism-related protein level in the indicated cells. (h) GPX4 protein levels in the indicated cells. (i) GPX4 mRNA levels in the indicated cells
Fig. 6
Fig. 6
27HC enhances lipid metabolism in macrophages and activates M2 polarization. (a) Schematic of conditional medium. (b) Protein levels of M2 macrophage marker arginase 1 (ARG1) and CD206, FAO rate-limiting enzyme CPT1A and PPARγ in the indicated macrophages. (c) Cell immunofluorescence of ARG1 in the indicated macrophages. Scale bars: 50 μm. (d) Flow cytometry of CD163 + and HLA-DRα + macrophages in different groups. (e) Tumors were removed from mice and subjected to immunohistochemical staining with anti-ARG1 antibodies. Representative images are shown. Scale bars: 50 μm. (f) Lipid content of the indicated macrophages. Analyzed by ELISA assay. (g and h) Oxygen consumption rates (OCRs) of the indicated macrophages, and the statistic results depicting the basal and maximal respiration and spare respiratory capacity in the indicated macrophages by analyzing the OCRs. Statistical significance was determined by two-tailed Student’s t test between control MΦs and TAMs. *, P < 0.05; **, P < 0.01; ***, P < 0.001
Fig. 7
Fig. 7
27HC-Induced polarized macrophages enhance migration of HCC cells. (a) The schematic of the co-culture method. (b) Representative images of Transwell migration and Matrigel invasion assay for the indicated cells. Scale bars, 100 μm. (c) Wound healing assay for the indicated cells. Scale bars, 100 μm. (d) Representative images of lung metastasis specimens of lung metastasis derived from tail injection with indicated cells

References

    1. Hepatocellular carcinoma [J] Journal. 2021;7(Issue):7.
    1. Dettmer U, Kuhn P, Abou-Ajram C, Lichtenthaler S, Krüger M, Kremmer E, Haass C, Haffner C. Transmembrane protein 147 (TMEM147) is a novel component of the Nicalin-NOMO protein complex [J] Journal. 2010;285(Issue):26174–26181. - PMC - PubMed
    1. Chen S, Novick P, Ferro-Novick S. ER structure and function [J] Journal. 2013;25(Issue):428–433. - PMC - PubMed
    1. McGilvray P, Anghel S, Sundaram A, Zhong F, Trnka M, Fuller J, Hu H. A Burlingame and R Keenan. An ER translocon for multi-pass membrane protein biogenesis [J]. Elife. 2020;9:e56889. - PMC - PubMed
    1. Rosemond E, Rossi M, McMillin S, Scarselli M, Donaldson J, Wess J. Regulation of M3 muscarinic receptor expression and function by transmembrane protein 147 [J] Journal. 2011;79(Issue):251–261. - PMC - PubMed